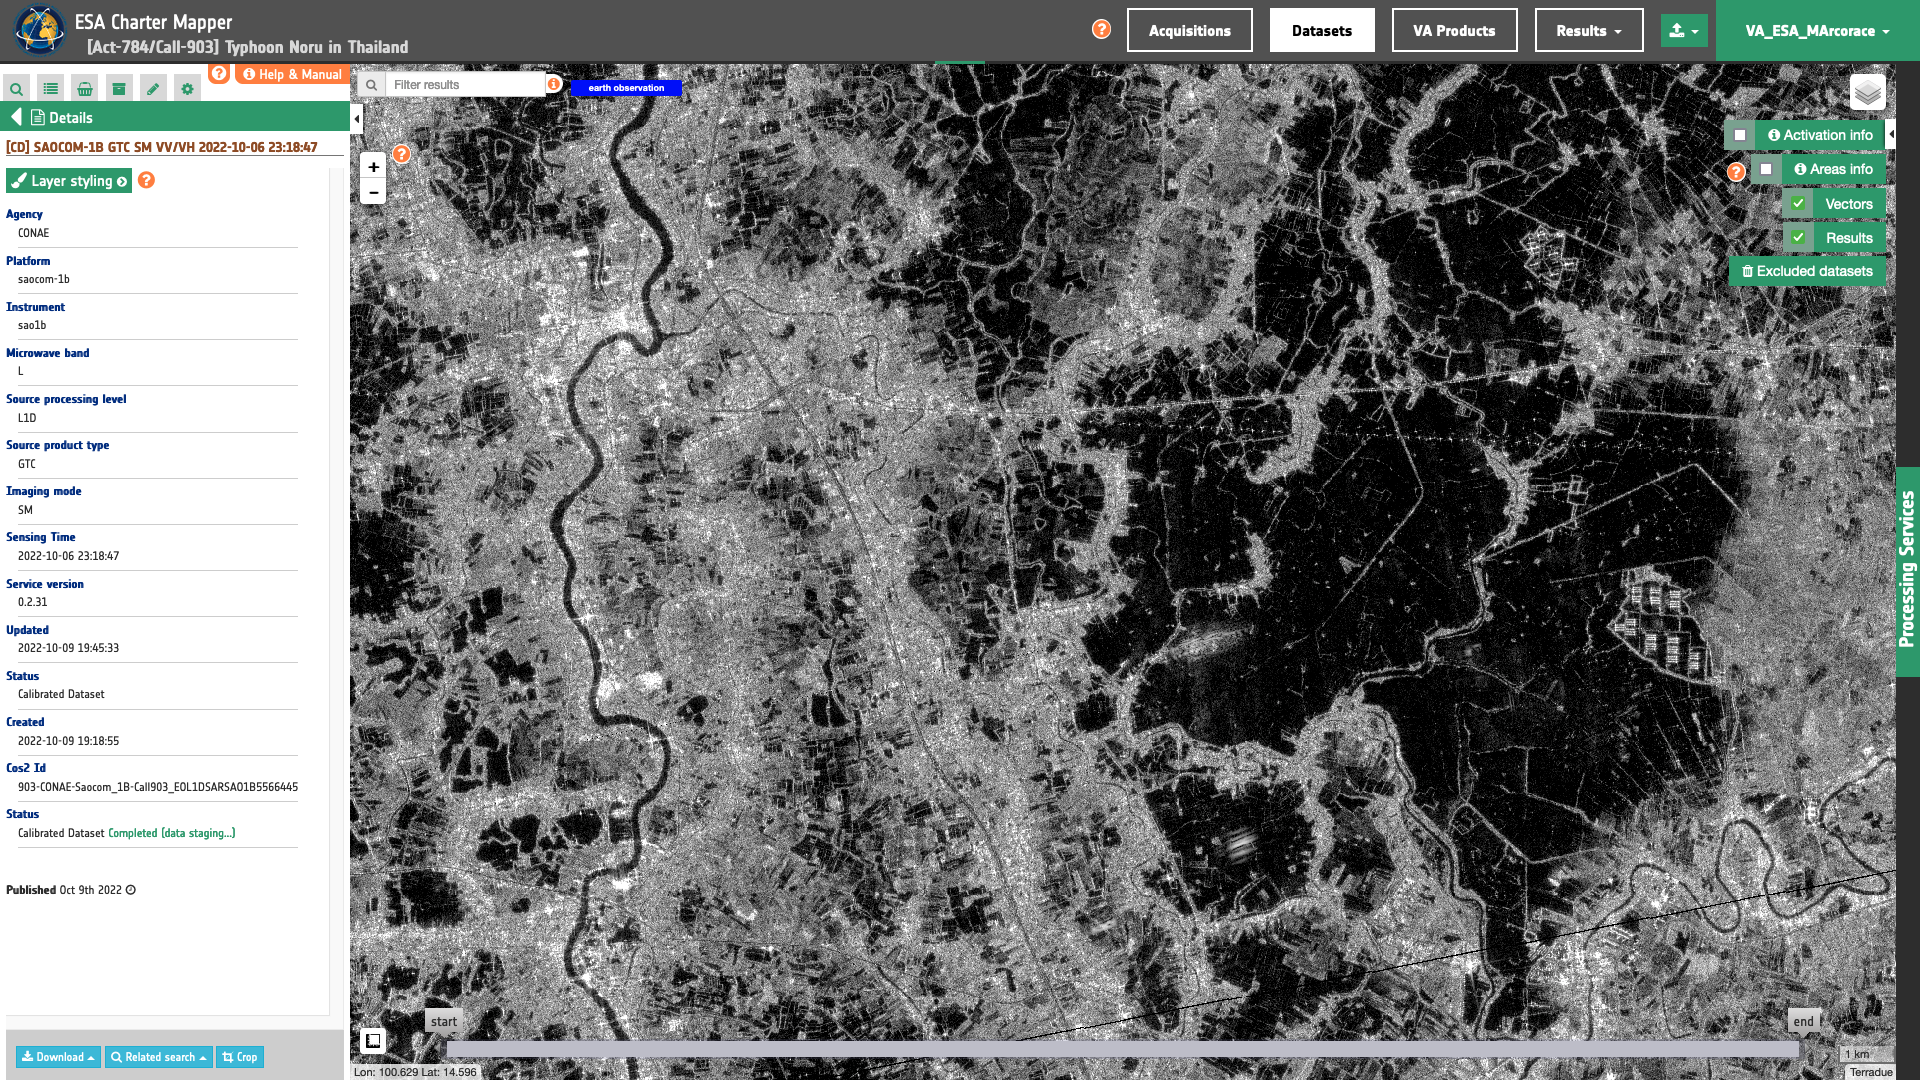
SAOCOM-1 L1 calibration
Ingested SAOCOM-1 GTC, GEC or SLC products1 are systematically calibrated in the ESA Charter Mapper using the Radar Products Calibration (SAR-Calib) processor.
Input
The input is a SAOCOM-1 Dataset derived from an ingested SAOCOM-1 GTC, GEC or SLC product, see details here.
Workflow
SAOCOM-1 SLC acquisitions are calibrated using plain matrix calculations or graphs built with the SNAP2,3 software, the open source common architecture for ESA Toolboxes ideal for the exploitation of Earth Observation data.
GTC or GEC
The workflow for the systematic generation of Radar Calibrated Datasets from SAOCOM-1 GTC or GEC products is described in the below graph.
This diagram represents the application of the SAR-Calib processor workflow applied for SAOCOM-1 GRD Datasets. More details about this systematic processor can be found here.
Note
The calibration of SAOCOM-1 GTC or GEC products has the objective to offer the following assets:
-
Sigma Nought single band assets at each polarization to be used for visualization in the map (with Select or Combine asset and binarization on the fly) and for processing (e.g. drag and drop a
s0_db_l_hhasset into the STACK service), -
multiple overview assets to be used only for visualization purposes (e.g. to visually compare with the slider in the map the
overview-vvasset with a similar one from another calibrated dataset).
SLC
The workflow for the systematic generation of Radar Calibrated Datasets from SAOCOM-1 SLC products is described in the below graph.
This diagram represents the application of the SAR-Calib processor workflow applied for SAOCOM-1 SLC Datasets. More details about this systematic processor can be found here.
Note
The calibration of SAOCOM-1 SLC products has the objective to offer the following assets:
-
a grayscale overview asset derived from co-pol geocoded Sigma Nought to be used only for visualization in the map,
-
magnitude (raster) and metadata (.XML and .XEMT) assets required for InSAR processing when drag and dropping a SLC dataset into an on-demand processor (e.g. DInSAR).
Warning
Being magnitude assets not geocoded, the only asset offered in a SAOCOM-1 SLC dataset which is visible in the map is the overview one.
Warning
The support of SAOCOM-1 SLC datasets into the ESA Charter Mapper InSAR processors is still on-going. Thus, it is currently not possible to employ SAOCOM-1 SLC datasets into on-demand processing.
Warning
Current version of SAR-Calib processor supports ONLY the calibration of SAOCOM-1 SLC products in StripMap (SM) mode.
Output
The output is a SAOCOM-1 GTC, GEC or SLC Calibrated Dataset represented by a STAC item GeoJSON2 including:
-
magnitude assets for each subswath and at each polarization and metadata (only for
SLCdataset), -
sigma nought (dB) single-band assets at each polarization (only for
GTCandGECdatasets), -
and overview assets (single-pol overviews and dual- or full-pol band composites).
All single band and overview assets are given at full resolution and in COG format.
Magnitude assets contained in a SAOCOM-1 SLC dataset cannot be visualized in the map and cannot be used as single band for drag and drop into processing services.
Sigma nought products are Float32 single-band assets in COG format, one for each polarization (e.g. s0_db_l_vv which refers to the common band name for sigma nought in dB from L-band SAR in VV polarization).
Visual products are given as 8-bit multi-band assets in COG format (e.g. overview-vv which refers to visual product at full resolution derived from sigma nought in dB from L-band SAR in VV polarization). A default overview product at low resolution is also derived for product preview when EULA is not signed by the user.
Note
In a SAOCOM-1 SLC dataset only a overview asset is given. It represents a full resolution visual product in grayscale derived from sigma nought in dB from L-band SAR in co-pol polarization (HH or VV).
-
CONAE, SAOCOM-1 mission page, available at: www.argentina.gob.ar ↩
-
ESA Science Toolbox Exploitation Platform, SNAP Toolbox available at https://step.esa.int. ↩↩
-
SNAPISTA, SNAP GPT Python wrapper documentation available at https://snap-contrib.github.io/snapista/. ↩