Concepts
The ESA Charter Mapper provides access to EO data coming from several missions and sensors and provided using different data formats and metadata.
These acquisitions have heterogeneous formats for the data files and associated metadata.
Note
The list of EO Missions supported by the ESA Charter Mapper can be found here.
To reduce this heterogeneity, the ESA Charter Mapper seeks to pre-process the acquisitions into a common format which, on the one hand, provides a ready-to-inspect and comparable dataset and, on the other, to have downstream processing services that support multi-sensor and multi-mission acquisitions without implementing complex blocks.
Below are described the main concepts that support this approach.
STAC as a common metadata model
EO data is handled under the ESA Charter Mapper Processing Chains using the SpatioTemporal Asset Catalog (STAC).
STAC consists of a standardized way to catalog and expose multi-source geospatial data.
The basic core of STAC1 is adopted and extended within the ESA Charter Mapper to manage the Charter collection of multi-source satellite imagery using multiple STAC “spatiotemporal” Assets.
Each STAC item (e.g. a single Sentinel-2 MSI L1C product for UTM zone 9 and grid square XK) includes multiple assets (e.g. multiple multispectral bands) and consists of a GeoJSON feature with metadata and thumbnail and can be organized under a STAC Catalog (e.g. multitemporal Sentinel-2 L1C MSI products for UTM zone 9 and grid square XK).
Each STAC Catalog can be then grouped under a STAC Collection (e.g. Sentinel-2 L1C) which can also further complement associated metadata information such as producer, processor, host, license, version, temporal extent, GSD, instrument, off-nadir angle, etc. More information can be found at STAC Common Metadata section of STAC Specification documentation2.
Common Band Names (CBN)
STAC assets of EO data are catalogued in the ESA Charter Mapper processing environment using Common Band Names (CBN). CBN classes refer to common band ranges derived from pre-defined frequency ranges of the Electromagnetic Spectrum made for several popular instruments. Each CBN class is defined by a Band Range in micrometers for optical and in centimeters for SAR data. The CBN classification of the frequency spectrum allows a one-to-one mapping of multi-mission and multi-sensor bands (Optical and SAR). CBN thus ease the handling multi-sensor source EO data.
Optical Common Band Names
To classify a generic band from an optical sensor with the CBN schema (e.g. Worldview-3 Yellow band from 0.584 to 0.632 μm), one way is to derive its centered wavelength in micrometers (0.608 μm) and identify the CBN class having the closest central wavelength (CBN class 05 and centered at 0.6 μm). However, while choosing a CBN class also the bandwidth needs to be considered. Common Band Names "nir" and "lwir" refer, in fact, to wider bands that cover most of the spectral range for NIR (0.75μm to 1.0μm) and TIR (10.5μm to 12.5μm) radiation. On the other hand, narrow bands for "nir" are "nir08" and "nir09", centered at 0.85μm and 0.95μm respectively. This is particularly useful for example to classify sensors having both a wide (e.g. Sentinel-2 MSI Band 8 at 833 nm) and a narrow (Sentinel-2 MSI Band 8a at 865 nm) band over the same portion of the EM spectrum. CBN "nir" will refer then to S2 MSI spectral Band 8 and "nir08" to the S2 MSI spectral band 8a.
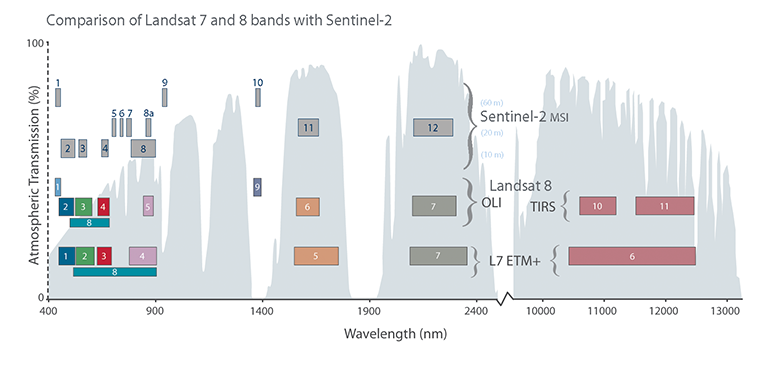
The same applies for "lwir" which is also discretized into two narrow bands "lwir11" and "lwir12", centered at 11μm and 12μm respectively. The CBN schema is not rigid and allows the definition of new classes in case the definition of an additional portion of the spectrum is required (e.g. to deal with future EO missions in the ESA Charter Mapper Optical Payload having different spectral resolution that cannot be fully classified with the current CBN schema).
A total of 29 CBNs (pan, coastal, blue, yellow, etc.) are identified for the ESA Charter Mapper (see Table 1). This table also includes a sample application of this CBN schema, made for Landsat-7 ETM+, Landsat-8 OLI/TIRS and Sentinel-2 MSI data.
| CBN code | Common Band Name (CBN) | Band Range (μm) | Landsat 7 ETM+ | Landsat 8 OLI / TIRS | Sentinel-2 MSI |
|---|---|---|---|---|---|
| CBN-01 | pan | 0.50 - 0.70 | 8 | 8 | |
| CBN-02 | coastal | 0.40 - 0.45 | 1 | 1 | |
| CBN-03 | blue | 0.45 - 0.50 | 1 | 2 | 2 |
| CBN-04 | green | 0.50 - 0.60 | 2 | 3 | 3 |
| CBN-05 | yellow | 0.58 - 0.62 | |||
| CBN-06 | red | 0.60 - 0.70 | 3 | 4 | 4 |
| CBN-07 | rededge | 0.70 - 0.79 | |||
| CBN-08 | rededge70 | 0.69 - 0.71 | 5 | ||
| CBN-09 | rededge74 | 0.73 - 0.75 | 6 | ||
| CBN-10 | rededge78 | 0.69 - 0.71 | 7 | ||
| CBN-11 | nir | 0.75 - 1.00 | 4 | 5 | 8 |
| CBN-12 | nir08 | 0.75 - 0.90 | 8a | ||
| CBN-13 | nir09 | 0.85 - 1.05 | 9 | ||
| CBN-14 | swir12 | 1.19 - 1.21 | |||
| CBN-15 | cirrus | 1.35 - 1.40 | 9 | 10 | |
| CBN-16 | swir16 | 1.55 - 1.75 | 5 | 6 | 11 |
| CBN-17 | swir155 | 1.45 - 1.65 | |||
| CBN-18 | swir165 | 1.65 - 1.75 | |||
| CBN-19 | swir173 | 1.72 - 1.74 | |||
| CBN-20 | swir22 | 2.10 - 2.30 | 7 | 7 | 12 |
| CBN-21 | swir215 | 2.13 - 2.17 | |||
| CBN-22 | swir220 | 2.18 - 2.22 | |||
| CBN-23 | swir225 | 2.23 - 2.27 | |||
| CBN-24 | swir23 | 2.28 - 2.32 | |||
| CBN-25 | mwir38 | 3.5 - 4.1 | |||
| CBN-26 | lwir | 10.5 - 12.5 | 6 | ||
| CBN-27 | lwir09 | 8.5 - 9.5 | |||
| CBN-28 | lwir11 | 10.5 - 11.5 | 10 | ||
| CBN-29 | lwir12 | 11.5 - 12.5 | 11 |
To better explain the advantages in managing multi-sensor EO optical data with CBN, an application of CBN schema, made for a selection of the ESA Charter Mapper optical payload is shown in Table 2. This enables a clear mapping of EO data across the EM spectrum with STAC assets.
| Satellite | Sensor | CBN-01 | CBN-02 | CBN-03 | CBN-04 | CBN-05 | CBN-06 | CBN-07 | CBN-08 | CBN-09 | CBN-10 | CBN-11 | CBN-12 | CBN-13 | CBN-14 | CBN-15 | CBN-16 | CBN-17 | CBN-18 | CBN-19 | CBN-20 | CBN-21 | CBN-22 | CBN-23 | CBN-24 | CBN-25 | CBN-26 | CBN-27 | CBN-28 | CBN-29 |
|---|---|---|---|---|---|---|---|---|---|---|---|---|---|---|---|---|---|---|---|---|---|---|---|---|---|---|---|---|---|---|
| ALSAT-1B | SLIM-6 | B | G | R | X | |||||||||||||||||||||||||
| Amazonia-1 | WFI | B | G | R | X | |||||||||||||||||||||||||
| CartoSat-2 | PAN | P | ||||||||||||||||||||||||||||
| CBERS-4 | PanMux, MUXCam, AWFI | P | B | G | R | X | ||||||||||||||||||||||||
| CBERS-4A | WPM, MUX, WFI | P | B | G | R | X | ||||||||||||||||||||||||
| Gaofen-1 | PMS | P | B | G | R | X | ||||||||||||||||||||||||
| Gaofen-1 | WFV | B | G | R | X | |||||||||||||||||||||||||
| Gaofen-2 | PMS | P | B | G | R | X | ||||||||||||||||||||||||
| Gaofen-4 | PMS, IRS | P | B | G | R | X | X | |||||||||||||||||||||||
| GeoEye-1 | EO imager | P | B | G | R | X | ||||||||||||||||||||||||
| Global | SpaceView24 | B | G | R | ||||||||||||||||||||||||||
| Kanopus-V | MSS/PSS | P | B | G | R | X | ||||||||||||||||||||||||
| Kanopus-V-IK | MSS/PSS | P | B | G | R | X | ||||||||||||||||||||||||
| Kanopus-V-IK | MSU-IK-SRM | X | ||||||||||||||||||||||||||||
| KOMPSAT-2 | MSC | P | B | G | R | X | ||||||||||||||||||||||||
| KOMPSAT-3 | AEISS | P | B | G | R | X | ||||||||||||||||||||||||
| KOMPSAT-3A | AEISS-A | P | B | G | R | X | ||||||||||||||||||||||||
| Landsat-8 | OLI/TIRS | P | C | B | G | R | X | X | X | X | X | X | ||||||||||||||||||
| Landsat-9 | OLI/TIRS | P | C | B | G | R | X | X | X | X | X | X | ||||||||||||||||||
| NewSat | MS | B | G | R | ||||||||||||||||||||||||||
| PlanetScope | PS2, PS2.SD | B | G | R | X | |||||||||||||||||||||||||
| PlanetScope | PSB.SD | C | B | G | Y | R | X | X | ||||||||||||||||||||||
| Pléiades | PHR1A/B | P | B | G | R | X | ||||||||||||||||||||||||
| Pléiades-NEO | PNEO | P | C | B | G | R | X | X | ||||||||||||||||||||||
| ResourceSat-2 / 2A | LISS-III | G | R | X | X | |||||||||||||||||||||||||
| ResourceSat-2 / 2A | LISS-IV | G | R | X | ||||||||||||||||||||||||||
| Sentinel-2 | MSI | C | B | G | R | X | X | X | X | X | X | X | X | X | ||||||||||||||||
| SPOT-6 | SPOT-6 | P | B | G | R | |||||||||||||||||||||||||
| SPOT-7 | SPOT-7 | P | B | G | R | |||||||||||||||||||||||||
| UK-DMC-2 | SLIM-6 | G | R | |||||||||||||||||||||||||||
| Vision-1 | VHRI-100 | P | B | G | R | |||||||||||||||||||||||||
| VRSS-1 | PMC | P | B | G | R | |||||||||||||||||||||||||
| VRSS-1 | WMC | B | G | R | ||||||||||||||||||||||||||
| VRSS-2 | HRC | P | B | G | R | |||||||||||||||||||||||||
| WorldView-1 | WV60 | P | ||||||||||||||||||||||||||||
| WorldView-2 | WV110 | P | C* | B | G | Y* | R | X* | X | X* | ||||||||||||||||||||
| WorldView-3 | WV110 | P | C | B | G | Y | R | X | X | X | X* | X* | X* | X* | X* | X* | X* | X* |
SAR Common Band Names
A similar schema is applied for SAR missions. CBN classes for SAR refer to a combination of frequency band and polarization derived from multiple band numbers of several popular SAR instruments for disaster mapping. The CBN classification of microwave radiation enables a one-to-one mapping of multi-mission and multi-sensor SAR products. Table 3 shows a sample application of CBN for radar backscatter which is used in the ESA Charter Mapper SAR missions.
| Common Name | Wavelength (cm) | ICEYE | Kompsat-5 | TerraSAR-X TanDEM-X | GF-3 | Radarsat 2 | RCM 1/2/3 | Sentinel-1 A/B | ALOS-2 | SAOCOM-1 A/B |
|---|---|---|---|---|---|---|---|---|---|---|
| s0_db_x_hh | 2.5 - 4 | X | X | |||||||
| s0_db_x_hv | 2.5 - 4 | X | X | |||||||
| s0_db_x_vh | 2.5 - 4 | X | X | |||||||
| s0_db_x_vv | 2.5 - 4 | X | X | X | ||||||
| s0_db_c_hh | 4 - 8 | X | X | X | X | |||||
| s0_db_c_hv | 4 - 8 | X | X | X | X | |||||
| s0_db_c_hv | 4 - 8 | X | X | X | X | |||||
| s0_db_c_vv | 4 - 8 | X | X | X | X | |||||
| s0_db_l_hh | 15 - 30 | X | X | |||||||
| s0_db_l_hv | 15 - 30 | X | X | |||||||
| s0_db_l_vh | 15 - 30 | X | X | |||||||
| s0_db_l_vv | 15 - 30 | X | X |
CBNs for SAR are meant to classify Sigma Nought in decibel from the multi-mission SAR Payload using this code s0_db_r_pp>, where “s0_db” means Sigma Nought in dB, “r” is the SAR-band (X, C or L), and “pp” is the polarization (HH, HV, VH or VV). This schema enables the mapping of the SAR products provided as quad- (HH+HV+VH+VV), dual- (VV+VH or HH+HV), or single-polarization (HH or VV). Cross-pol assets are generally provided within dual- or quad-pol products. The ICEYE mission is represented by only the CBN s0_db_x_vv because the GRD products are given only in VV polarization.
Warning
SAR CBN shall be all in lower case letters. Thus, a Calibrated ICEYE Sigma Nought in VV polarization shall have the CBN s0_db_x_vv for its Sigma Nought single-band assets.
Single band and visual products from EO data
The logic of the ESA Charter Mapper is to use EO data products, grouped in a collection called Acquisitions and provide a collection called Datasets where these are available in a form that is ready for analysis and processing.
Acquisitions is a collection of features representing EO data products associated with one activation (incl. some imported by the PM on-demand beyond the EO data collection channelled through COS-2).
Datasets is a collection of features representing post-processed (e.g. calibrated) versions of source EO data products. Datasets are composed of multiple Assets. For example, a Calibrated Dataset includes N single-band Assets representing reflectance or backscatter values of N bands extracted from the source EO data.
Assets are intra-product components within an EO data product. An Asset can be a single band product contained in a calibrated dataset (e.g. the red single band asset which represents reflectance for CBN=red). An Asset can also be a composed three-band product (e.g. an RGB composite) made from reflectance or backscatter values of separate bands extracted from a calibrated dataset.
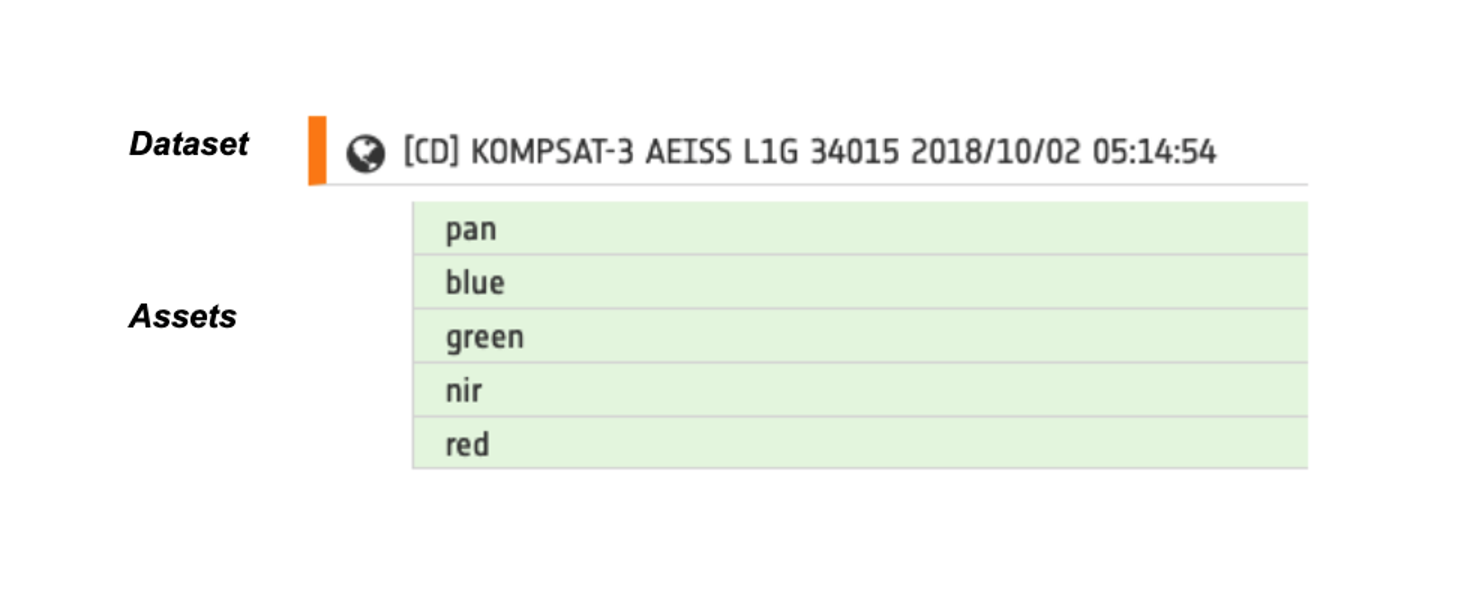
Therefore, when the user handles the components of a Calibrated Dataset he handles Assets. This is in line with the pre-defined asset role types defined in the STAC standards. Typically the elements provided in Datasets comprise of:
-
Single band assets that are the result of pre-processing (in particular calibration) applied to the original EO data product. Single band Assets under a Dataset are the basis for EO Processing Services to generate Value Adding products.
-
Overview assets that are full-res browse images derived from the EO data product by encoding the digital values on 8 bit for visualization. Overview assets are visual products and thus are not meant to be used for processing. Overviews may be single-band images (grey levels) or Red, Green, Blue (RGB) composite using the most common bands used to display the EO data product. The term “overview” for visual products is adopted in the ESA Charter Mapper to be compliant with the pre-defined asset role types defined in the STAC standards1.
Note
The ESA Charter Mapper can visualize Single band assets similarly to Overview ones and can handle the depth of the signal values thanks to the visualization functions such as the Layer Styling tool that provides histograms.
The ESA Charter Mapper is providing both Overviews and Single band assets for all the supported EO missions of the International Charter.
Visual products from optical EO data
In the case of Optical missions, different types of overviews products are offered to the user to support the rapid visualization of EO data.
Pre-defined RGB band composites
Multiple pre-defined RGB band composites are available in the ESA Charter Mapper for optical EO data. All the possible RGB composite options are listed in Table 4 which also includes examples of the ones derivable from Landsat-7, Landsat-8 and Sentinel-2 missions with the associated CBN combination.
| Code | Composite | RGB (CBN) | Landsat-7 ETM+ | Landsat-8 OLI | Sentinel-2 MSI |
|---|---|---|---|---|---|
| TRC | True Color | red, green, blue | 3 2 1 | 4 3 2 | 4 3 2 |
| CIV | Color Infrared (vegetation) | nir, red, green | 4 3 2 | 5 4 3 | 8 4 3 |
| LAW | Land/Water | nir, swir16, red | 4 5 3 | 5 6 4 | 8A 11 4 |
| VEA | Vegetation Analysis | swir16, nir, red | 5 4 3 | 6 5 4 | 11 8A 4 |
| SIR | Shortwave Infrared | swir22, nir, red | 7 4 3 | 7 5 4 | 12 8A 4 |
| FCU | False Color Urban | swir22, swir16, red | 7 5 3 | 7 6 4 | 12 11 4 |
| ATP | Atmospheric Penetration | swir22, swir16, nir | 7 5 4 | 7 6 5 | 12 11 8A |
| WAD | Water Depth | green, blue, coastal | - | 3 2 1 | 3 2 1 |
Color operations in the ESA Charter Mapper
In the ESA Charter Mapper a universal color formula is employed in the creation of all overviews of optical payload:
Gamma RGB 1.5 Sigmoidal RGB 10 0.3 Saturation 1
This formula is tailored for a general usage in the Processing Environment and employs different values than the rio-color3 default ones. In the ESA Charter Mapper the structure of a color formula is described in this section about the TiTiler5 tool of the ESA Charter Mapper Geobrowser.
The ESA Charter Mapper universal color formula can be used also to reproduce intra-sensor RGB on the fly in the TiTiler widget in the ESA Charter Mapper Layer Details tab under Layer Styling > Combine Assets > Color Formula.
The application of the universal color formula in the ESA Charter Mapper has shown a fairly good performance in the visualization of multiple RGB composites for most of the missions of the Optical payload. However the assumption of using a single color formula for multiple different sensors has an intrinsic limitation, as encountered in some missions (e.g. Kompsat-3A AEISS-A and ResourceSat-2/2A LISS-III). Thus, the ESA Charter Mapper uses a slightly modified version of the universal color formula when necessary. Refined color formulas are included in Table 5.
| Mission | Sensor | Modified color formula | Valid for RGB |
|---|---|---|---|
| Kompsat-3A | AEISS-A | Gamma RGB 1.5 Saturation 1.1 Sigmoidal RGB 15 0.33 | TRC, CIV |
| Gaofen-2 | AEISS | Gamma RGB 1 Saturation 1 Sigmoidal RGB 3 0.5 | TRC, CIV |
| VRSS-2 | PMC | Gamma RGB 1.5 Saturation 1 Sigmoidal RGB 10 0.25 | TRC, CIV |
| ALSAT-1B | SLIM6 | Gamma RGB 1.5 Saturation 1 Sigmoidal RGB 10 0.2 | CIV |
| ResourceSat-2A | LISS-III | Gamma RGB 1.5 Saturation 2 Sigmoidal RG 5 0.3 Sigmnoidal B 10 0.3 | CIV |
| ResourceSat-2A | LISS-III | Gamma RGB 1.5 Saturation 1 Sigmoidal RG 5 0.5 Sigmoidal B 10 0.4 | VEA |
An example of a VEA RGB band composite obtained by using the modified color formula with the ResourceSata-2A LISS-III data is shown in Figure 3.
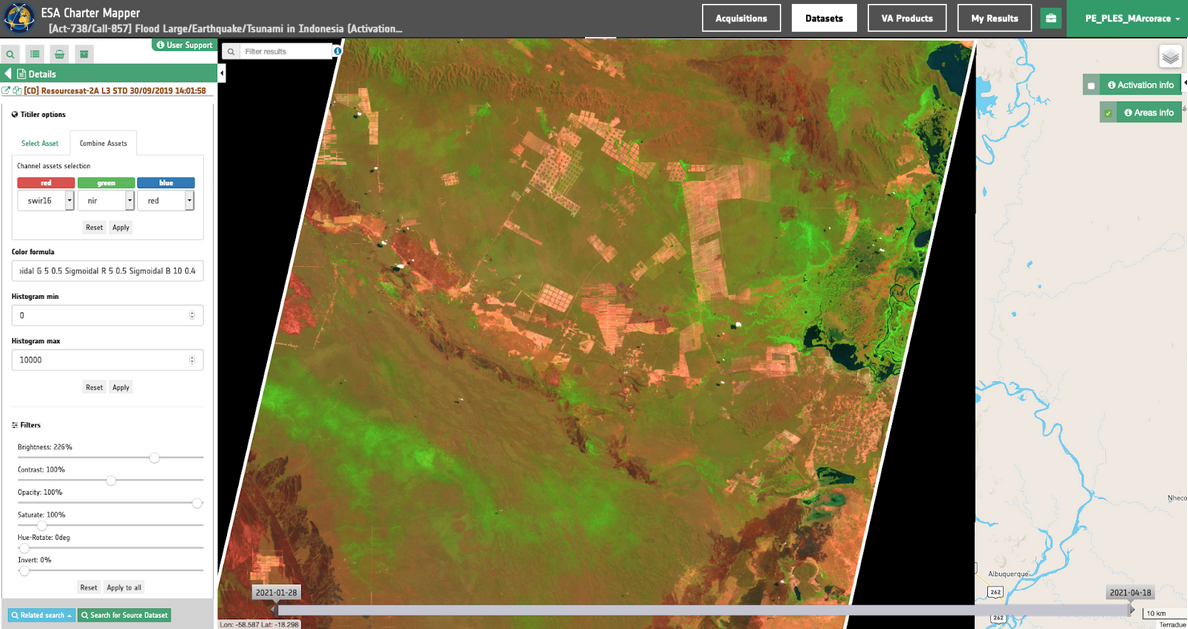
Tailored RGB composites can be also made under Combine Assets using the Horizontal cumulative count cut 2-98% or by manually setting min/max for each RGB channel.
Visual products from SAR EO data
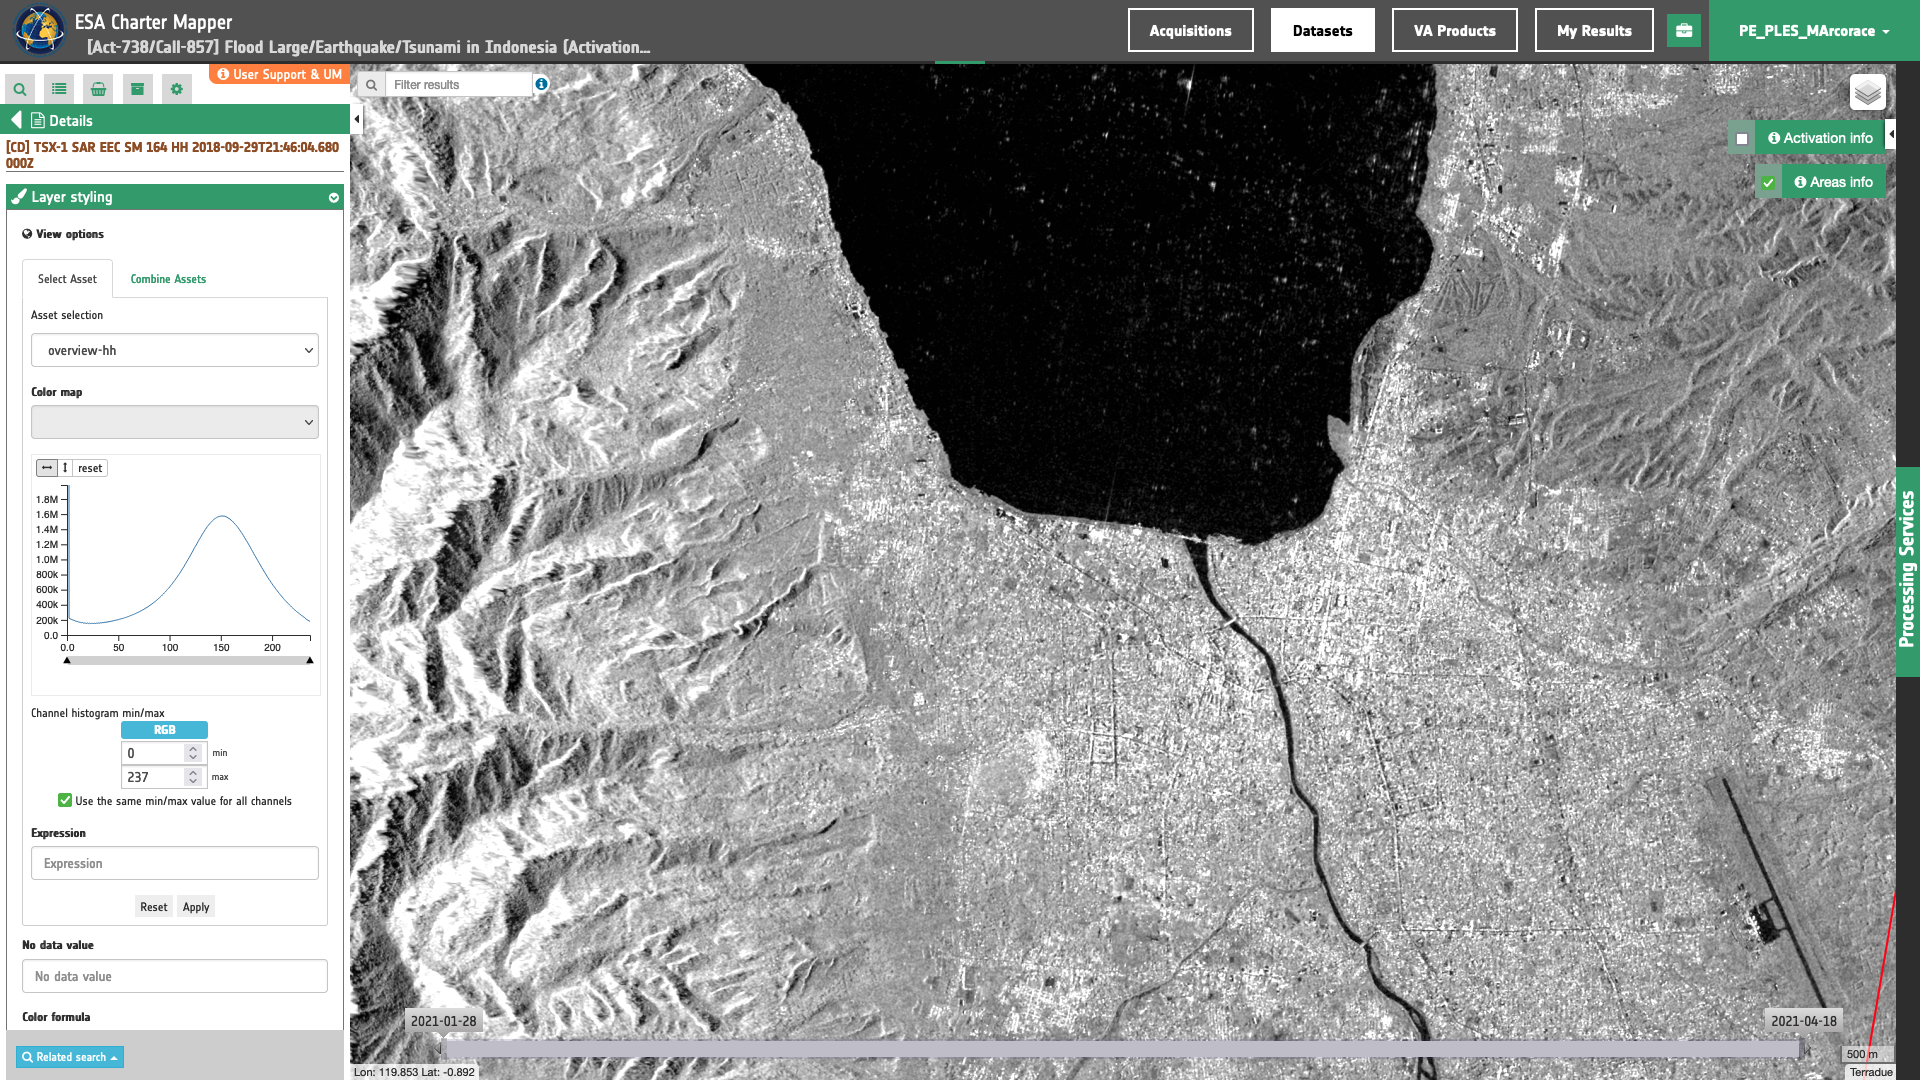
The ESA Charter Mapper also produces Overviews for the radar sensors. For single-pol SAR data, such as the case of ICEYE products, the ESA Charter Mapper generates only a gray-scale overview product at full resolution in VV polarization. Instead, for dual- and ful- pol SAR data, the platform generates multiple grayscale overviews for each single polarization plus an RGB band composite from a combination of them.
Grayscale overviews are generated for each of the polarizations available in the source SAR data (see Figure 4).
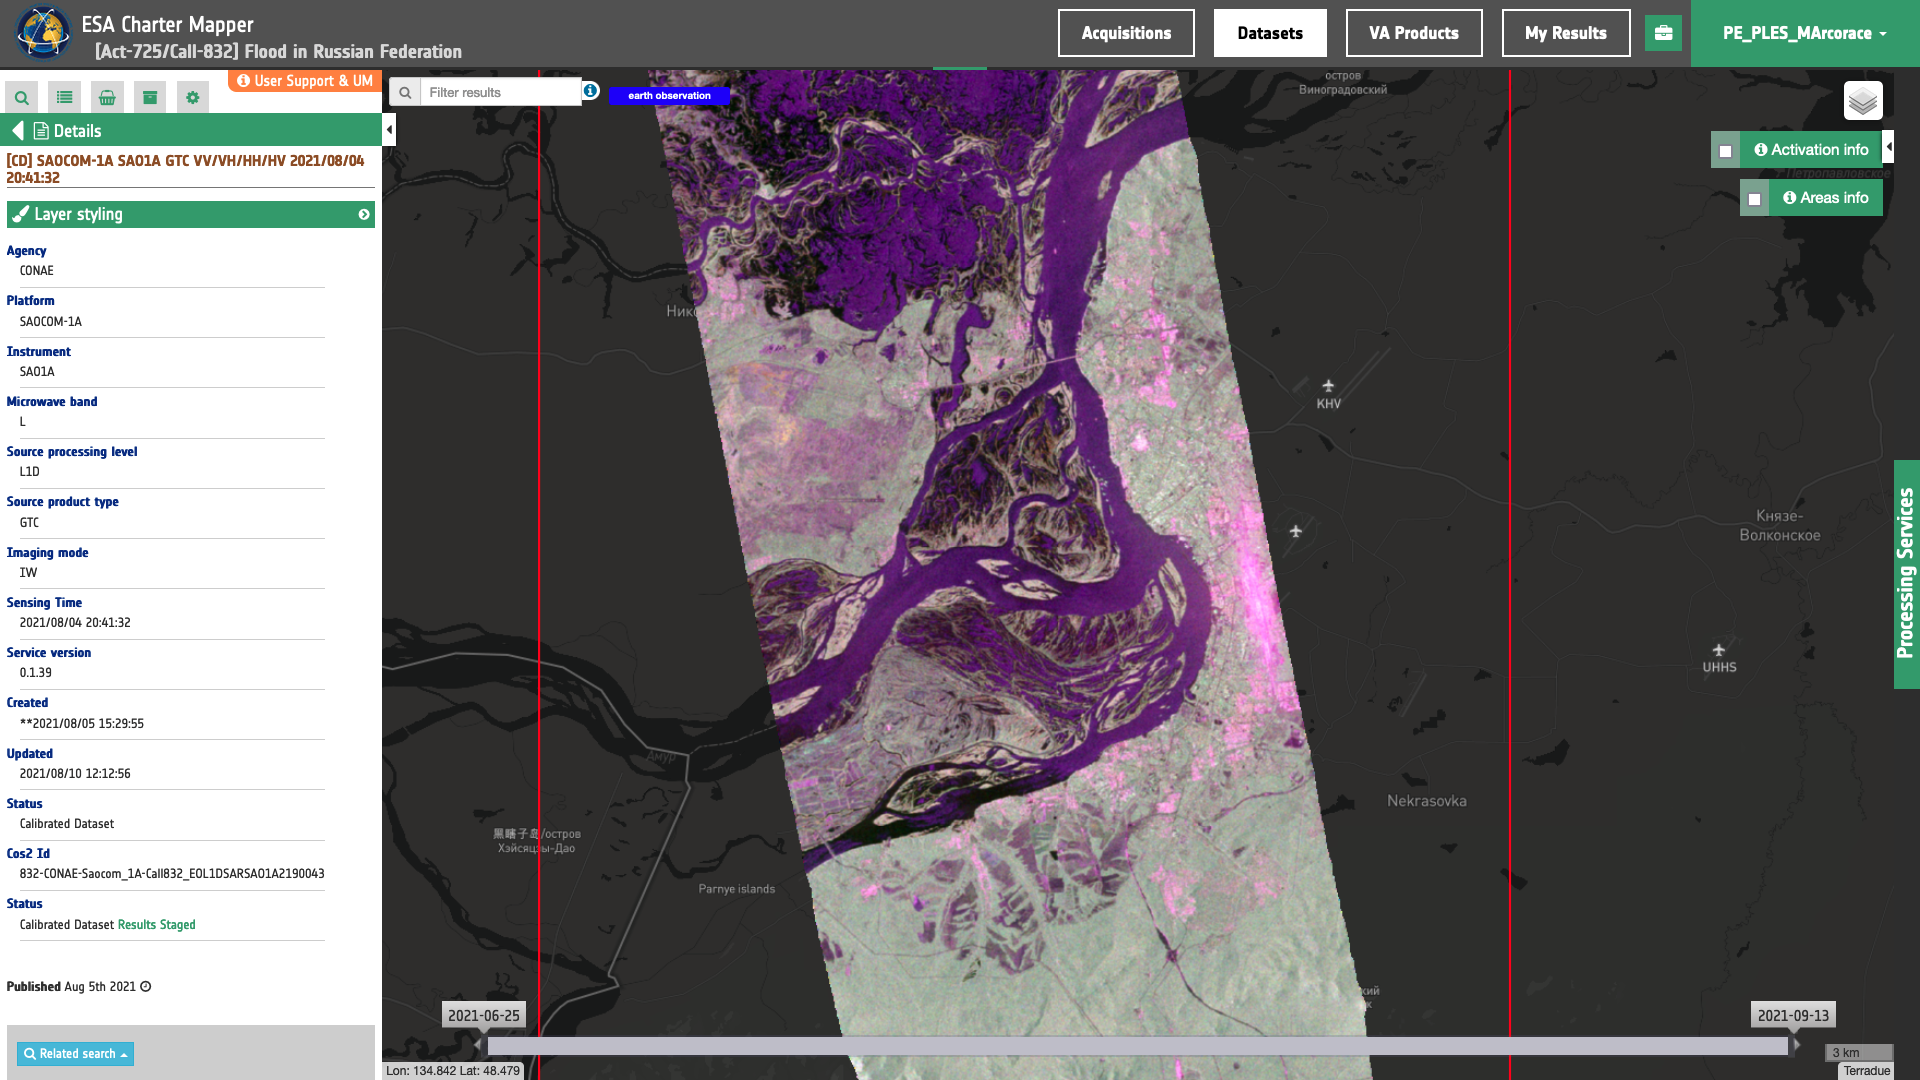
In the case of dual-pol data, VV&VH or HH&HV, the overview-dual RGB is created with R=co-pol, G=cross-pol, and B=co-pol/cross-pol. This first representation highlights mainly urban areas, the different orientation of buildings, and vegetation.
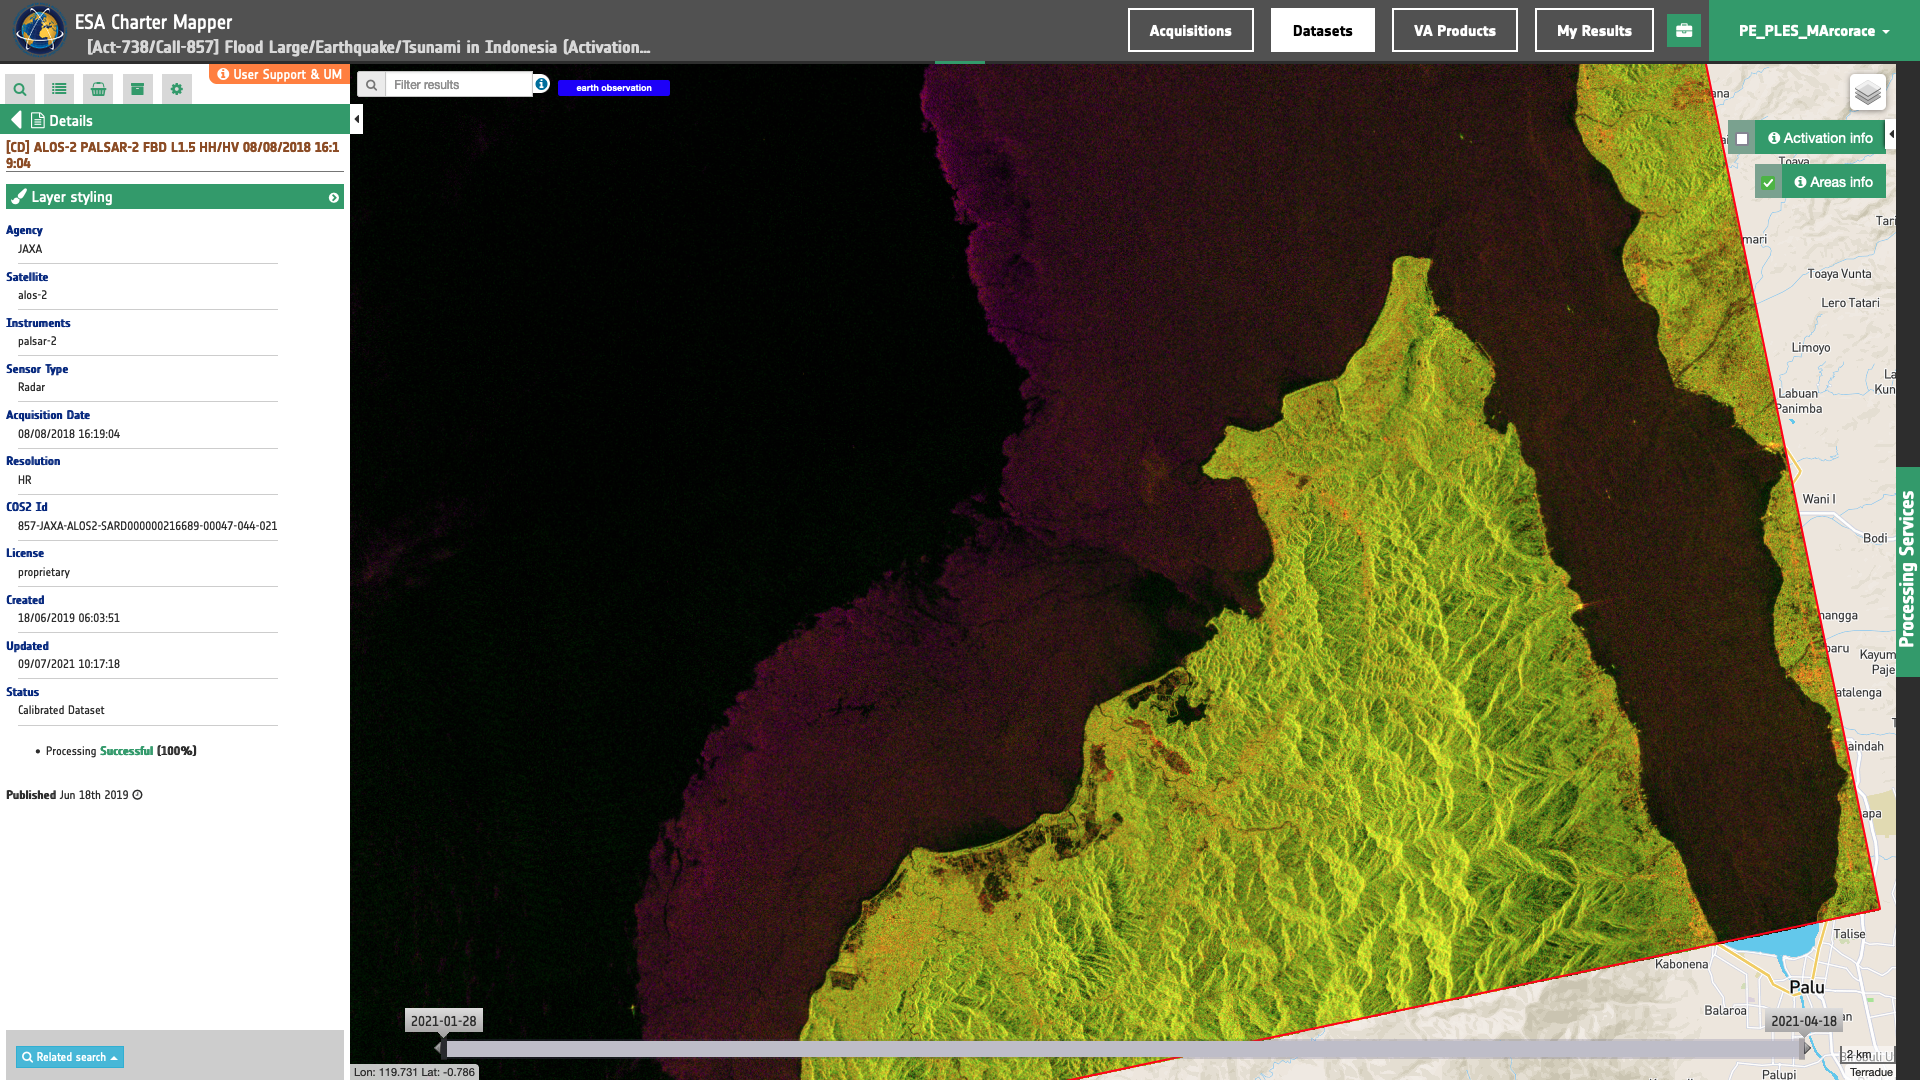
Instead, in the case of full-poll data the overview-full RGB band composite is derived as follows: R=HH, G=HV, B=VV. This second representation improves the dual-pol representation, highlighting better volumetric scattering, bare soils and urban areas.
Settings of the signal dynamic range for different SAR polarization and bands
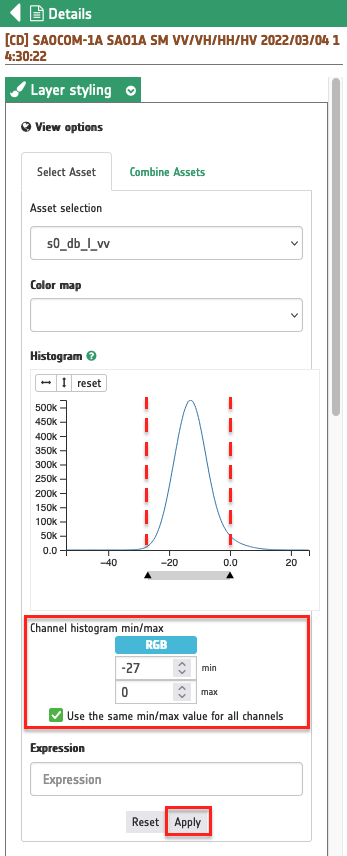
In all SAR products derived from the systematic SAR calibration (either the geophysical asset or the overview one at 8 bit) an image stretching is applied to consider only Sigma Nought within pre-defined minimum and maximum values. This helps optimize visualization on the screen of the assets. The minimum and maximum values expressed in dB included in Table 6 are specific to mission, SAR band (or frequency) and polarization.
| Mission | SAR-band | Co-pol (VV/HH) [min,max] in dB | Cross-pol (VH/HV) [min,max] in dB |
|---|---|---|---|
| ICEYE | X | [-22,2] | [-27,-3] |
| KOMPSAT-5 | X | [-22,2] | [-27,-3] |
| TerraSAR-X / TanDEM-X | X | [-22,2] | [-27,-3] |
| Gaofen-3 | C | [-20,0] | [-26,-5] |
| RCM | C | [-20,0] | [-26,-5] |
| Sentinel-1 | C | [-20,0] | [-26,-5] |
| ALOS-2 | L | [-27,0] | [-35,-5] |
| SAOCOM-1 | L | [-27,0] | [-35,-5] |
Note
For single-band assets included into SAR Calibrated Datasets the image stretching is applied only in the geobrowser for visualization purposes of the asset. This image stretching is just a pre-configured option in TiTiler to simplify the visualization of the Sigma Nought in the map (e.g. Min=-27dB and Max=0dB pre-defined for a s0_db_l_vv asset from a SAOCOM-1 SAR Calibrated Dataset). The processor preserves the full signal dynamic range in the output single band product derived from the systematic Radar Product Calibration service (e.g. when downloading the single band product s0_db_l_vv.tif the image stretching is not applied). To customize the contrast enhancement of backscatter, the user can employ a different image stretching by specifying (under Details / Layer Styling / View Options / Channel histogram min/max) different values in dB to the ones listed in Table 6.
Low resolution overview product
To deal with the restrictions imposed by the licensing policy of some Agencies for the access to full resolution data, access to the full resolution overview products is restricted and a reduced resolution version is provided in the first instance. For each acquired product received from COS-2 notification, the ESA Charter Mapper generates a single overview product at a reduced resolution using a pre-defined RGB band combination and/or grayscale downsampled image. The default reduced resolution overview for each mission of the ESA Charter Mapper payload is described in the below Table 7.
The default low resolution overview for each mission of the ESA Charter Mapper payload is described in the below Table 7.
| Mission | Sensor | Type | Default low resolution overview product |
|---|---|---|---|
| ALOS-2 | PALSAR-2 | SAR | overview-vv-low-res (or overview-hh-low-res) |
| ALSAT-1B | SLIM-6 | Optical | overview-civ-low-res |
| Amazonia-1 | WFI | Optical | overview-trc-low-res |
| CartoSat-2 | PAN | Optical | overview-pan-low-res |
| CBERS-4 | PAN/MUX | Optical | overview-trc-low-res |
| CBERS-4 | WFI | Optical | overview-trc-low-res |
| CBERS-4A | WPM | Optical | overview-trc-low-res |
| CBERS-4A | PAN/MUX | Optical | overview-trc-low-res |
| CBERS-4A | WFI | Optical | overview-trc-low-res |
| DEIMOS-1 | SLIM-6 | Optical | overview-civ-low-res |
| DubaiSat-2 | HiRAIS | Optical | overview-trc-low-res |
| Gaofen-1 | PMS | Optical | overview-trc-low-res |
| Gaofen-1 | WFV | Optical | overview-trc-low-res |
| Gaofen-2 | PMS | Optical | overview-trc-low-res |
| Gaofen-3 | SAR-C | SAR | overview-vv-low-res (or overview-hh-low-res) |
| Gaofen-4 | PMS, IRS | Optical | overview-trc-low-res |
| GeoEye-1 | EO imager | Optical | overview-trc-low-res |
| Kanopus-V 1/2/3 | MSS/PSS | Optical | overview-trc-low-res |
| Kanopus-V-IK | MSS/PSS | Optical | overview-trc-low-res |
| Kanopus-V-IK | MSU-IK-SRM | Optical | overview-mwir38-low-res (or overview-lwir9-low-res) |
| KhalifaSat | KHCS | Optical | overview-trc-low-res |
| KOMPSAT-2 | MSC | Optical | overview-trc-low-res |
| KOMPSAT-3 | AEISS | Optical | overview-trc-low-res |
| KOMPSAT-3A | AEISS-A | Optical | overview-trc-low-res |
| KOMPSAT-5 | COSI | SAR | overview-vv-low-res (or overview-hh-low-res) |
| ICEYE | SAR-X | SAR | overview-vv-low-res |
| Landsat-7 | ETM | Optical | overview-trc-low-res |
| Landsat-8 | OLI | Optical | overview-trc-low-res |
| MeteorM | KMSS MSU | Optical | overview-civ-low-res |
| PlanetScope | PlanetScope | Optical | overview-trc-low-res |
| Pleiades | PHR1A/B | Optical | overview-trc-low-res |
| RADARSAT-2 | SAR-C | SAR | overview-vv-low-res (or overview-hh-low-res) |
| RCM | SAR-C | SAR | overview-vv-low-res (or overview-hh-low-res) |
| ResourceSat-2 / 2A | LISS-III | Optical | overview-civ-low-res |
| ResourceSat-2 / 2A | LISS-IV | Optical | overview-civ-low-res |
| Resurs-P | GEOTON-L1 | Optical | overview-trc-low-res |
| Resurs-P | ShMSA-VR | Optical | overview-trc-low-res |
| SAOCOM-1A | SAR-L | SAR | overview-vv-low-res (or overview-hh-low-res) |
| Sentinel-1 | SAR-C | SAR | overview-vv-low-res (or overview-hh-low-res) |
| Sentinel-2 | MSI | Optical | overview-trc-low-res |
| SPOT-6 | SPOT-6 | Optical | overview-trc-low-res |
| SPOT-7 | SPOT-7 | Optical | overview-trc-low-res |
| TerraSAR-X, TanDEM-X | SAR-X | SAR | overview-vv-low-res (or overview-hh-low-res) |
| UK-DMC-2 | SLIM-6 | Optical | overview-civ-low-res |
| Vision-1 | VHRI-100 | Optical | overview-trc-low-res |
| VRSS-1 | PMC | Optical | overview-trc-low-res |
| VRSS-1 | WMC | Optical | overview-trc-low-res |
| VRSS-2 | HRC | Optical | overview-trc-low-res |
| World-view1 | WV60 | Optical | overview-pan-low-res |
| World-view2 | WV110 | Optical | overview-trc-low-res |
| World-view3 | WV110 | Optical | overview-trc-low-res |
A common format for output raster products
All the output raster products derived from the ESA Charter Mapper Processing Service, which are summarized in here, are given in the Cloud Optimized GeoTIFF (COG)4 format.
COG is an extension of the GeoTIFF format dedicated for data hosting on HTTP file servers. One of the main advantages in using COG format in cloud processing environments is that the single GeoTIFF file can be accessed by multiple clients with no need to copy or cache the desired product.
Furthermore, it allows the client to easily retrieve via HTTP GET range requests just a desired portion of the data required for more efficient workflows on the cloud. As an example, in the ESA Charter Mapper the pre-processed datasets are stored in COG format to reduce data transfer during the thematic processing. The COG format is already employed under multiple initiatives such as: OpenAerialMap, INPE, MAXAR/DigitalGlobe, Planet, NASA and Copernicus’s Mundi DIAS.
STAC and COG have been recently adopted by USGS for the provision of Landsat-7 and Landsat-8 products, as described in the USGS Data Format Control Book6 which describes the format of the data to be used in Collection 2 processing.
-
SpatioTemporal Asset Catalog Core Specification, The core components of STAC, https://stacspec.org/core.html. ↩↩
-
Radiant Earth Foundation, STAC specification, GitHub Readme. ↩
-
Rio-color rasterio plugin, GitHub repository. ↩
-
Cloud Optimized GeoTIFF, An imagery format for cloud-native geospatial processing, [https://www.cogeo.org]](https://www.cogeo.org/){:target="_blank"}. ↩
-
Landsat Cloud Optimized GeoTIFF Data Format Control Book, The core components of STAC, available at. ↩