PAN-Sharp tutorial
![]()
This service performs Pan Sharpening of optical multispectral images. It takes as input a calibrated dataset containing multispectral assets and a calibrated dataset containing a panchromatic asset to generate a pansharpened image by combining the panchromatic and multispectral data.
 PAN-Sharp service description and specifications are available in this section.
Select the processing service
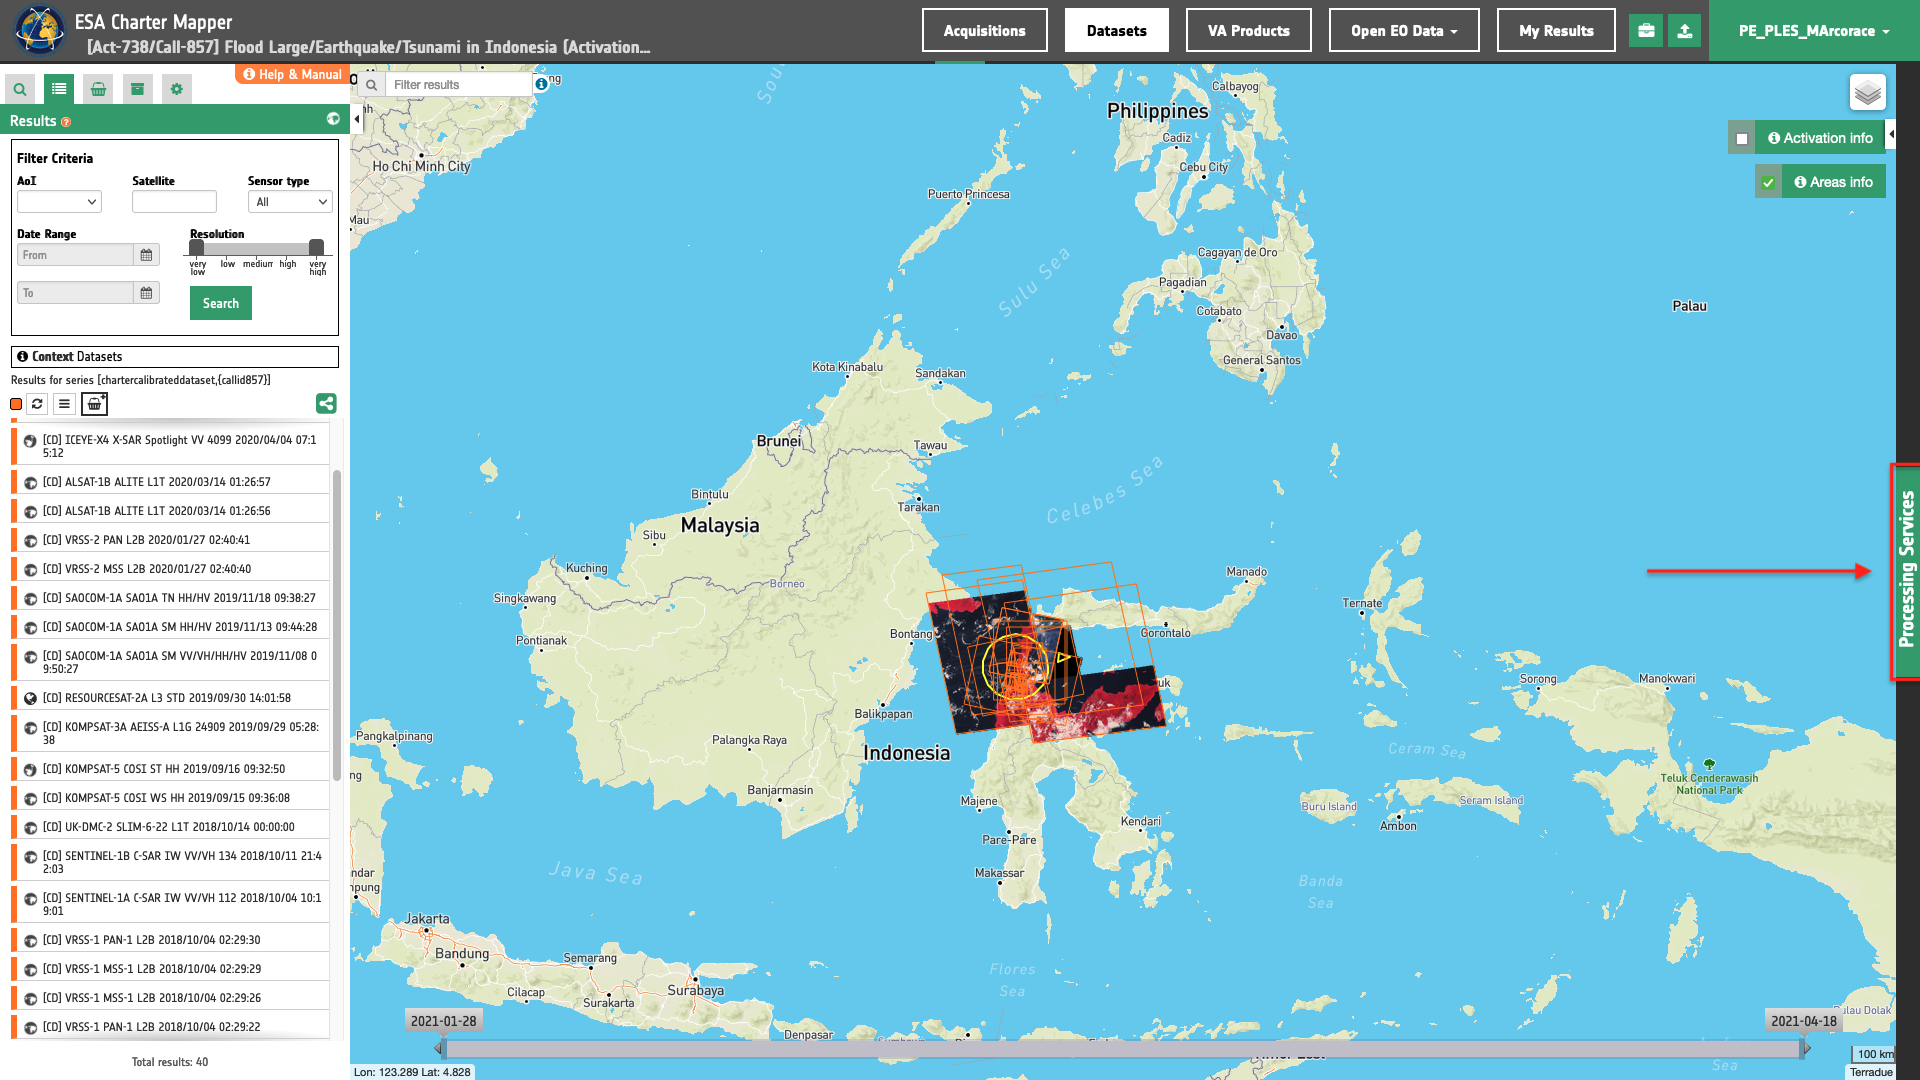
After the opening of the activation workspace, in the right panel of the interface, open the Processing Services tab.
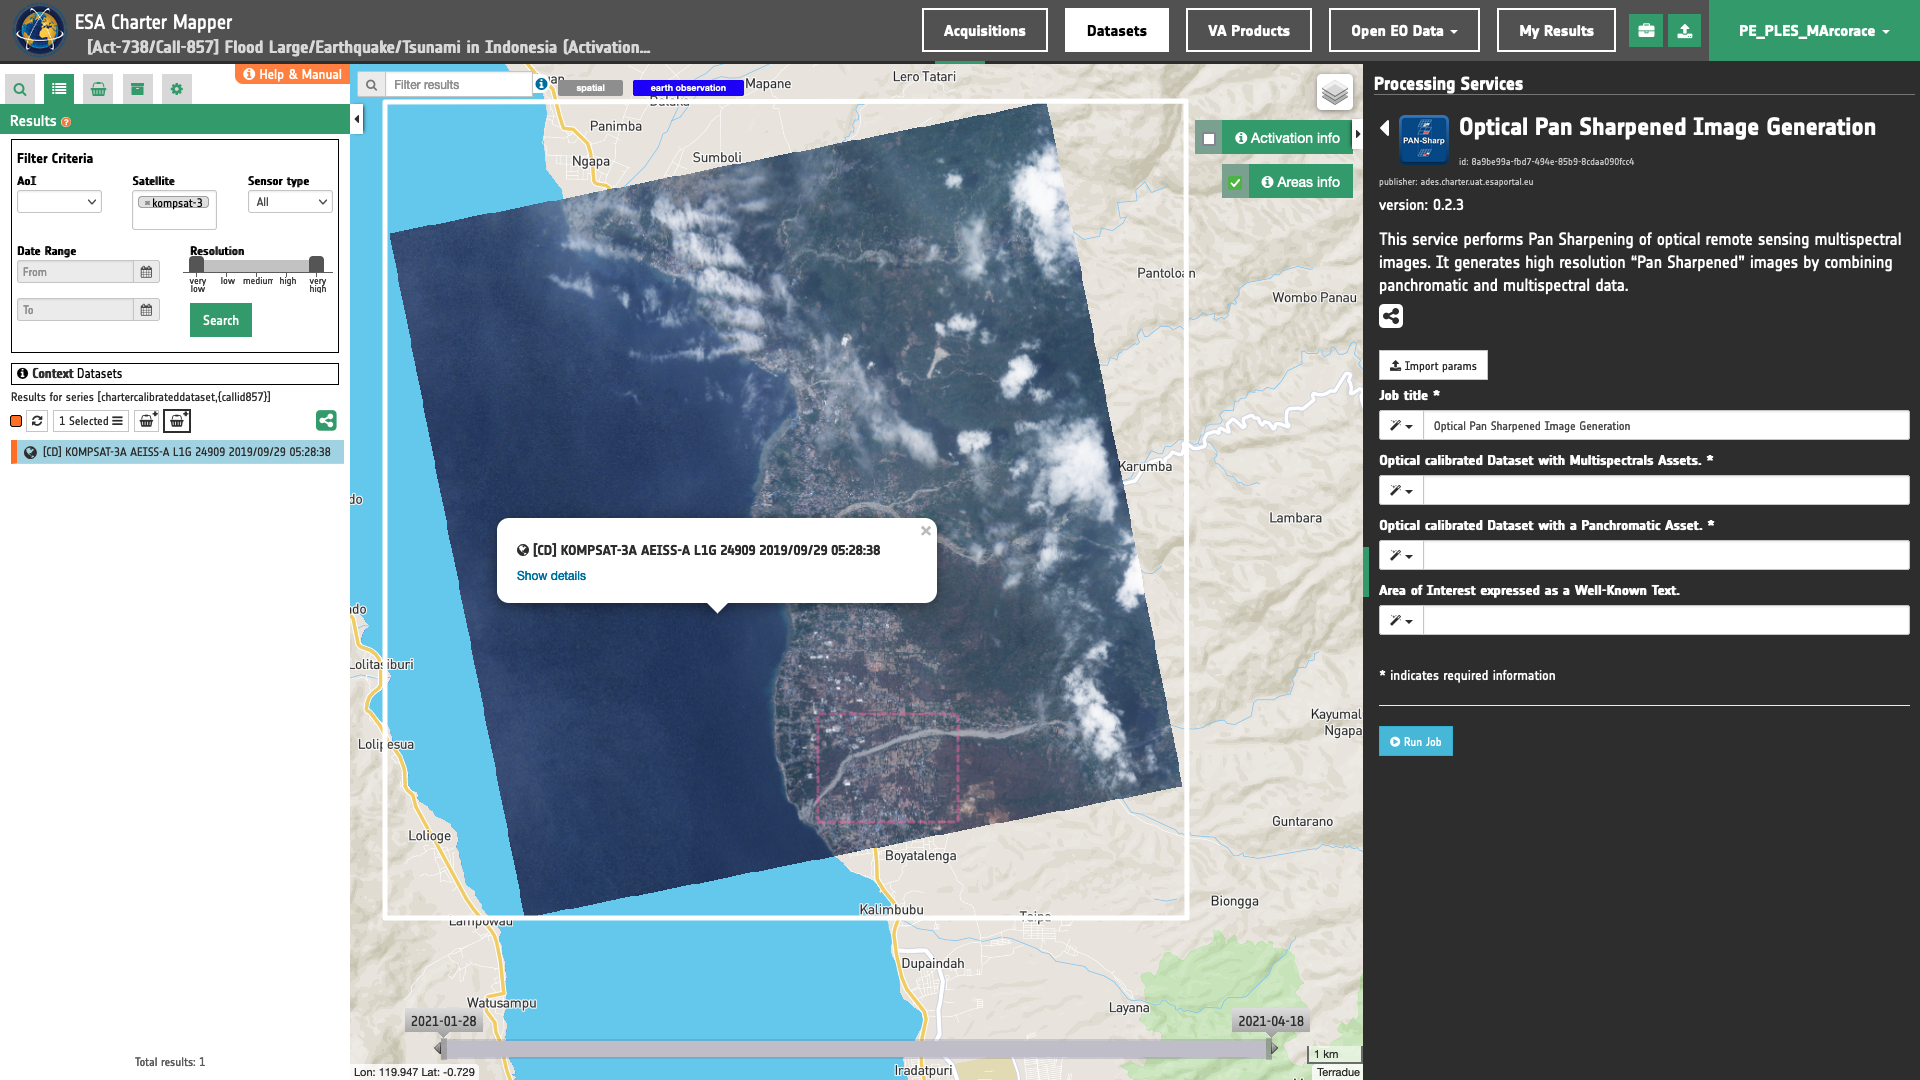
Select the processing service Optical Pan Sharpened Image Generation.
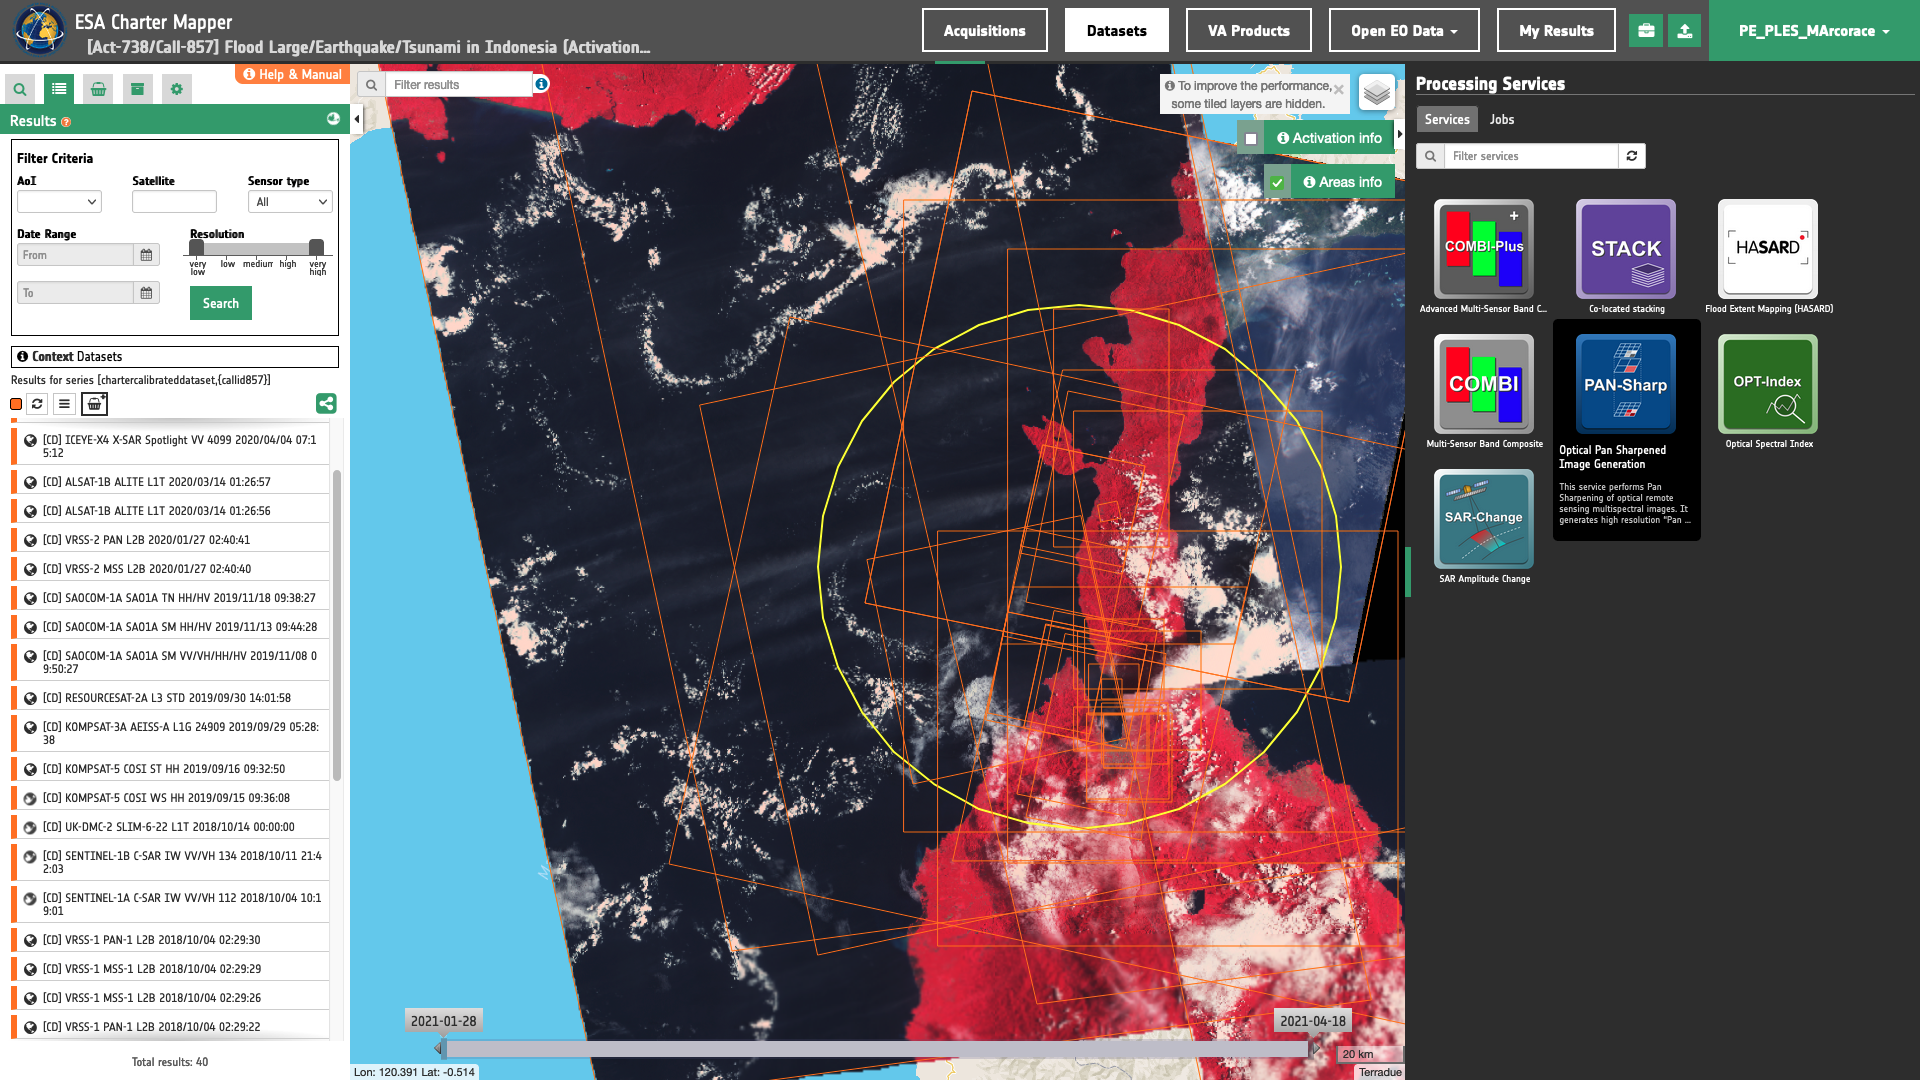
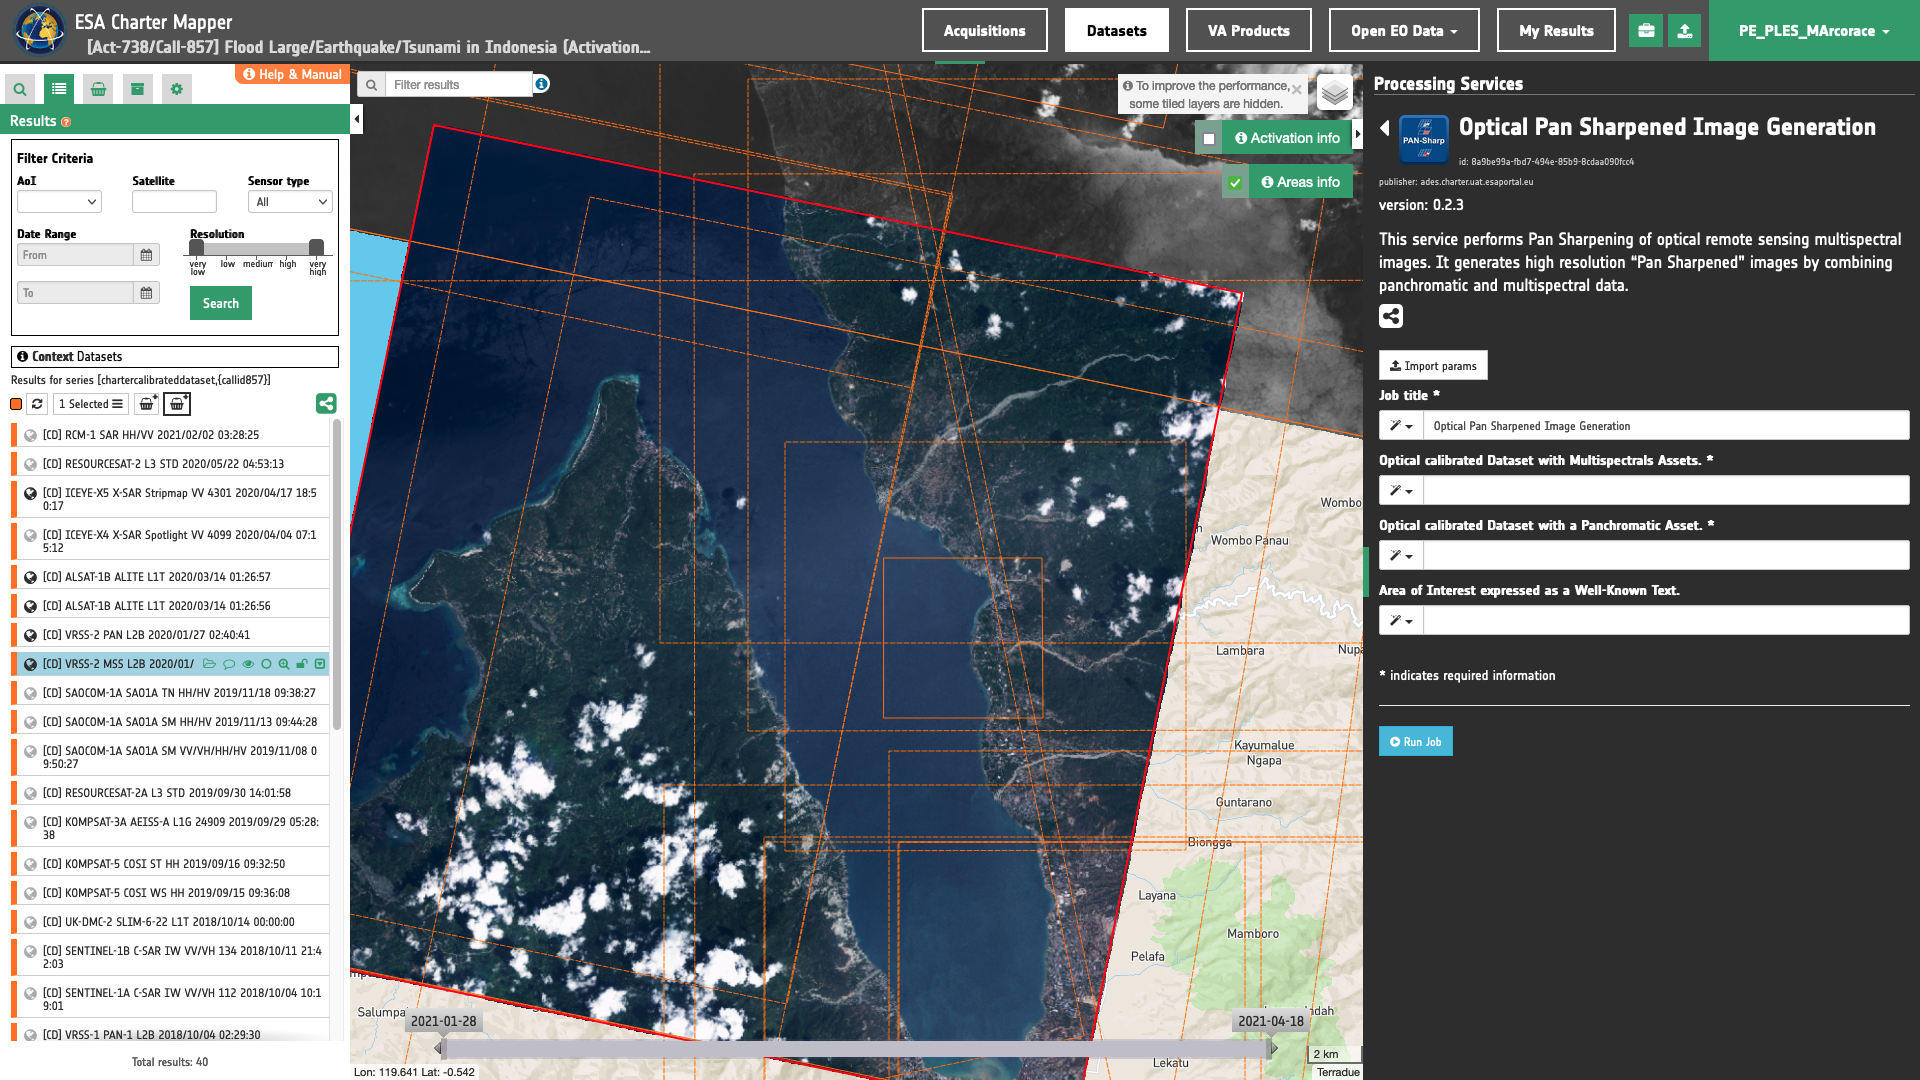
The "Optical Pan Sharpened Image Generation (PAN-Sharp)" panel is displayed with parameters values to be filled-in.
Find the data using multiple filter criterias
-
Select the area for which you want to do an analysis, in North Palu, in Central Sulawesi, Indonesia.
-
From the Navigation and Search toolbar (located in the upper left side of the map), click on Spatial Filter and draw a square AOI over the terrritory around Taipa, in North Palu, Central Sulawesi. This spatial filter allows you to select only the EO data acquired over this area.
-
From the top of the left panel, use Filter Criterias to search for “Optical” and "Kompsat-3A" data collections from the list.
Warning
Input optical EO data must have both pan and multi-spectral assets.
- After the query the list will be updates as the one shown in the next image.
Fill the paramters
After the definition of spatial and time filters, you can employ PAN-Sharp, by using for example a Calibrated Dataset from Kompsat-3A AIESS-A data.
To do so you can fill the parameters as described in the following sections.
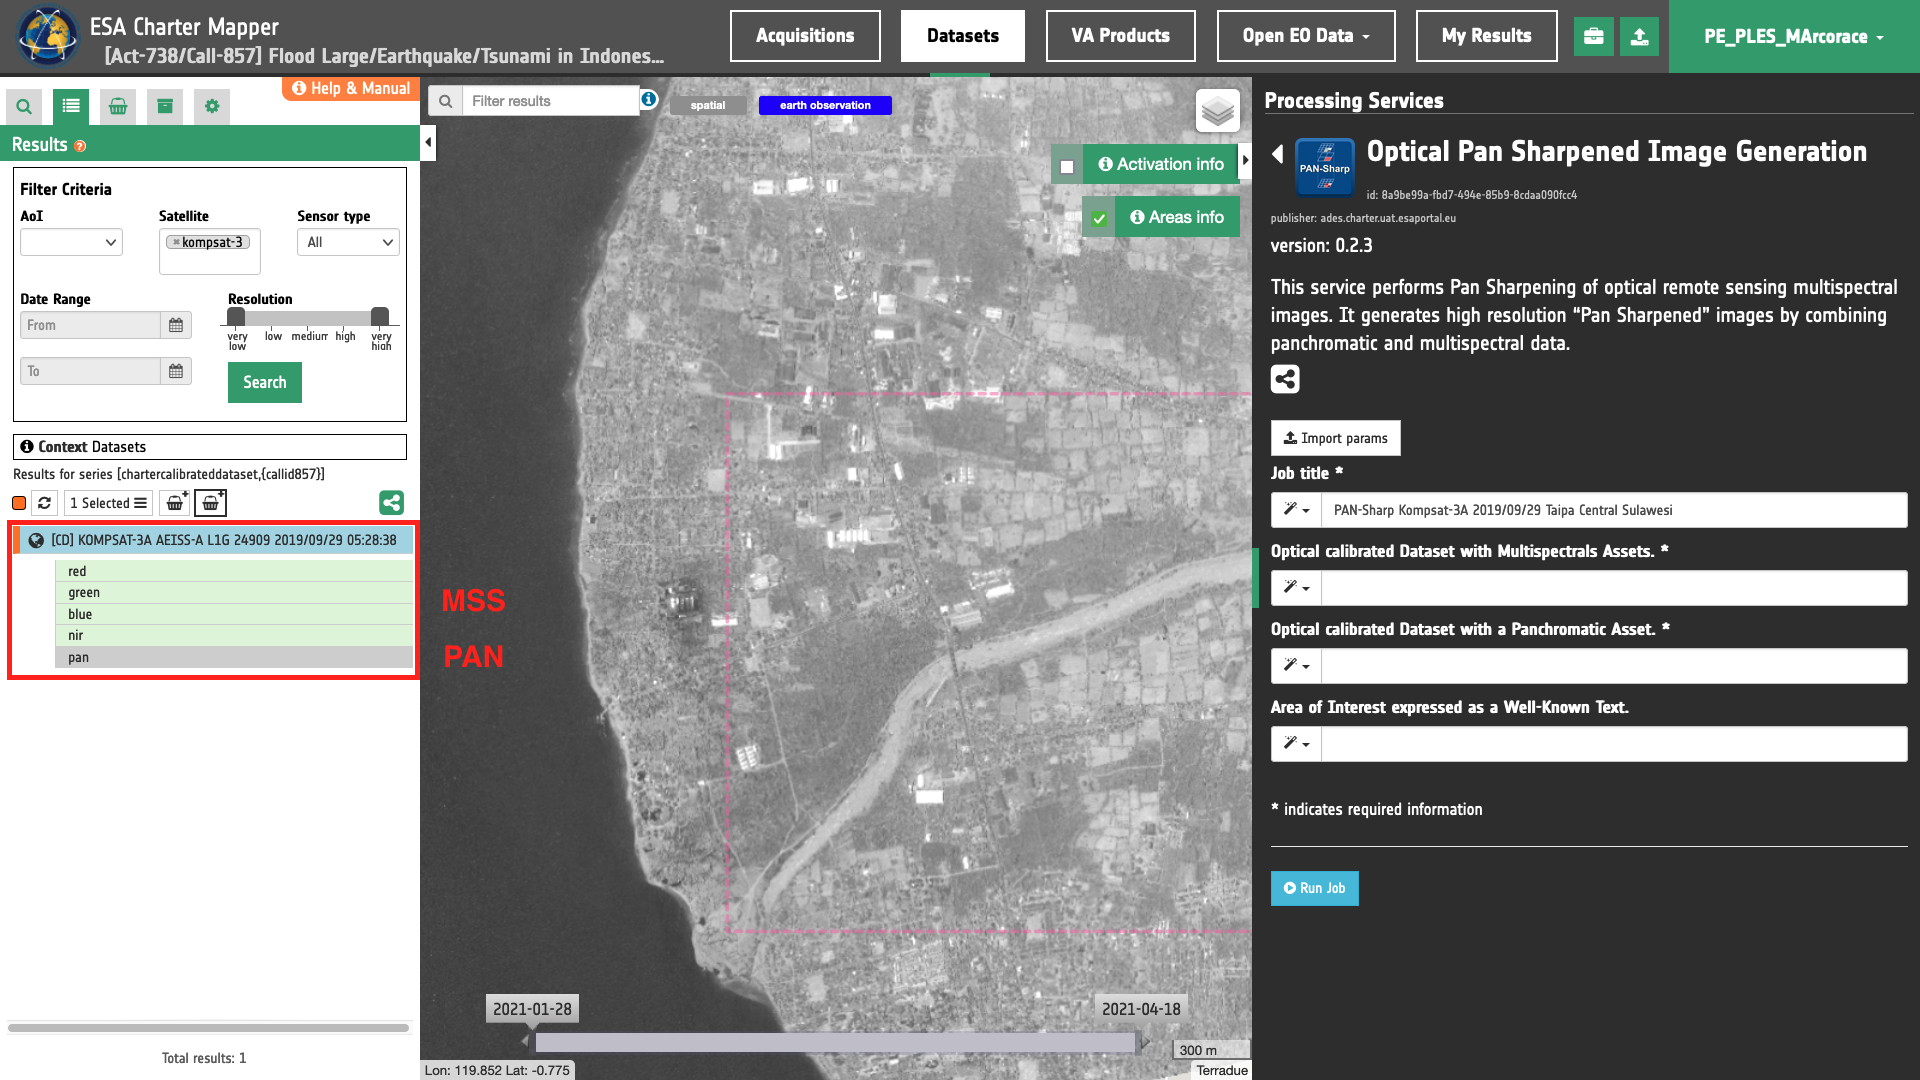
Job name
- Insert as job name:
PAN-Sharp Kompsat-3A 2019/09/29 Taipa Central Sulawesi
Reference inputs for multi panchromatic and multispectral assets
The first parameter represents the reference to the input optical Calibrated Dataset (CD) that is used to gather multispectral assets (e.g. blue, green, red, nir).
The second parameter represents the reference to the input optical (CD) that is used to gather the panchromatic asset pan.
Warning
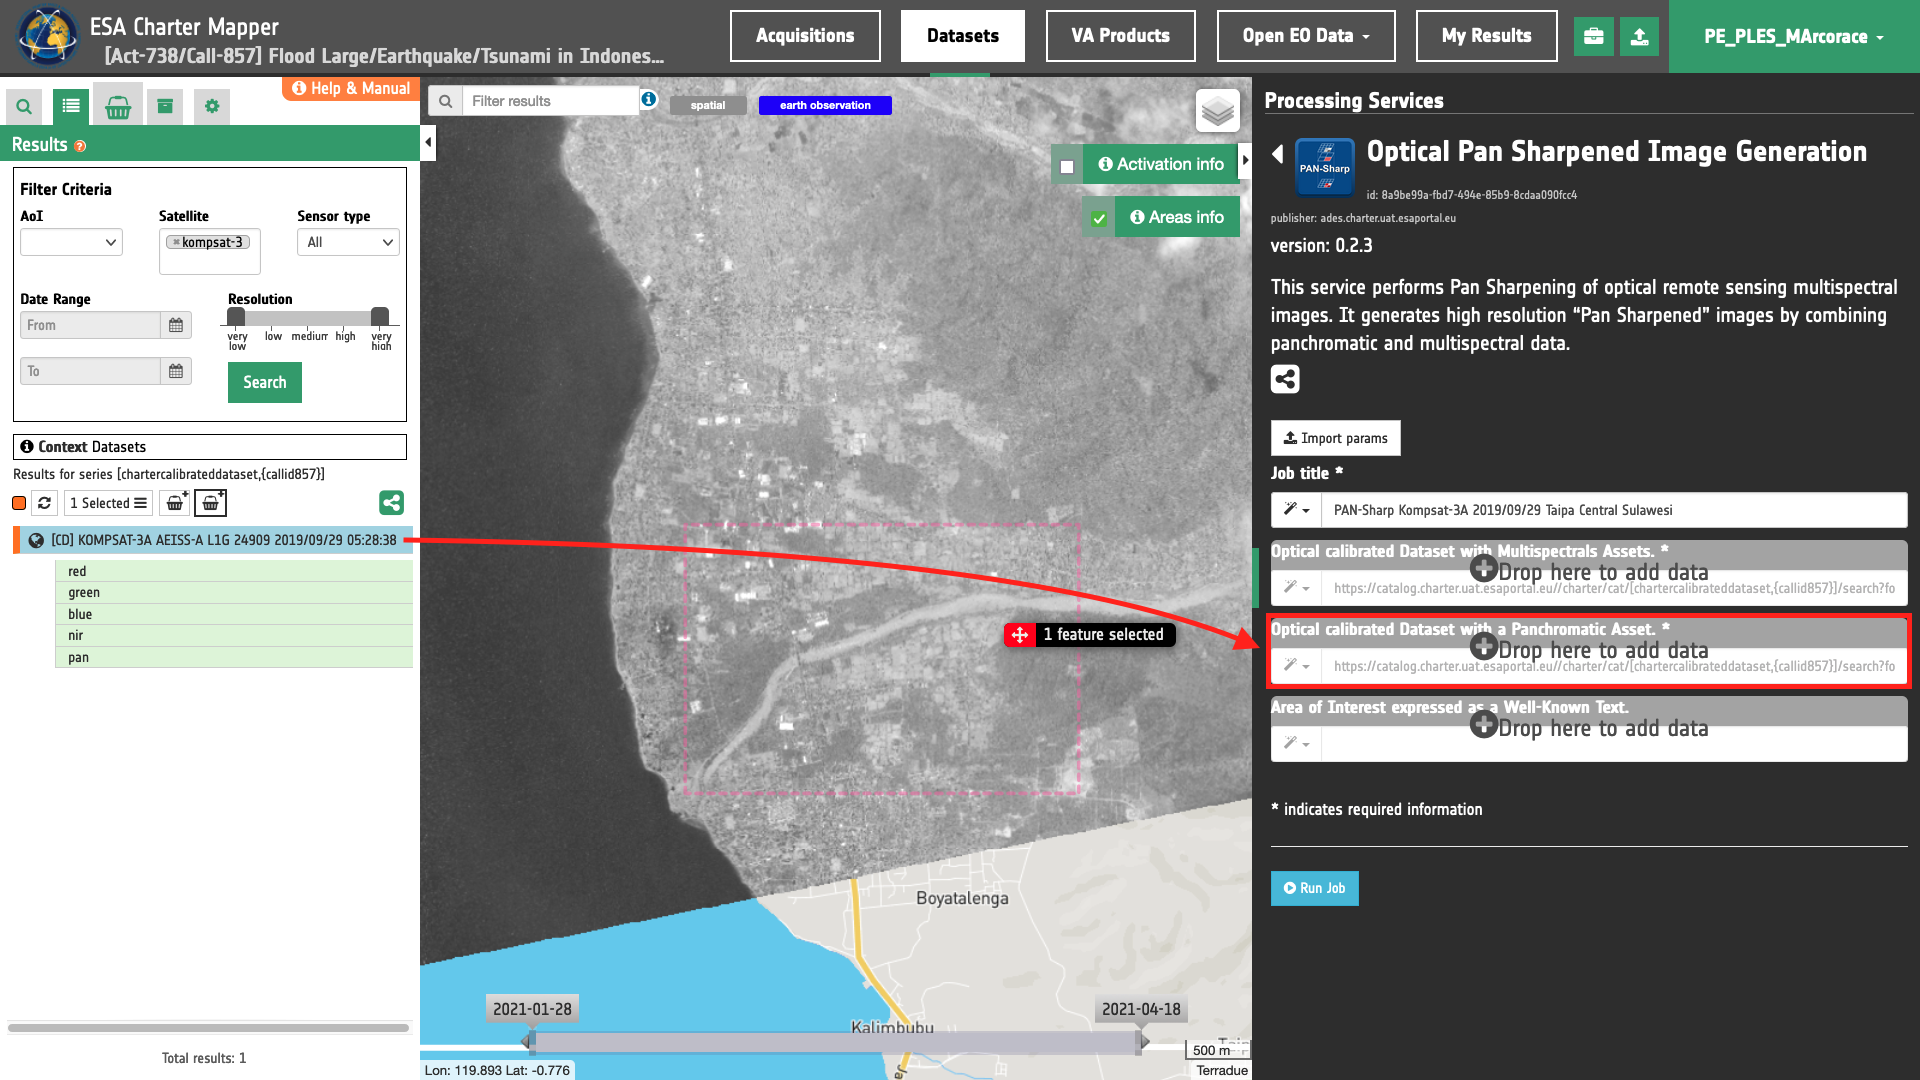
The firts two parameters are mandatory. Therefore, an Optical Calibrated Dataset having only pan asset cannot be used as input for PAN-Sharp.
Since the CD for Kompsat-3A includes both PAN and XS, drag and Drop the selected CD item in the Input-reference-multi-spectral and Input-reference-pan fields.
Warning
Drag and drop the Dataset (e.g. "[CD] KOMPSAT-3A AEISS-A L1G 24909 2019/09/29 05:28:38") and not the single-band asset (e.g. "pan") into the Input-reference-pan field. Same for multispectral assets.
Note
In case panchromatic and multispectral assets are not included in the same Optical Calibrated Dataset (e.g.VRSS-2 L2B PAN and MSS) Input-reference-multi-spectral and Input-reference-pan parameters values shall point to Multispectral and PAN [CD] references respectively.
Area of interest
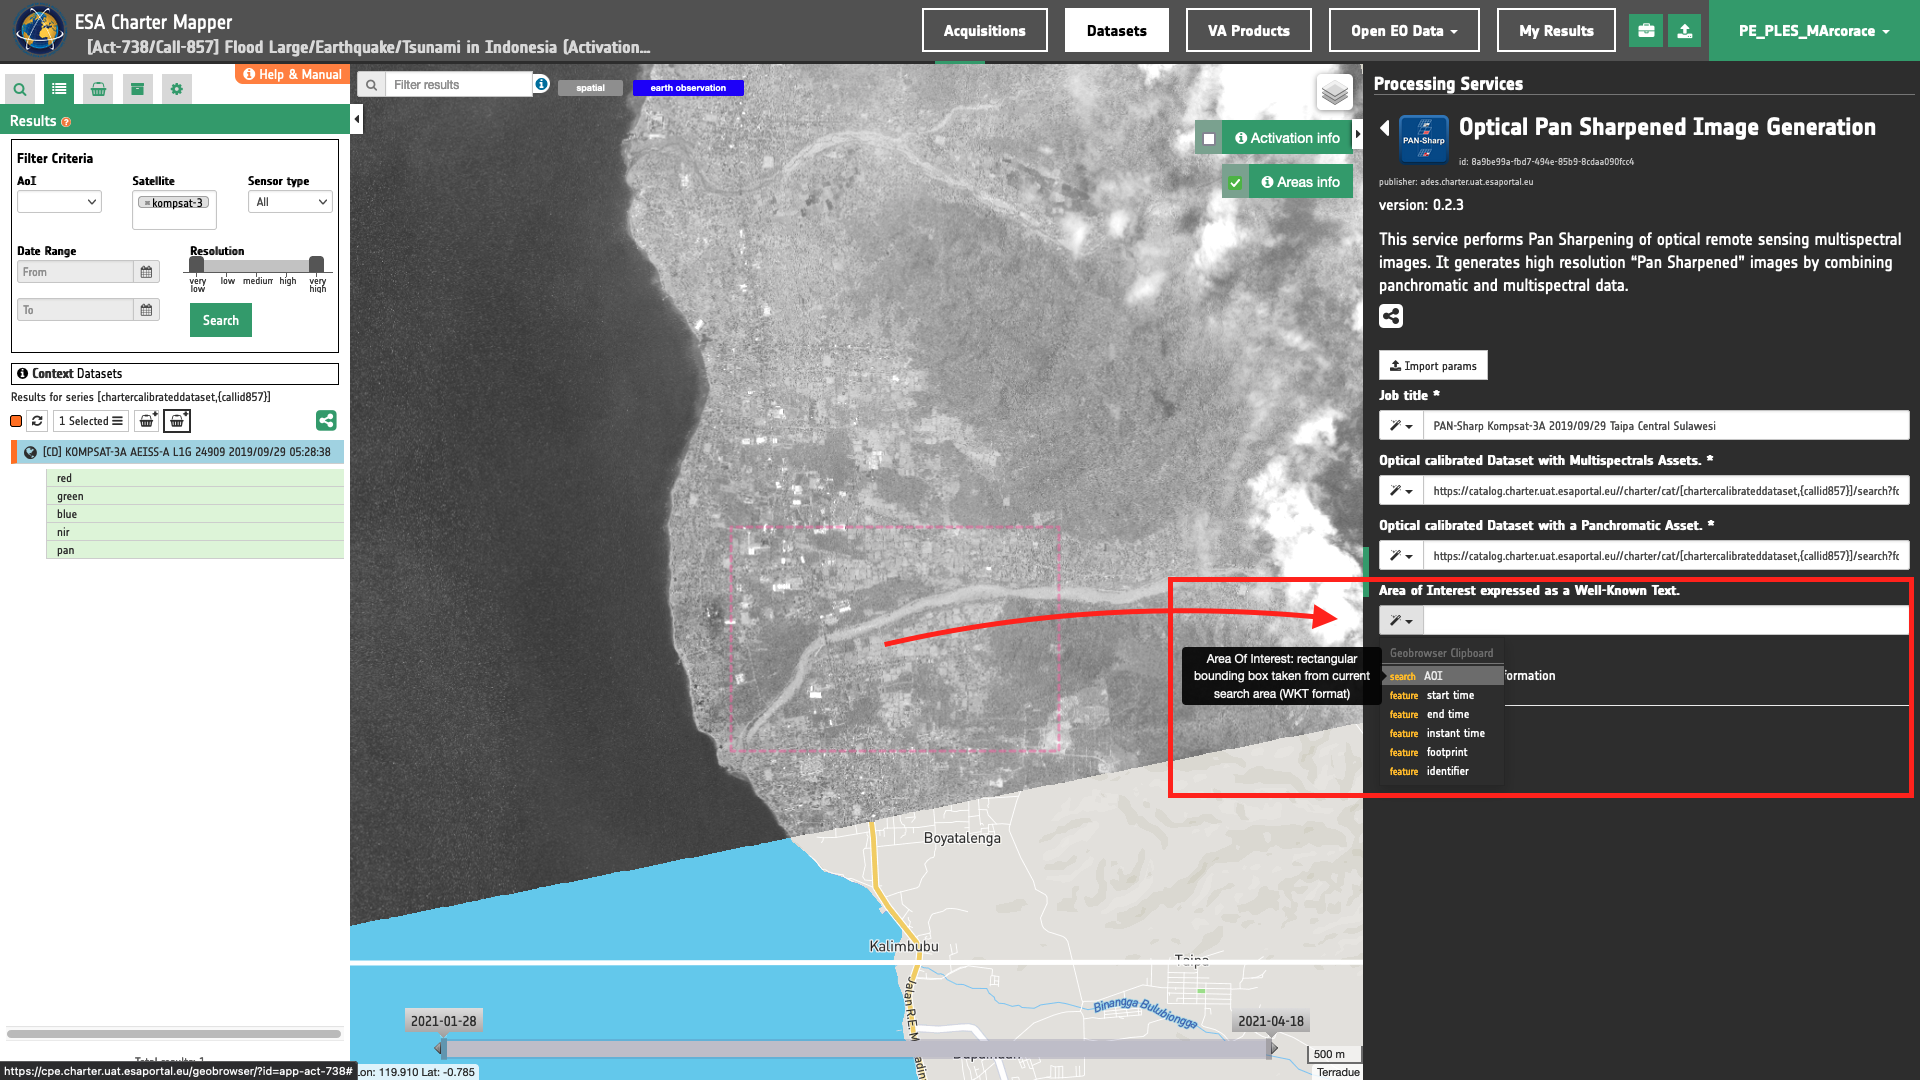
The “Area of interest as Well Known Text” can be defined by using the drawn polygon defined with the area filter.
Tip
To automatically define the WKT values click on the Magic tool wizard button in the left side of the "Area of interest expressed as Well-known text" box and select the option AOI from the list. The platform will automatically fill the parameter value with the rectangular bounding box taken from current search area in WKT format.
Note
This parameter is optional.
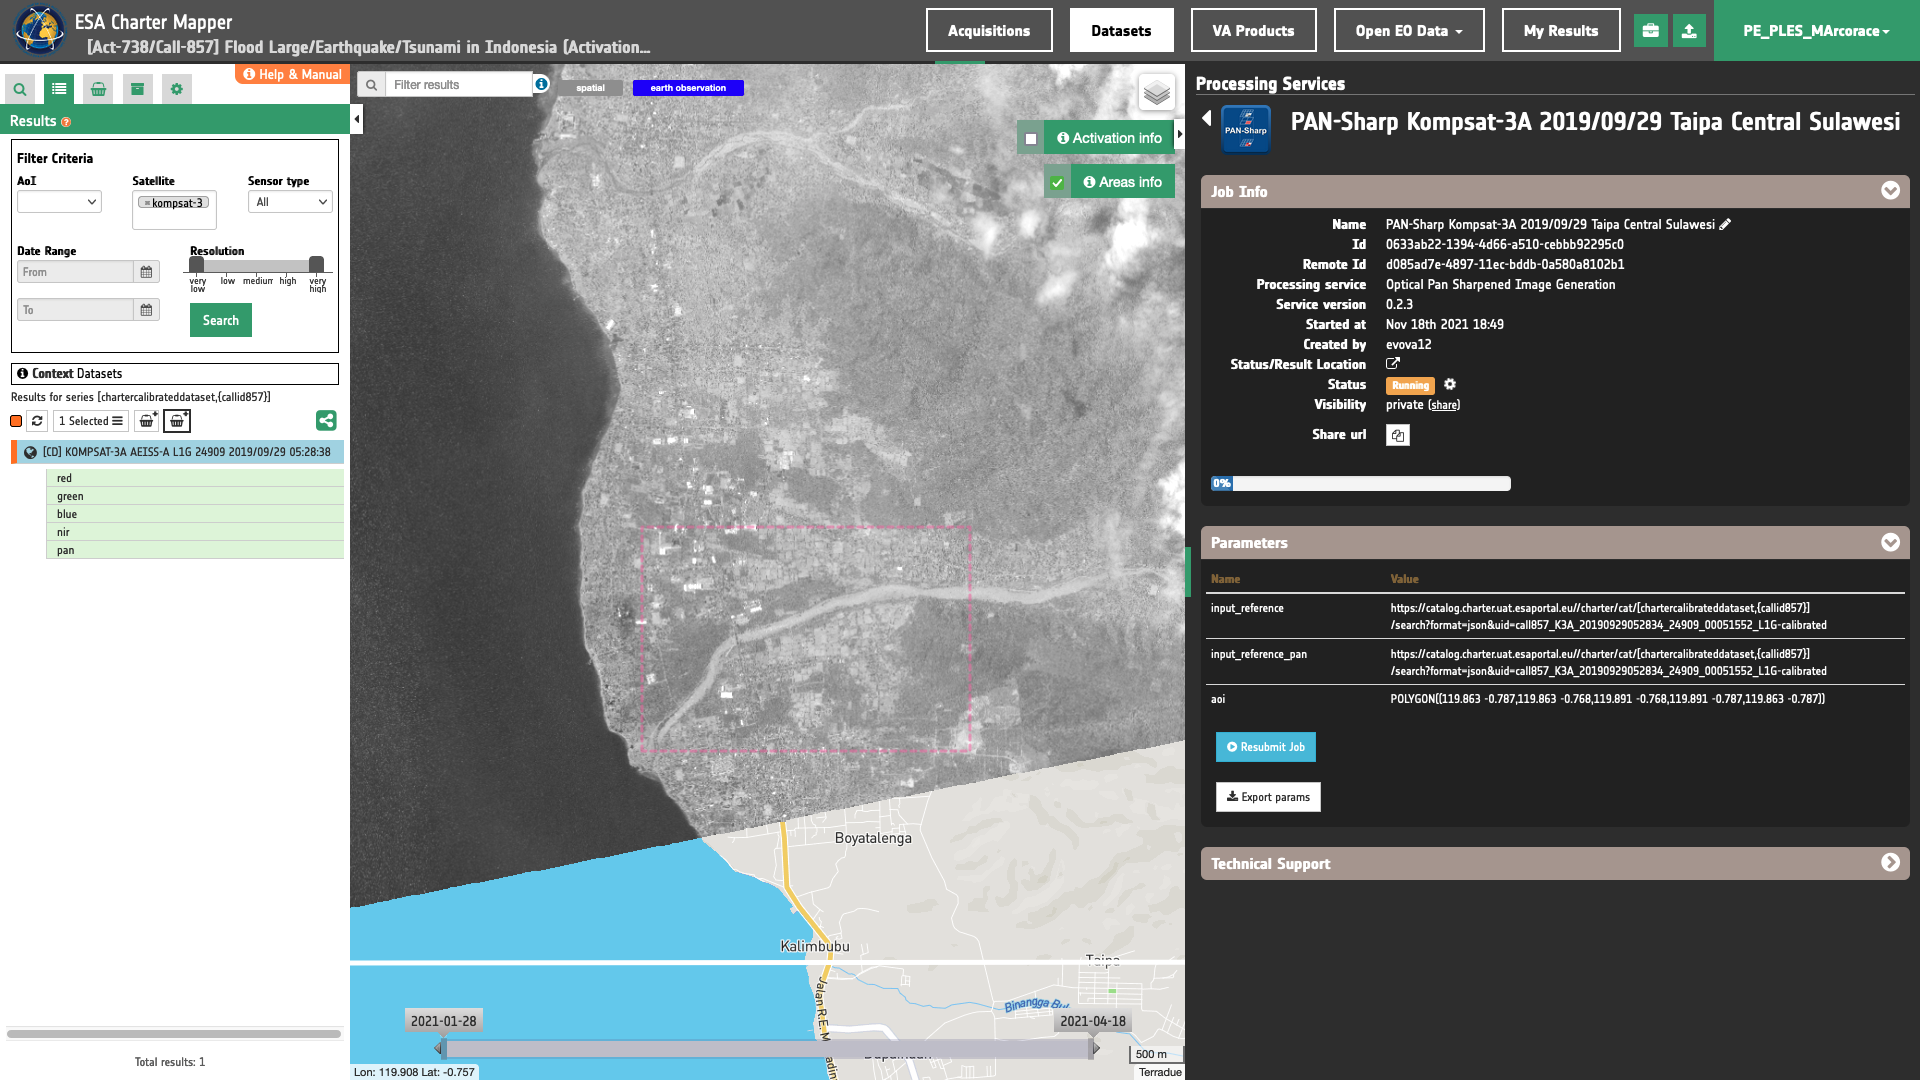
Run the job
Click on the button Run Job and see the Running Job
You can monitor job progress through the progress bar.
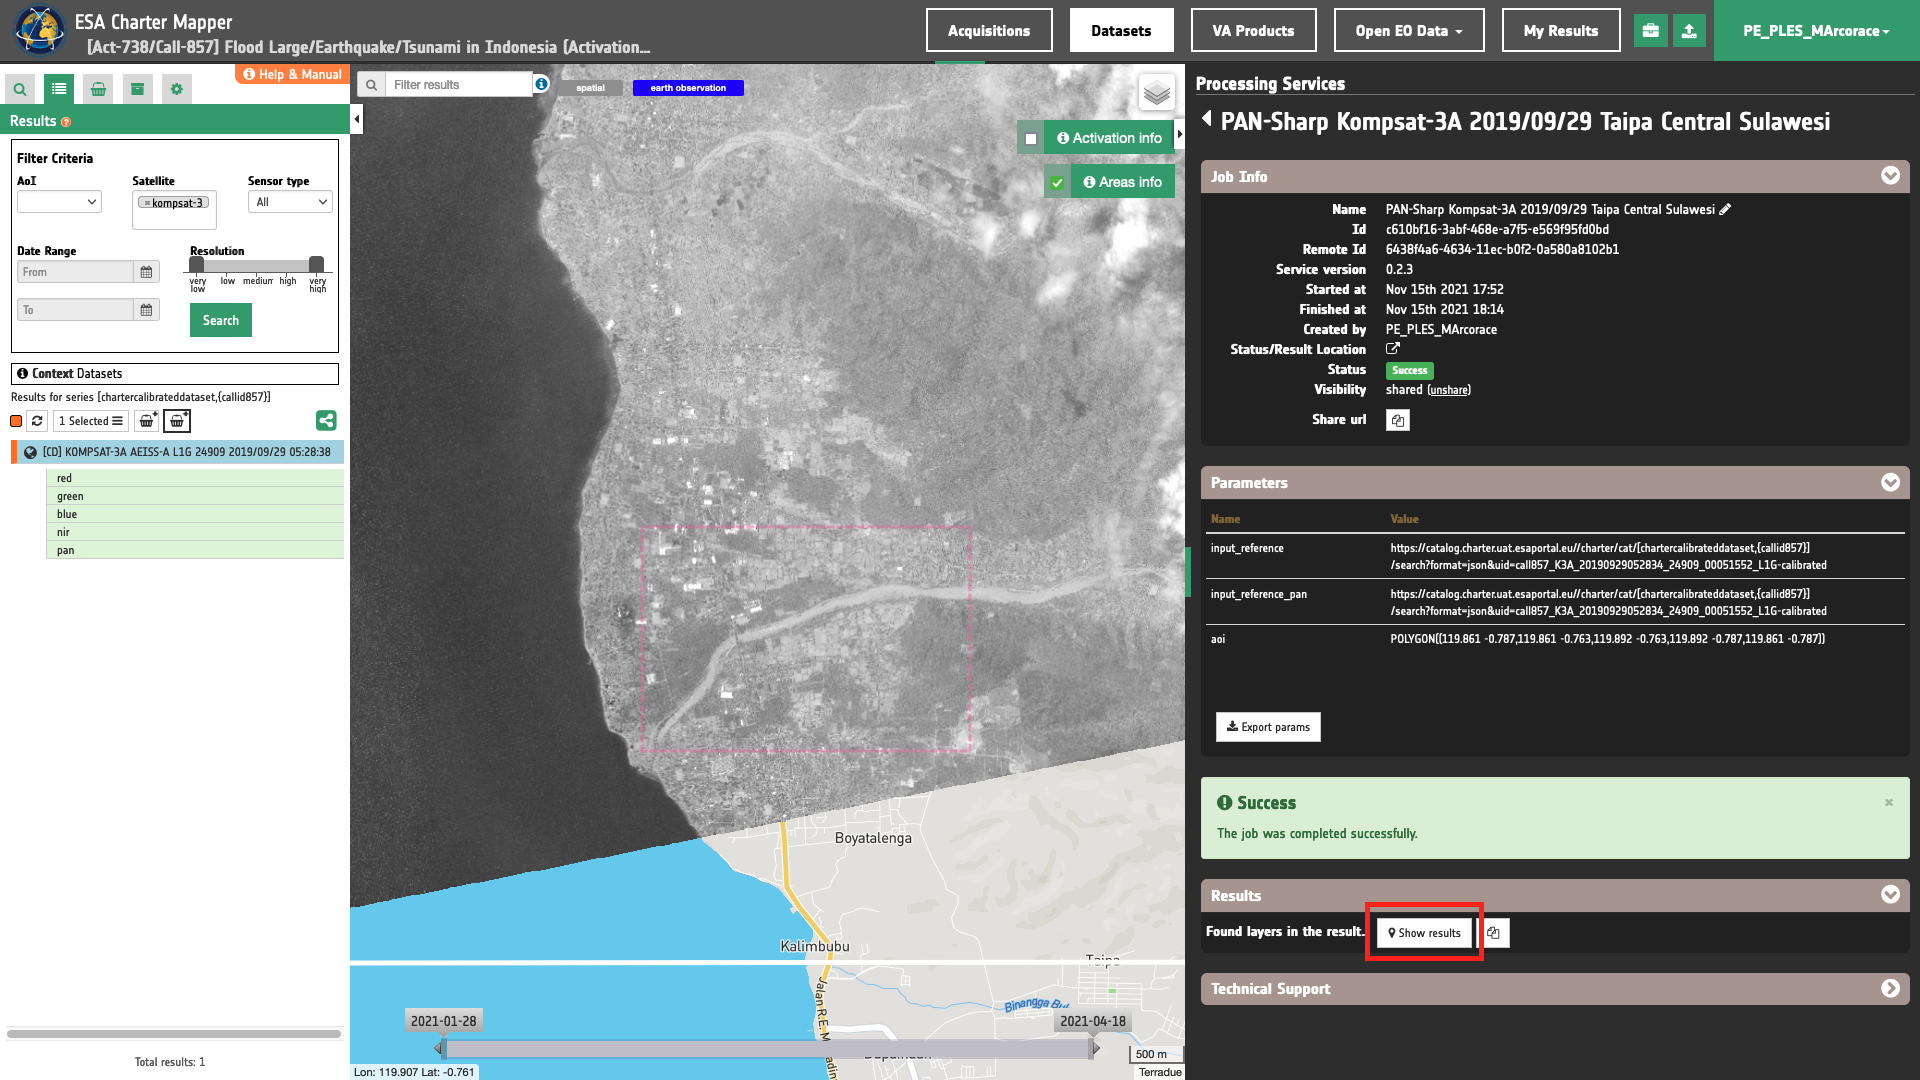
Results: download and visualization
Once the job is completed, click on the button Show results at the bottom of the processing service panel.
Tip
You can also save the parameters employed in this job by clicking on the Export params button in the right panel. This allows you to copy all your entries to the clipboard. This is meant to be used for a quick re-submission of a similar job after a fine tuning of the parameters (e.g. to change AOI).
Below is reported the syntax which includes all the parameters employed in this example.
{
   "input_reference": "https://catalog.charter.uat.esaportal.eu//charter/cat/[chartercalibrateddataset,{callid857}]/search?format=json&uid=call857_K3A_20190929052834_24909_00051552_L1G-calibrated",
   "input_reference_pan": "https://catalog.charter.uat.esaportal.eu//charter/cat/[chartercalibrateddataset,{callid857}]/search?format=json&uid=call857_K3A_20190929052834_24909_00051552_L1G-calibrated",
   "aoi": "POLYGON((119.863 -0.787,119.863 -0.768,119.891 -0.768,119.891 -0.787,119.863 -0.787))"
}
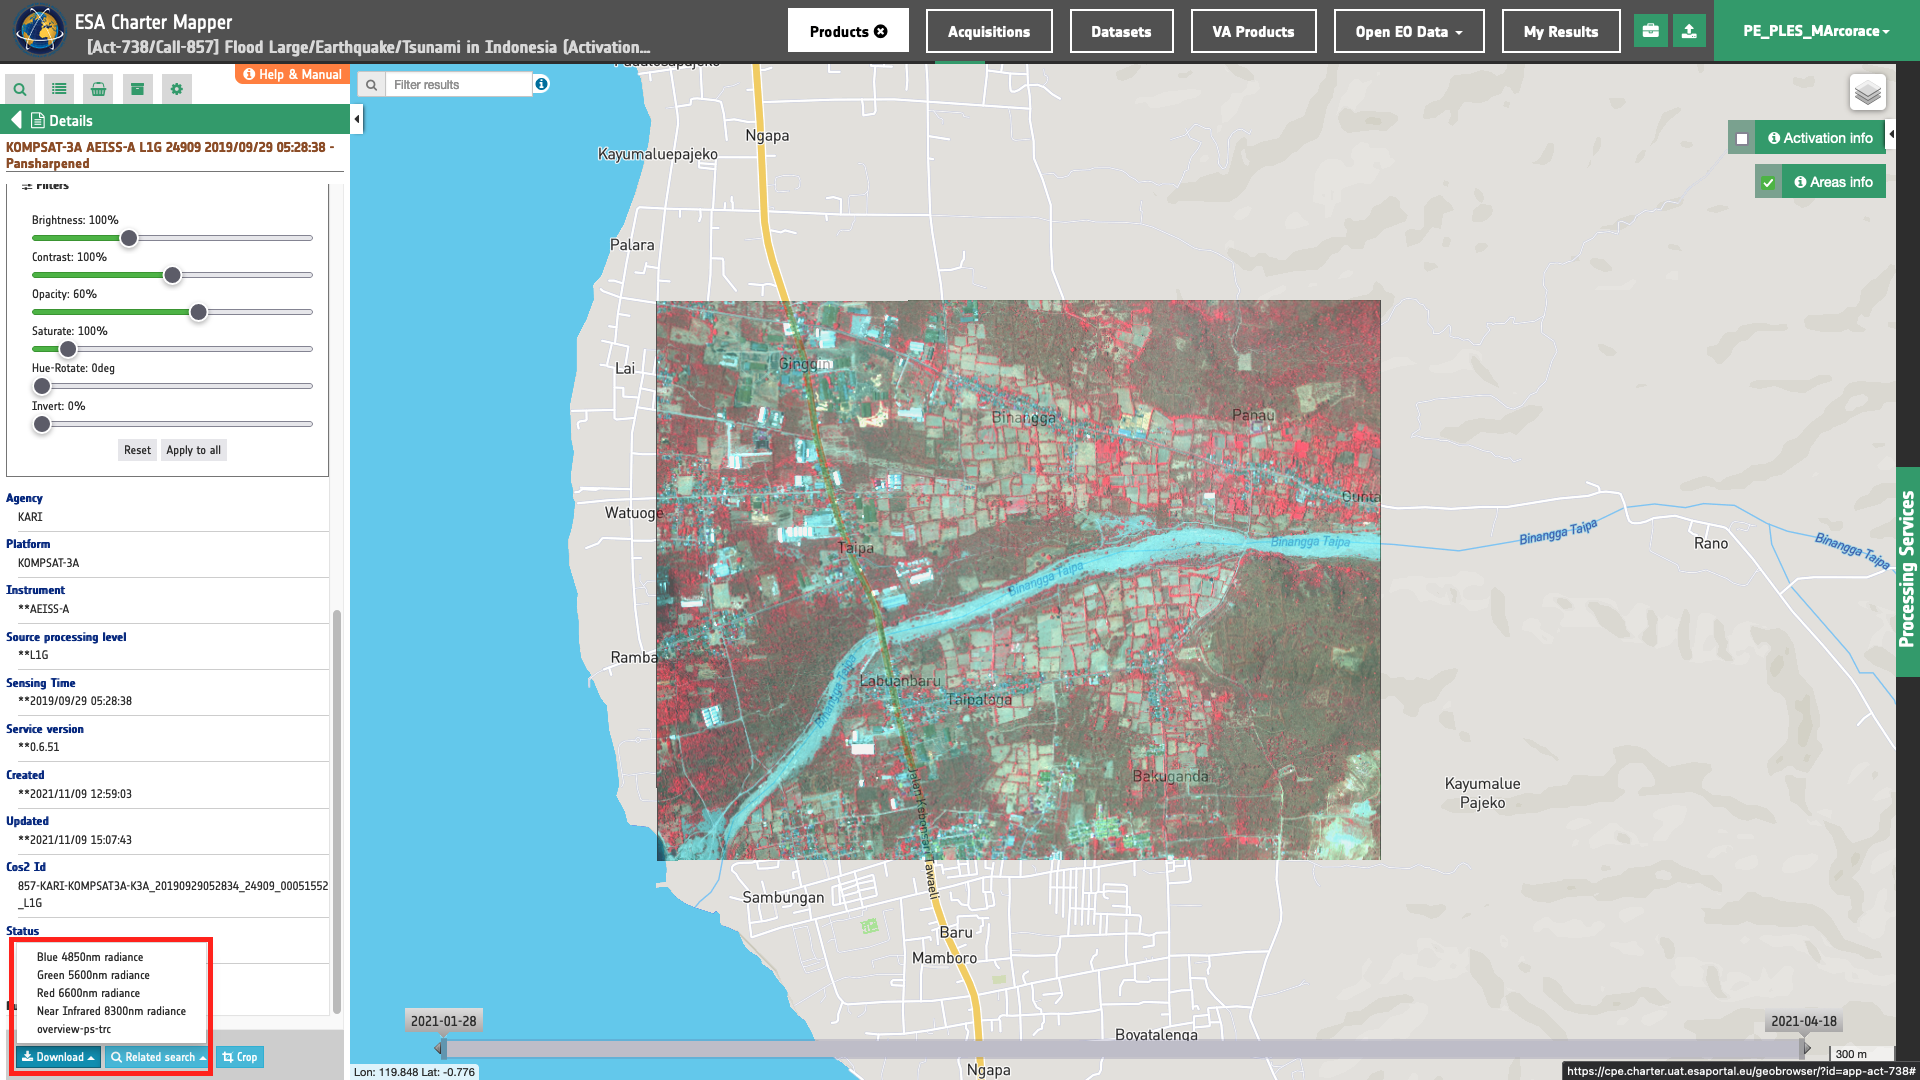
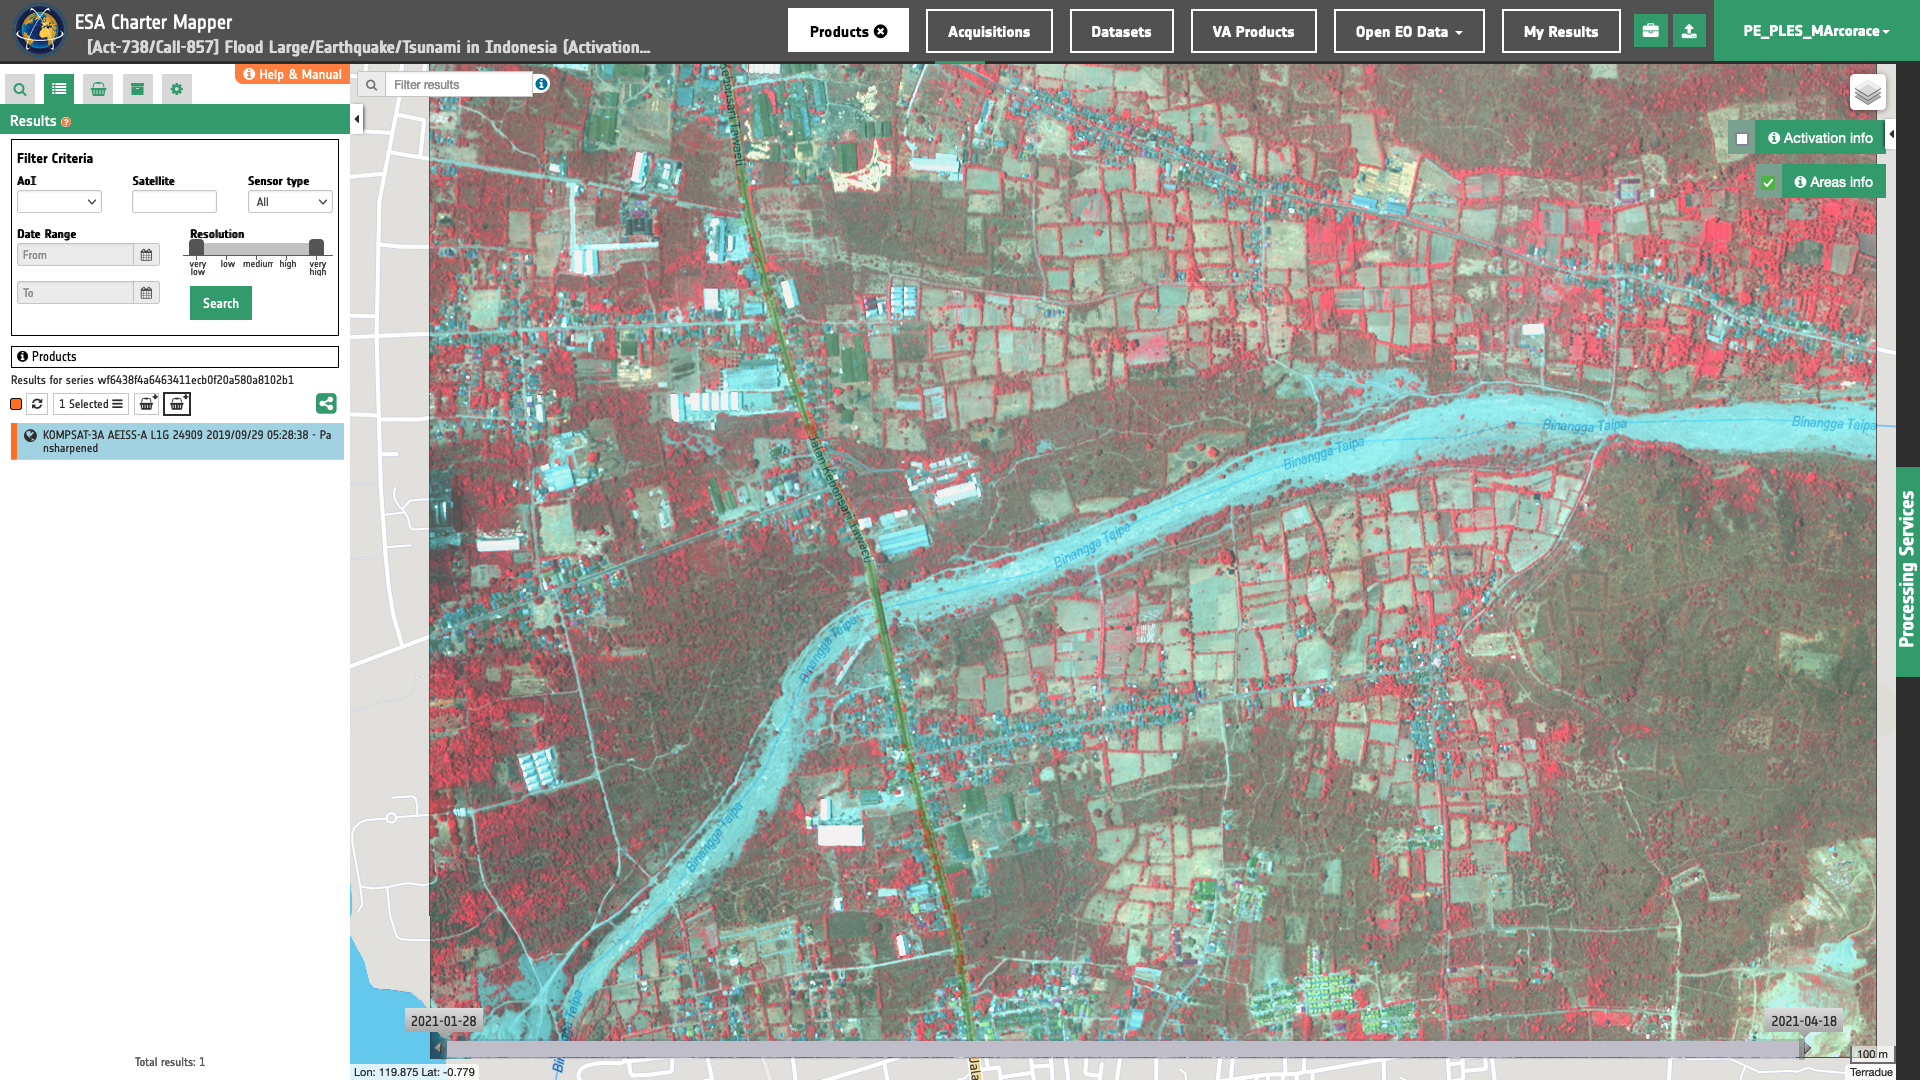
Visualization
See the result on the map. The preview appears within the area defined in the spatial filter.
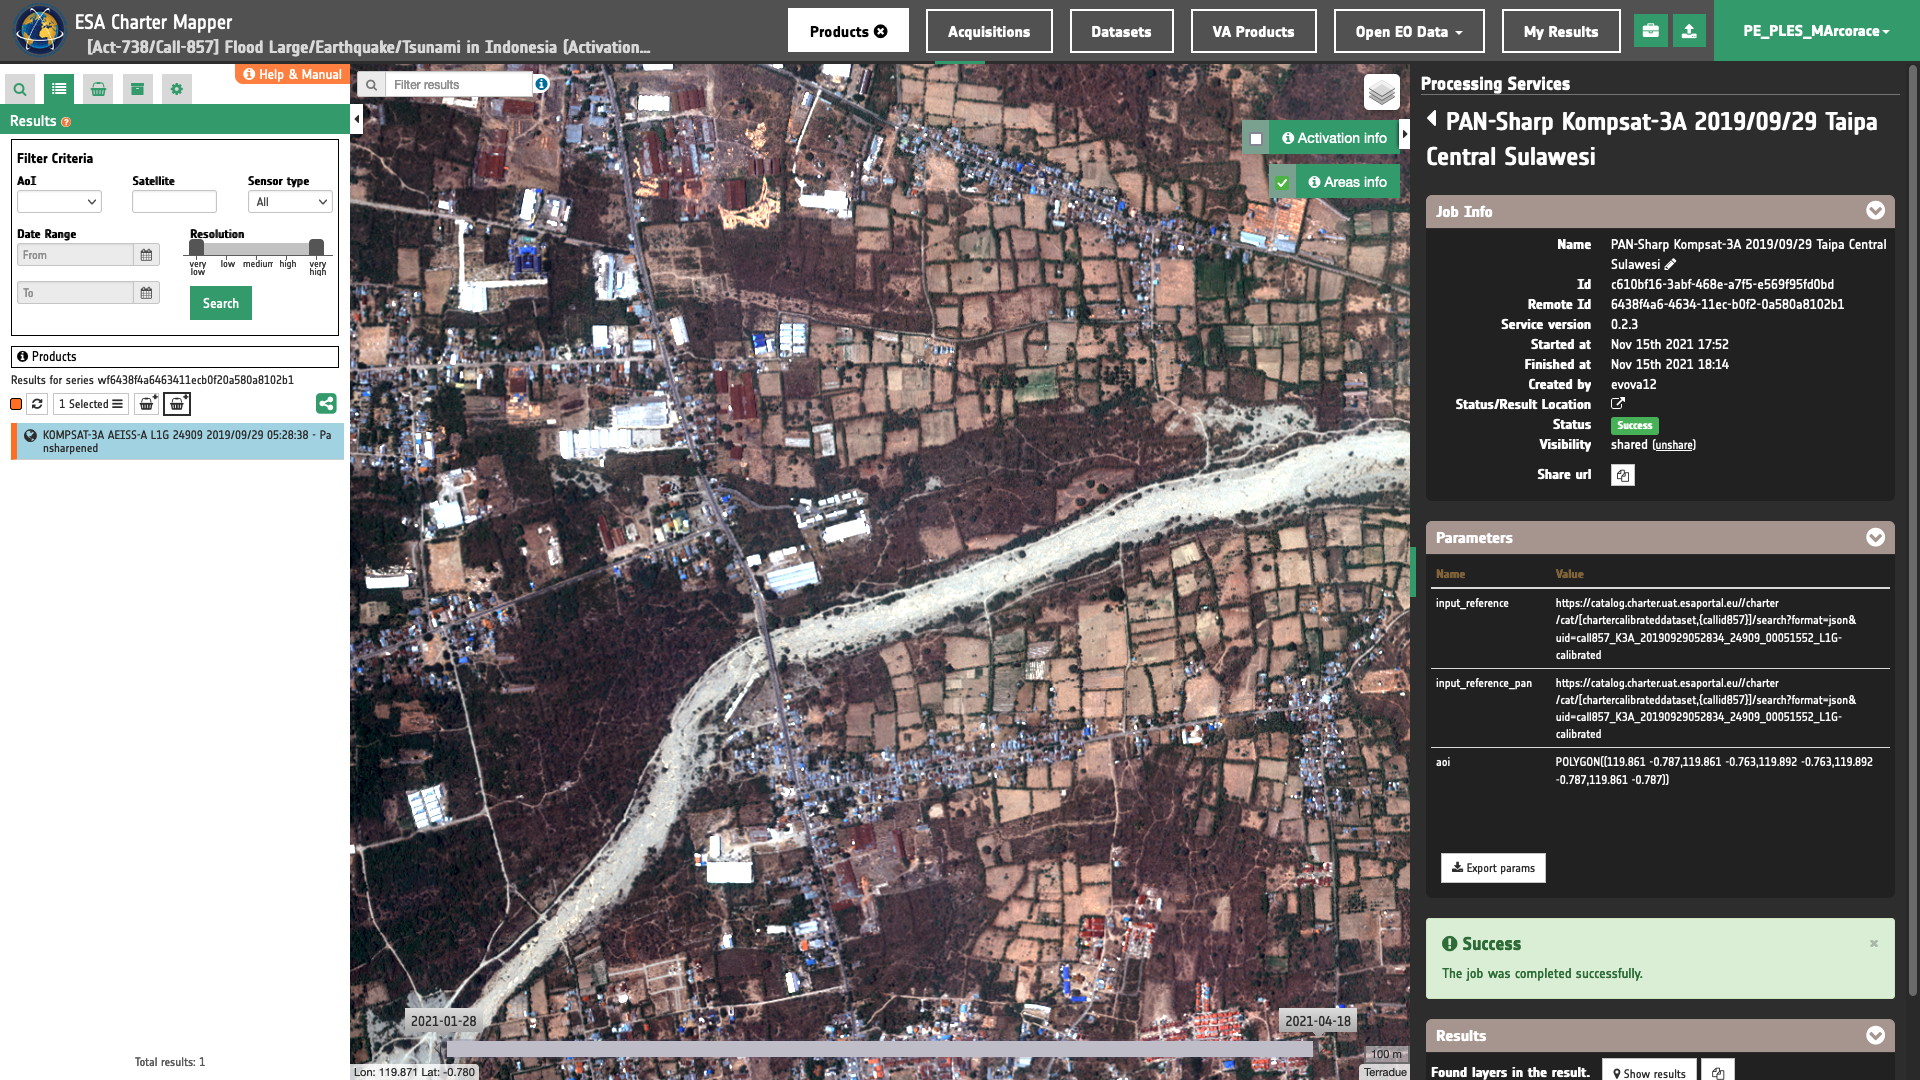
To get more information about the product just click on the preview in the map, a bubble showing the name of the layer “SKOMPSAT-3A AEISS-A L1G 24909 2019/09/29 05:28:38 - Pansharpened” will appear and then click on the Show details button.
Tip
To quickly access Product Details double click on the layer from the Results list.
In the left panel of the interface, the details of Job Result will appear with Product metadata. Furthermore by clicking on Layer styling you can also access to the View options. In here it is possible to see histogram/s of the Product which is visible in the map, set color formula, change Filters (e.g. Brightness, Opacity).
Tip
To visually compare the product overview with the underlying base layer (e.g. Natural Earth or Dark map) you can set the Opacity filter under View options as 60%.
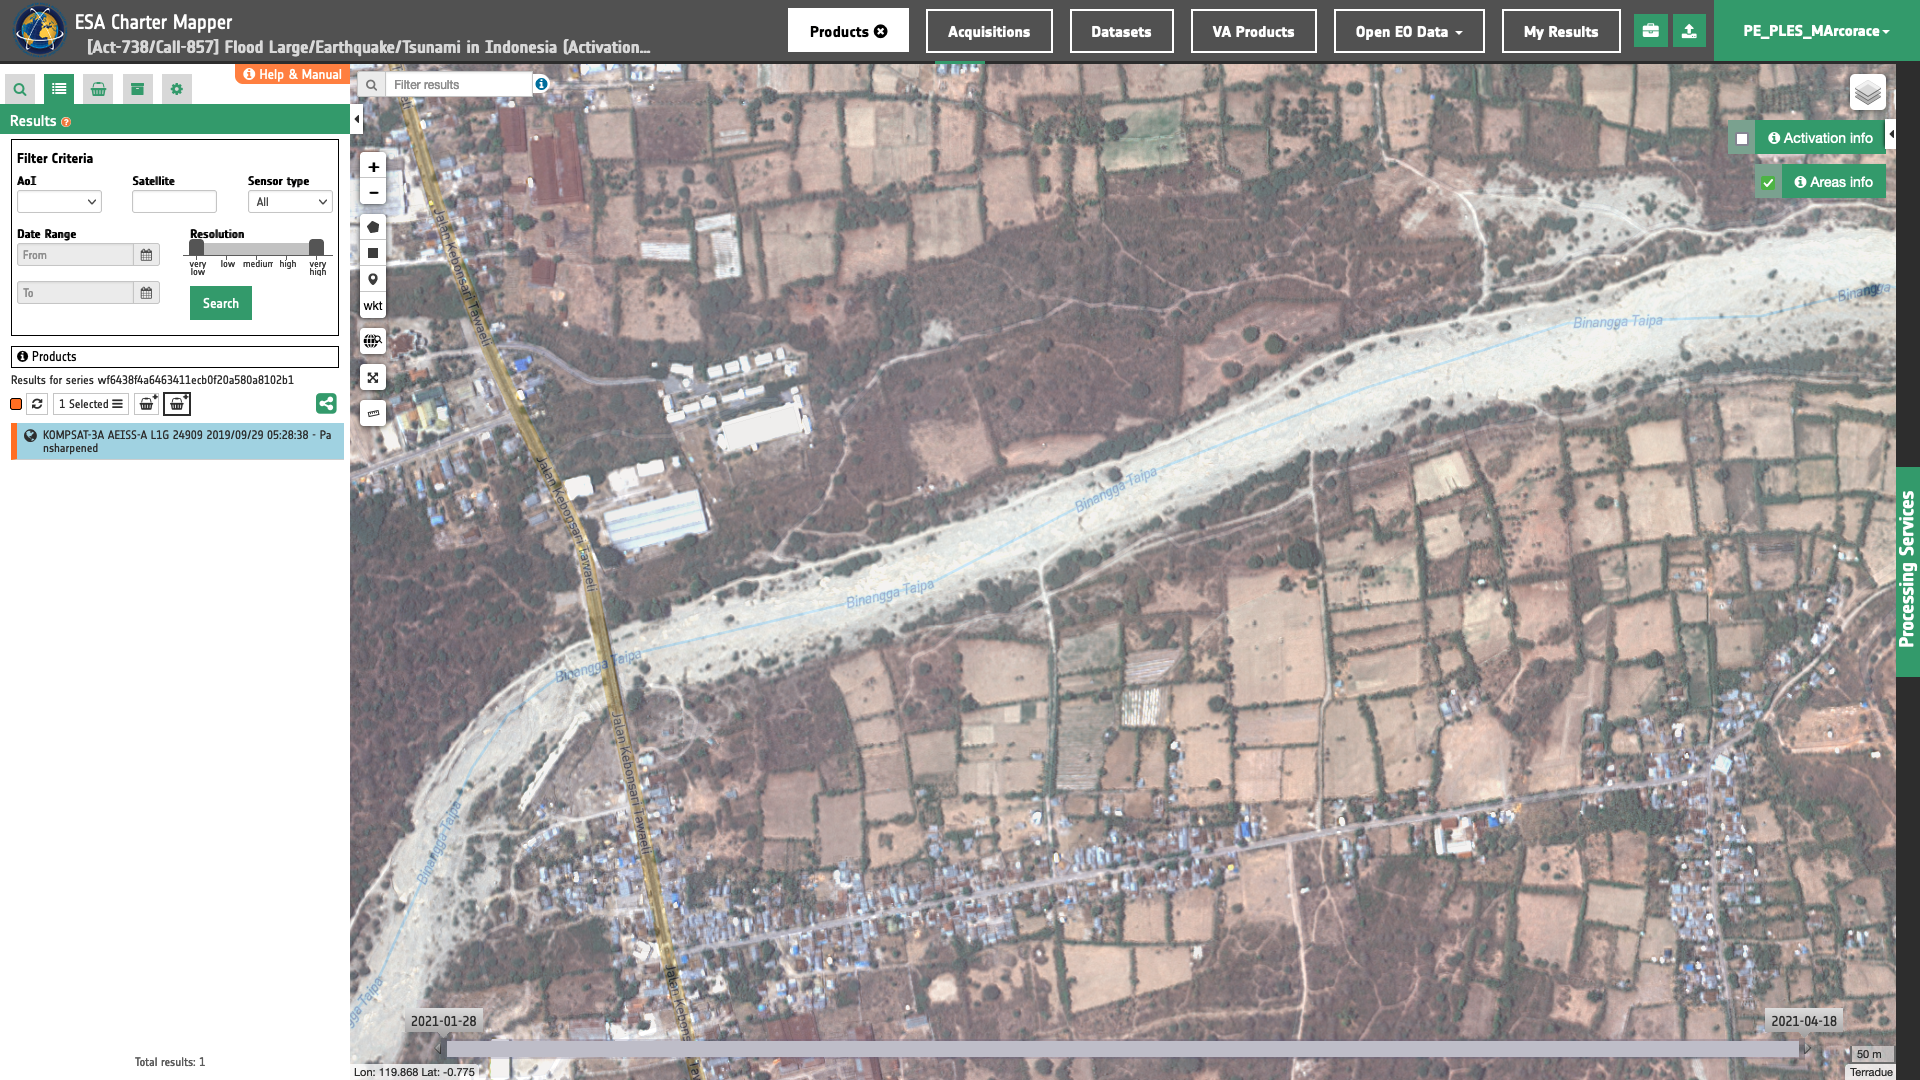
It is also possible to customize the overview on the fly by clicking on Layer Styling and Combine Assets. Min and Max values can be changed for RGB histograms.
Tip
Under Combine assets it is possible to create RGB composites on the fly using the obtained spectral indexes. Example it is possible to apply the following RGB combination to obtain a CIV overview with pan-sharpened bands:
r-ps-nirfor RED-channel,r-ps-redfor GREEN-channel,r-ps-greenfor BLUE-channel.
Download
In the Optical Spectral Index (OPT-Index) service the following files are produced:
- r-ps-blue: asset
bluepan-sharpened TOA reflectance product from reference image as single band GeoTIFF in COG format, - r-ps-green: asset
greenpan-sharpened TOA reflectance product from reference image as single band GeoTIFF in COG format, - r-ps-red: asset
redpan-sharpened TOA reflectance product from reference image as single band GeoTIFF in COG format, - r-ps-nir: asset
nirpan-sharpened TOA reflectance product from reference image as single band GeoTIFF in COG format, - overview-ps-trc: TRC overview using pan-sharpened assets as 4-band GeoTIFF in COG format,
These products can be downloaded by clicking on the Download button located at the bottom of the Product Details tab in the left panel.