HASARD Dual Image tutorial
![]()
This service provides a binary flood mask by applying an automatic change detection algorithm between a pair of pre- and post-event Sentinel-1 datasets selected by the user (one before and one after the event). The service analyzes the reference and flooded images and retrieves the increased water extent with respect to the reference (areas considered as standing water bodies are removed).
 HASARD Dual Image service description and specifications are available in this section.
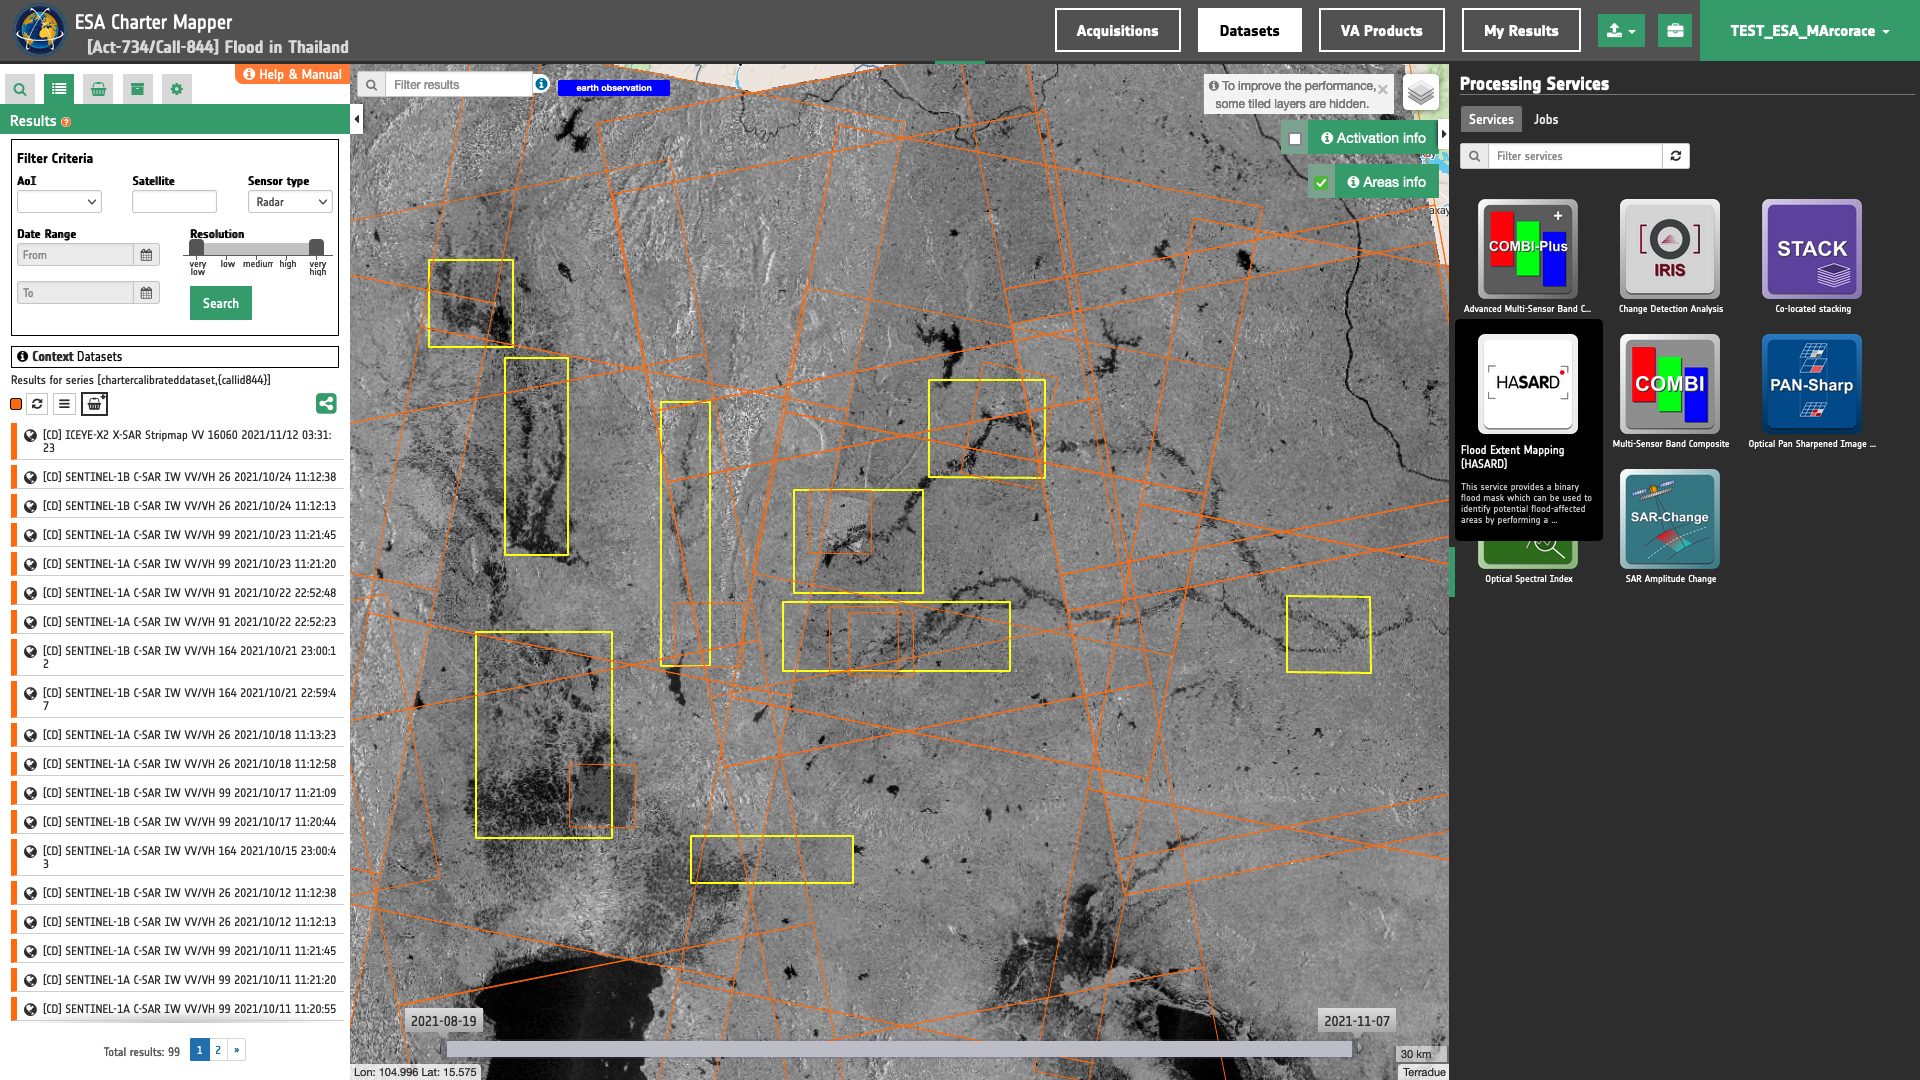
Select the processing service
After the opening of the activation workspace, in the right panel of the interface, open the Processing Services tab.
Select the processing service HASARD Dual Image.
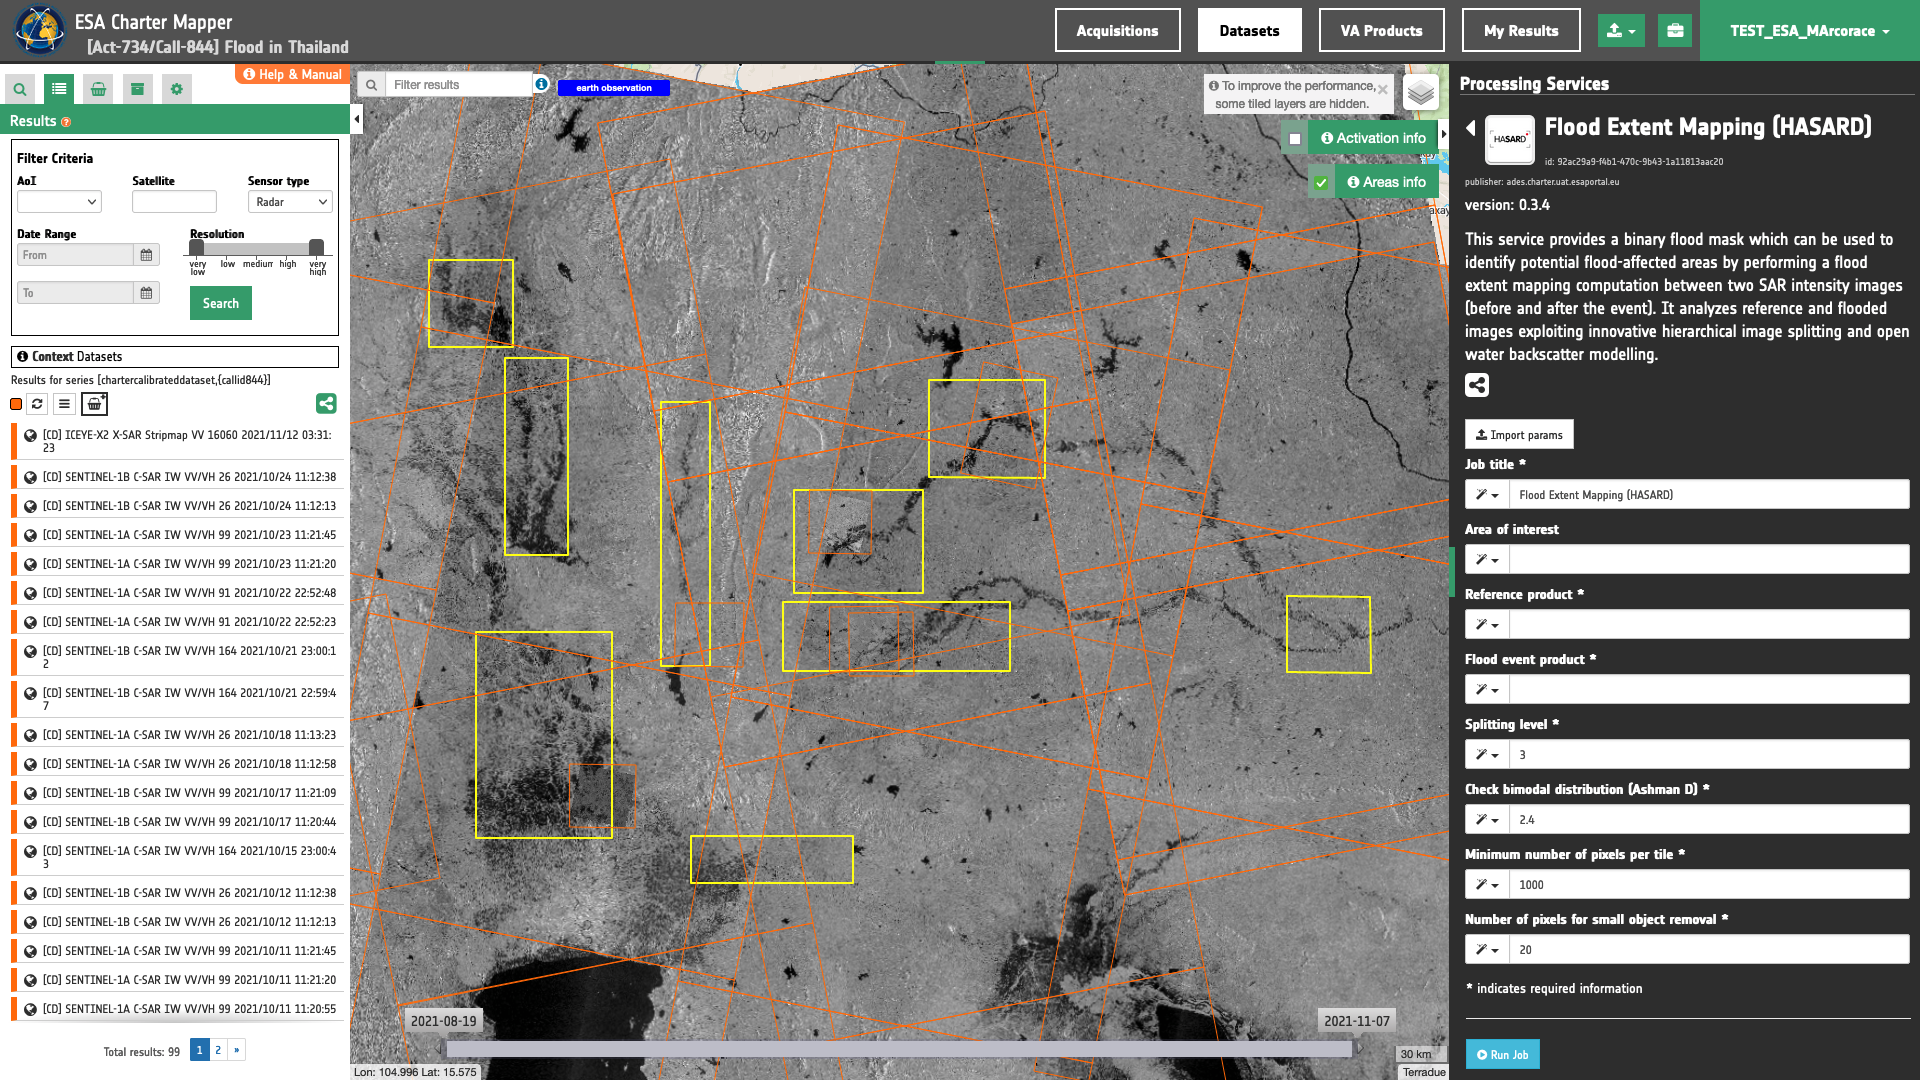
The "HASARD Dual Image"1 panel is displayed with parameters values to be filled-in.
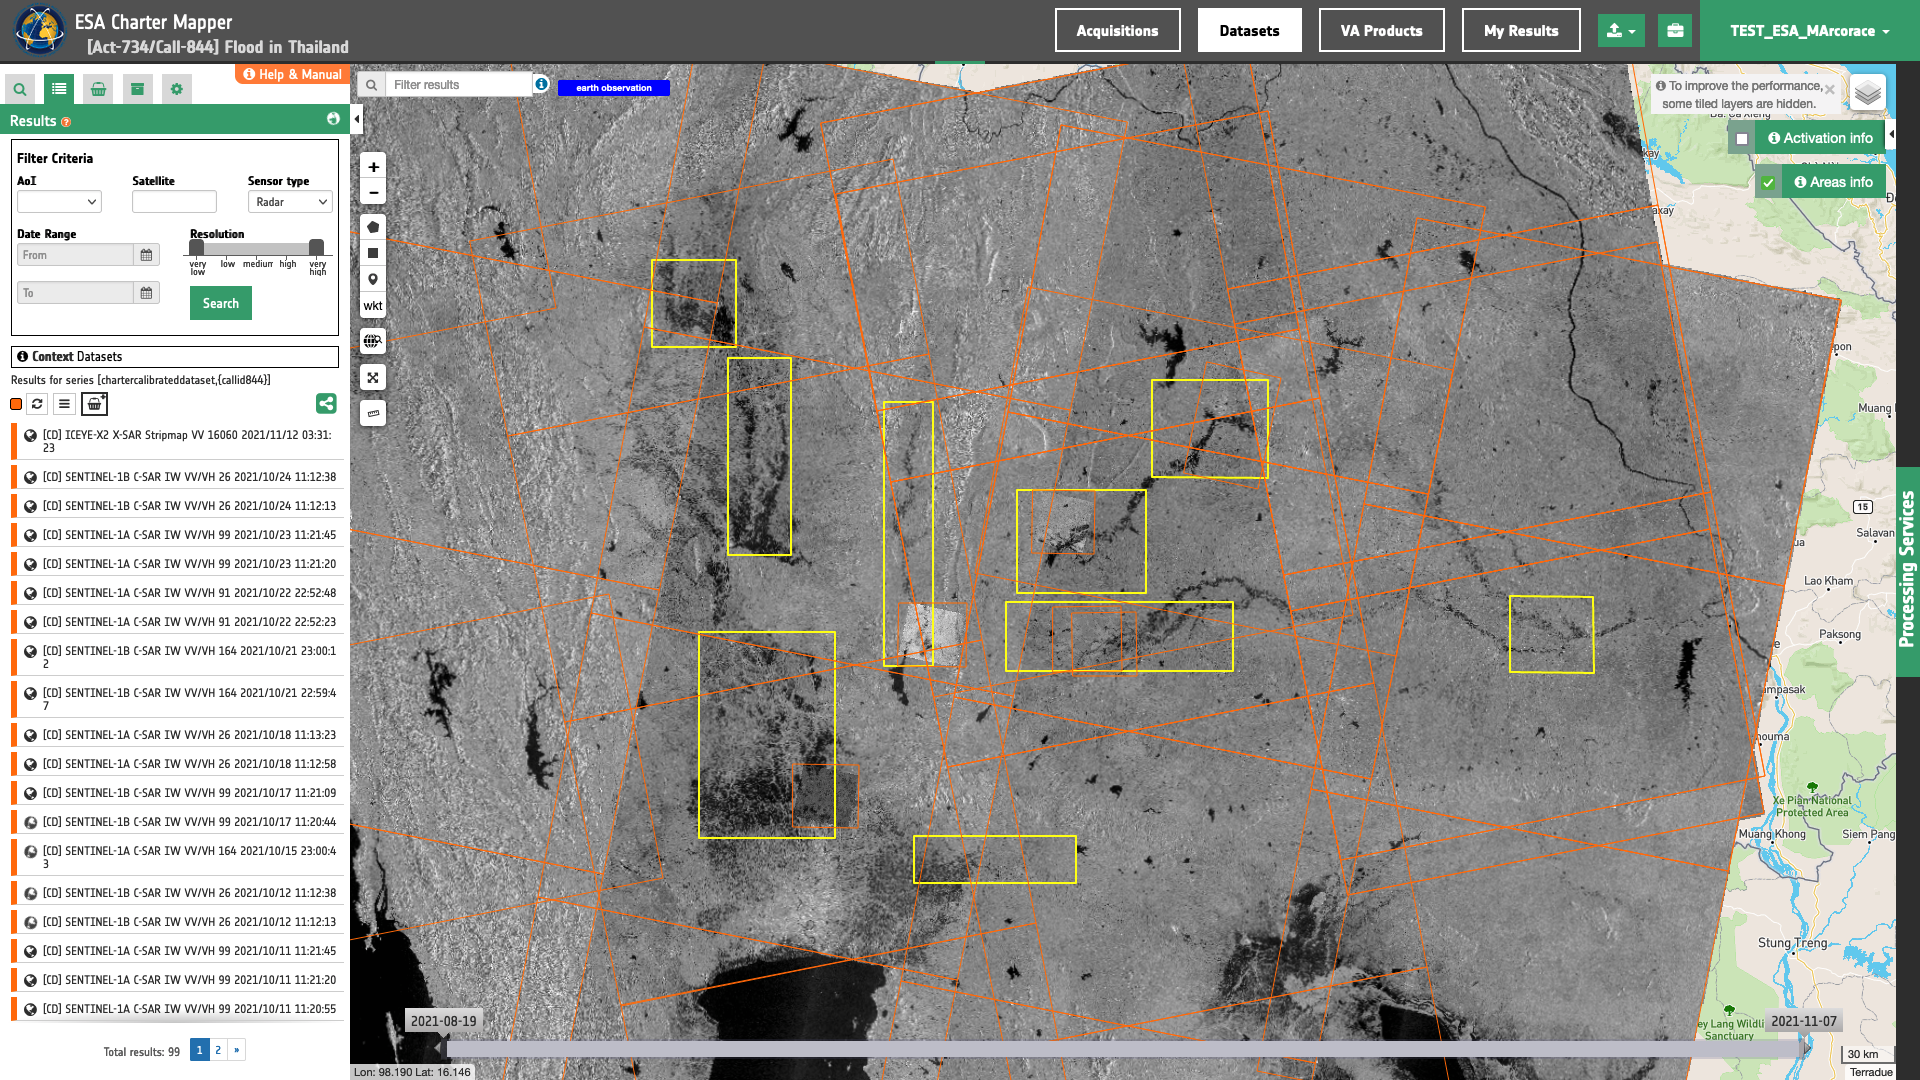
Find the data using multiple filter criteria
-
Select the area in which you want to make your analysis, e.g over the central region of Thailand.
-
From the Navigation and Search toolbar (located in the upper left side of the map), click on Spatial Filter and draw a square AOI over the Nakhon Sawan Province in Thailand. This spatial filter allows you to select only the EO data acquired over this area.
-
From the top of the left panel, use Filter Criterias to search for “Radar” and "Sentinel-1" data collections from the list.
-
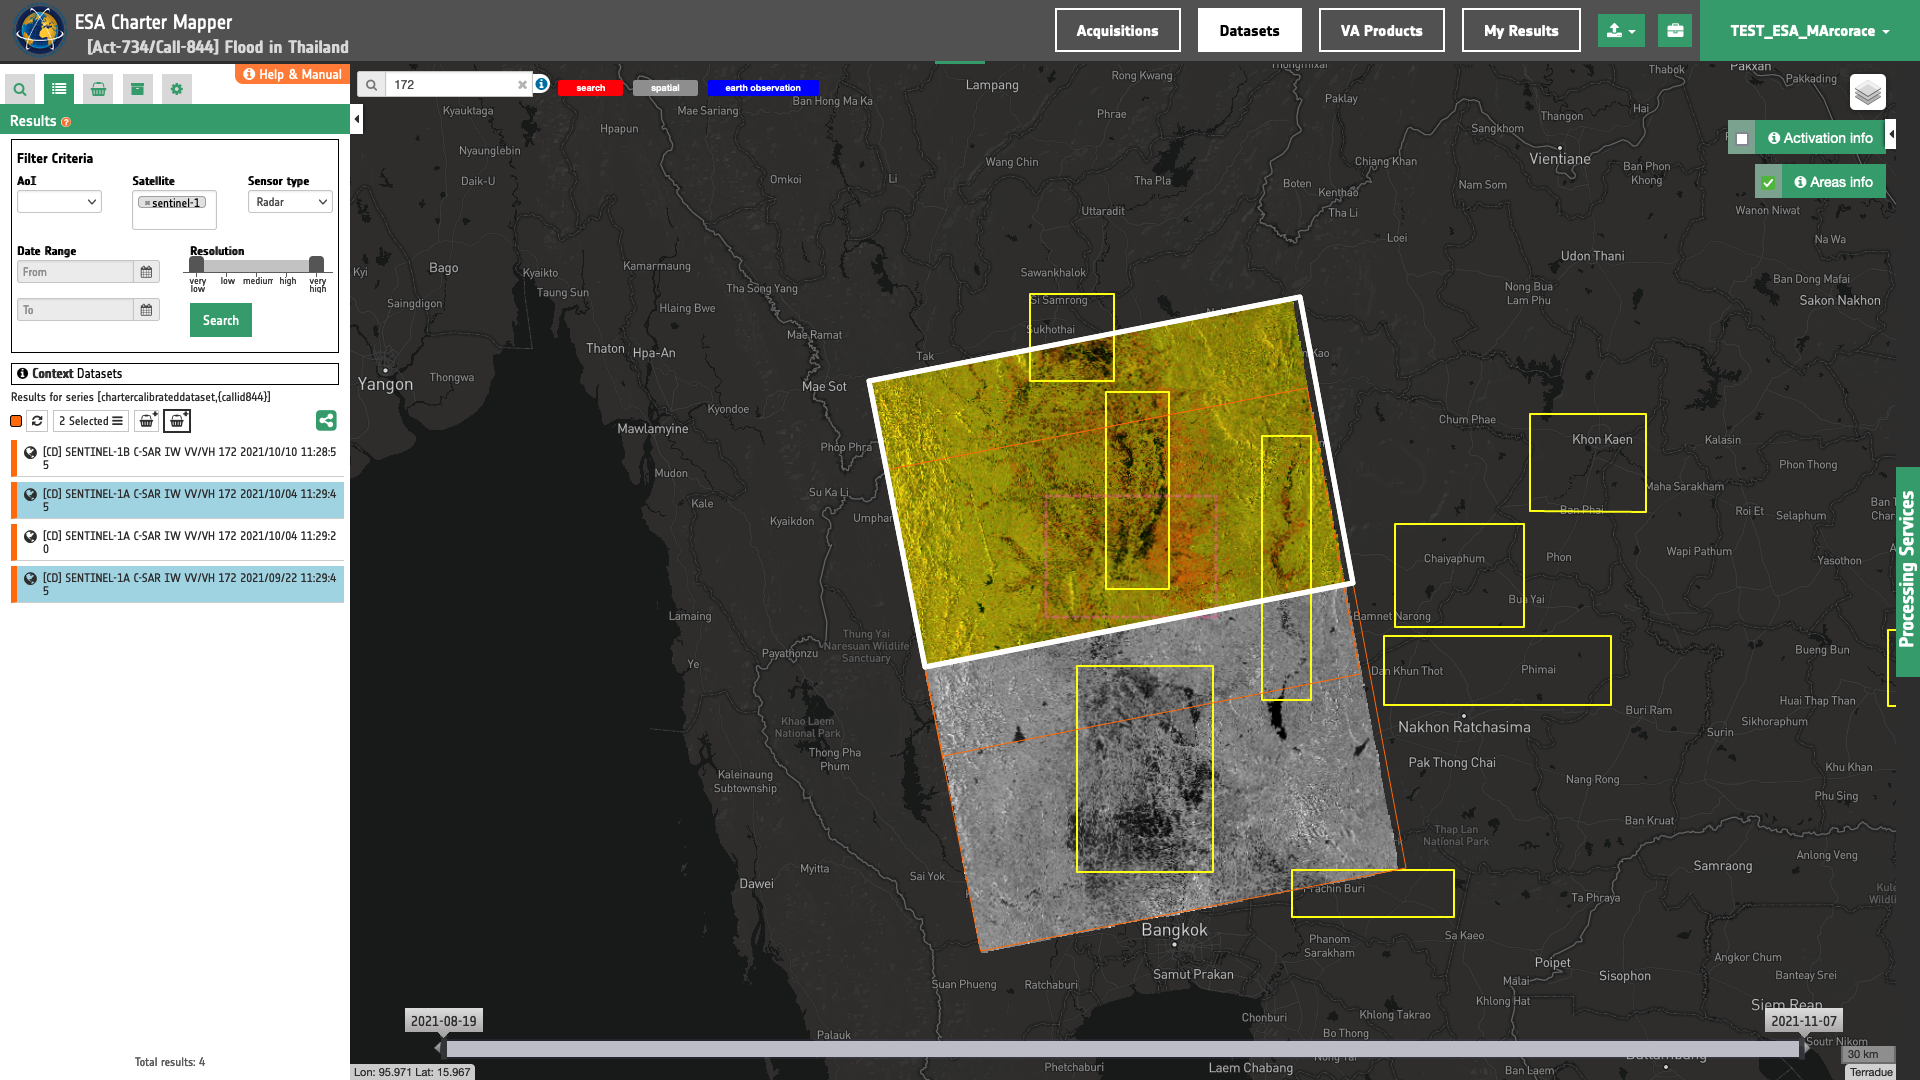
After the query the list will be updates as the one shown in the next image.
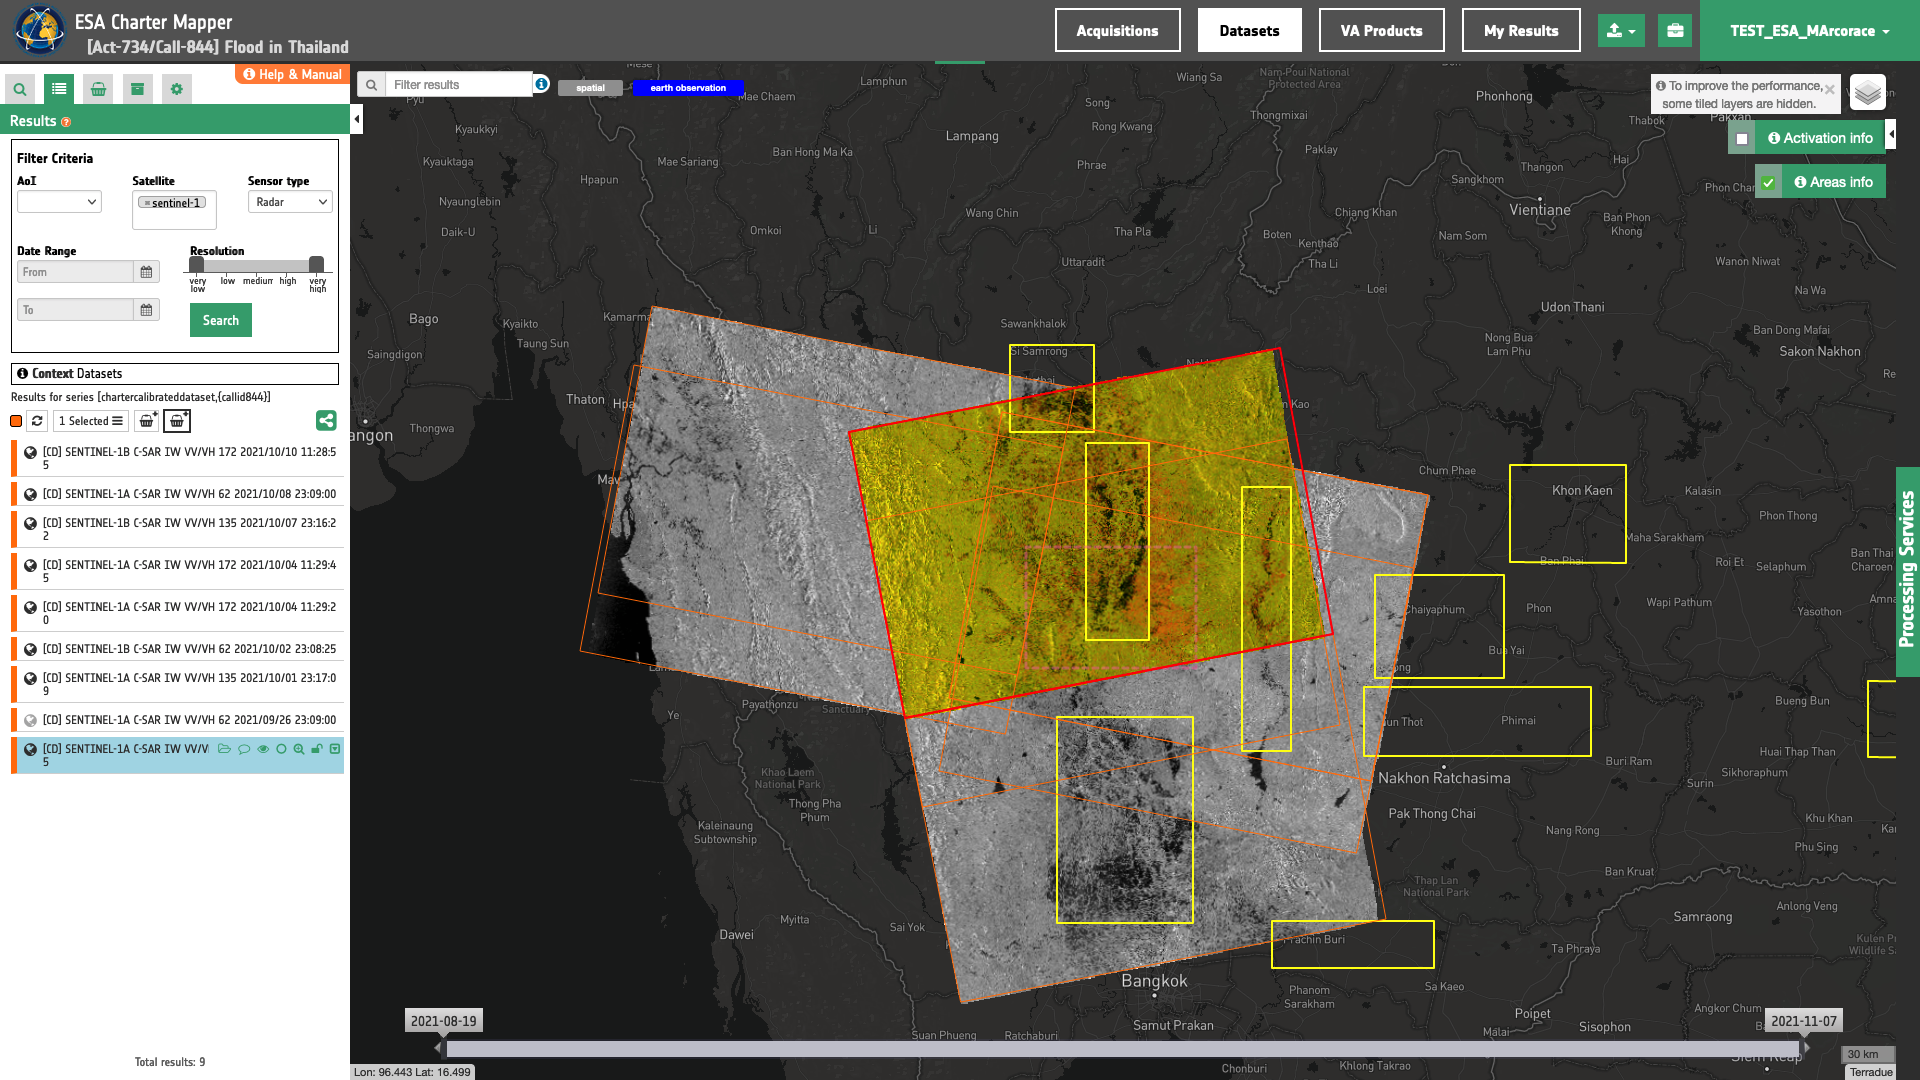
- Now it is possible to choose a pair of "Flood" and "Reference" co-pol backscatter images from SAR Calibrated Datasets to be used for the flood detection analysis. This pair must come from the same sensor and shall have the same radar geometry (incident angle, orbit path).
Tip
To filter results by realtive orbit number you can use the Text filter by inserting 172 in the Search Terms text box always visible on the top left of the map.
Note
Useful iformation about Sentinel-1 relative orbits can be found at https://sentinels.copernicus.eu.
-
As an example you can choose the following pair:
-
Reference: SENTINEL-1A C-SAR IW VV/VH 172 2021/09/22 11:29:45
-
Flood image: SENTINEL-1A C-SAR IW VV/VH 172 2021/10/04 11:29:45
-
-
Alternatively, you may also consider the S1 pair exploited in the VAPs2 preapared by UNITAR/UNOSAT3 for Activation-7344.
Fill the paramters
After the definition of spatial and time filters, you can employ HASARD Dual Image, by using a suitable pair of Calibrated Datasets from Sentinel-1 data.
To do so you can fill the parameters as described in the following sections.
Job name
- Insert as job name:
HASARD Dual Image Sentinel-1 22/09 - 04/10 2021 Nakhon Sawan Thailand
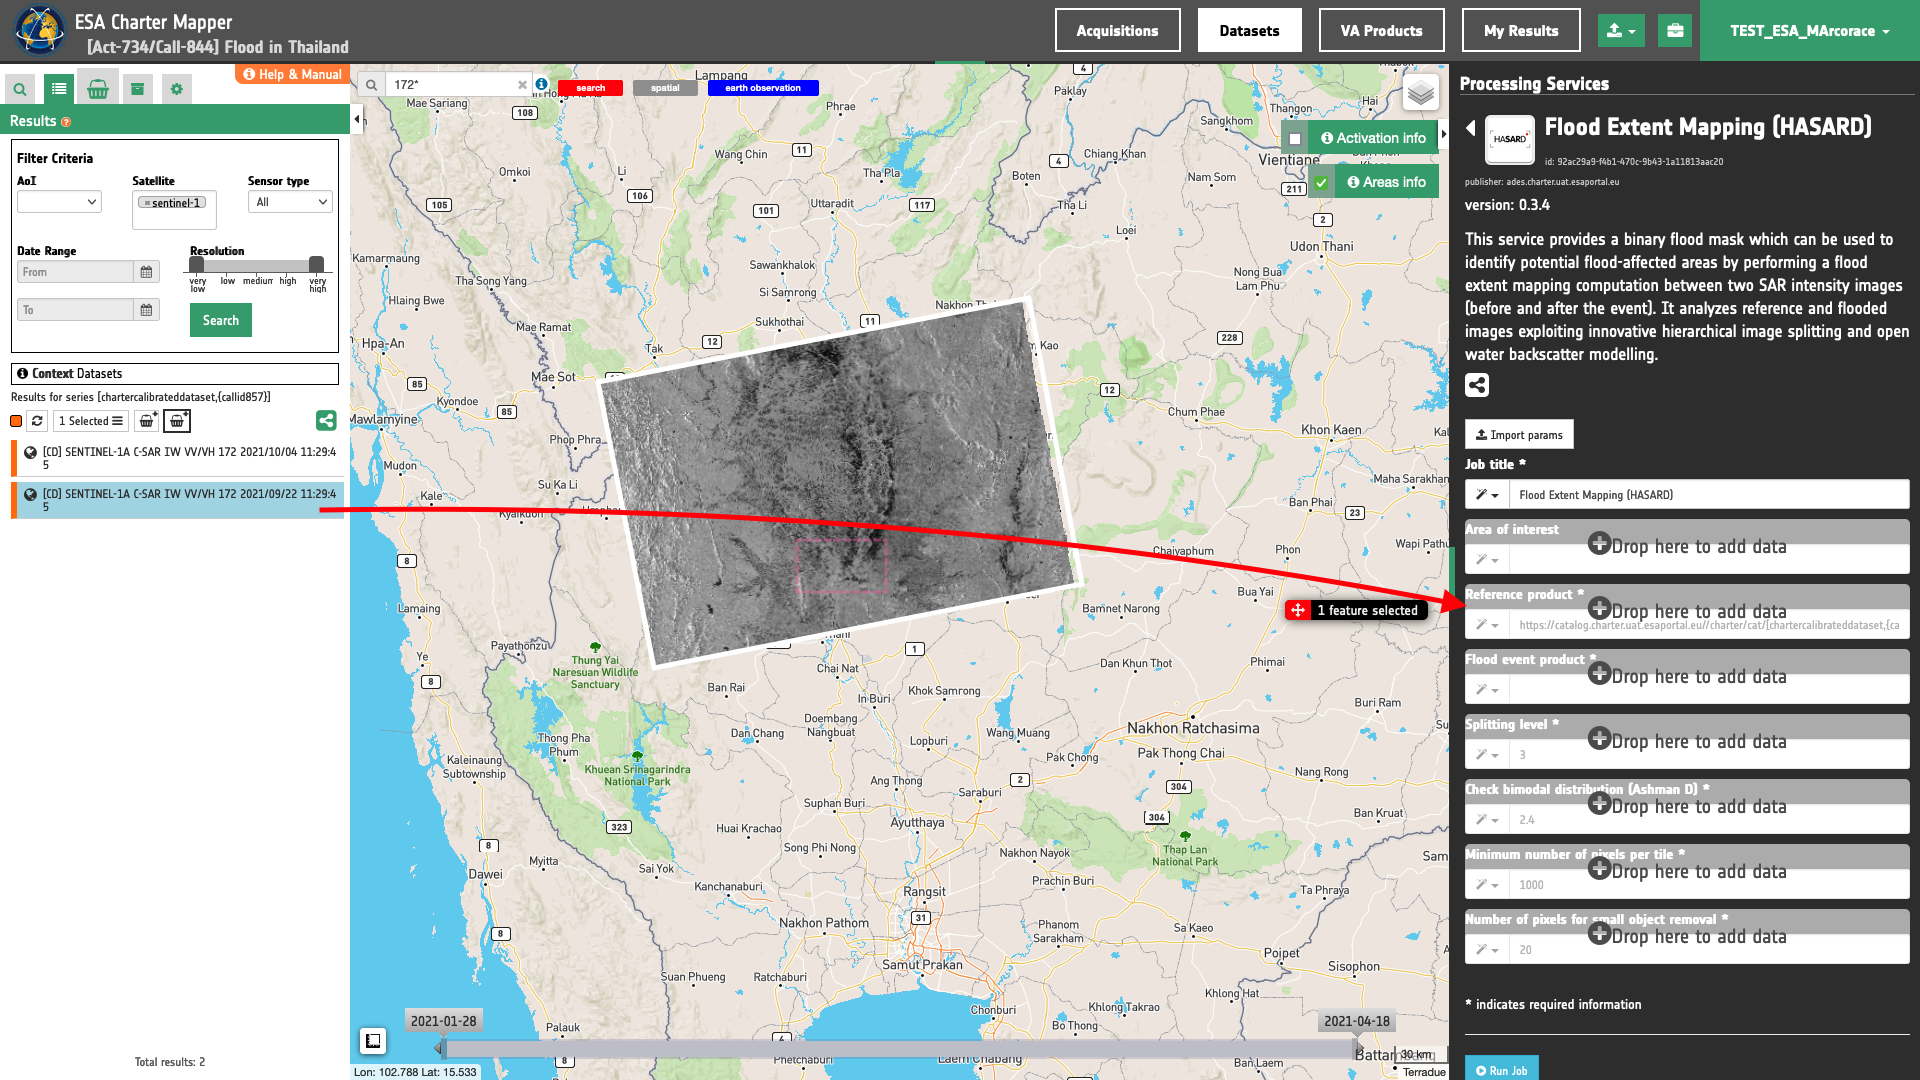
Reference input
Drag and Drop the selected items:
-
flood image (Sigma0 VV during crisis)
-
reference image (Sigma0 VV before the event)
in the Flood event image and the Reference image fields respectively.
Warning
Drag and drop the Dataset (e.g. "[CD] SENTINEL-1A C-SAR IW VV/VH 172 2021/10/04 11:29:45") and not the single-band asset (e.g. "s0_db_c_vv") into Flood event image field.
HSBA parameters
The other four mandatory parameters, Splitting level, Check bimodal distribution (Ashman D), Minimum number of pixels per tile, Number of pixels for small object removal represents the parameters of the retrieval algorithm. Default values can be used for these four HSBA parameters.
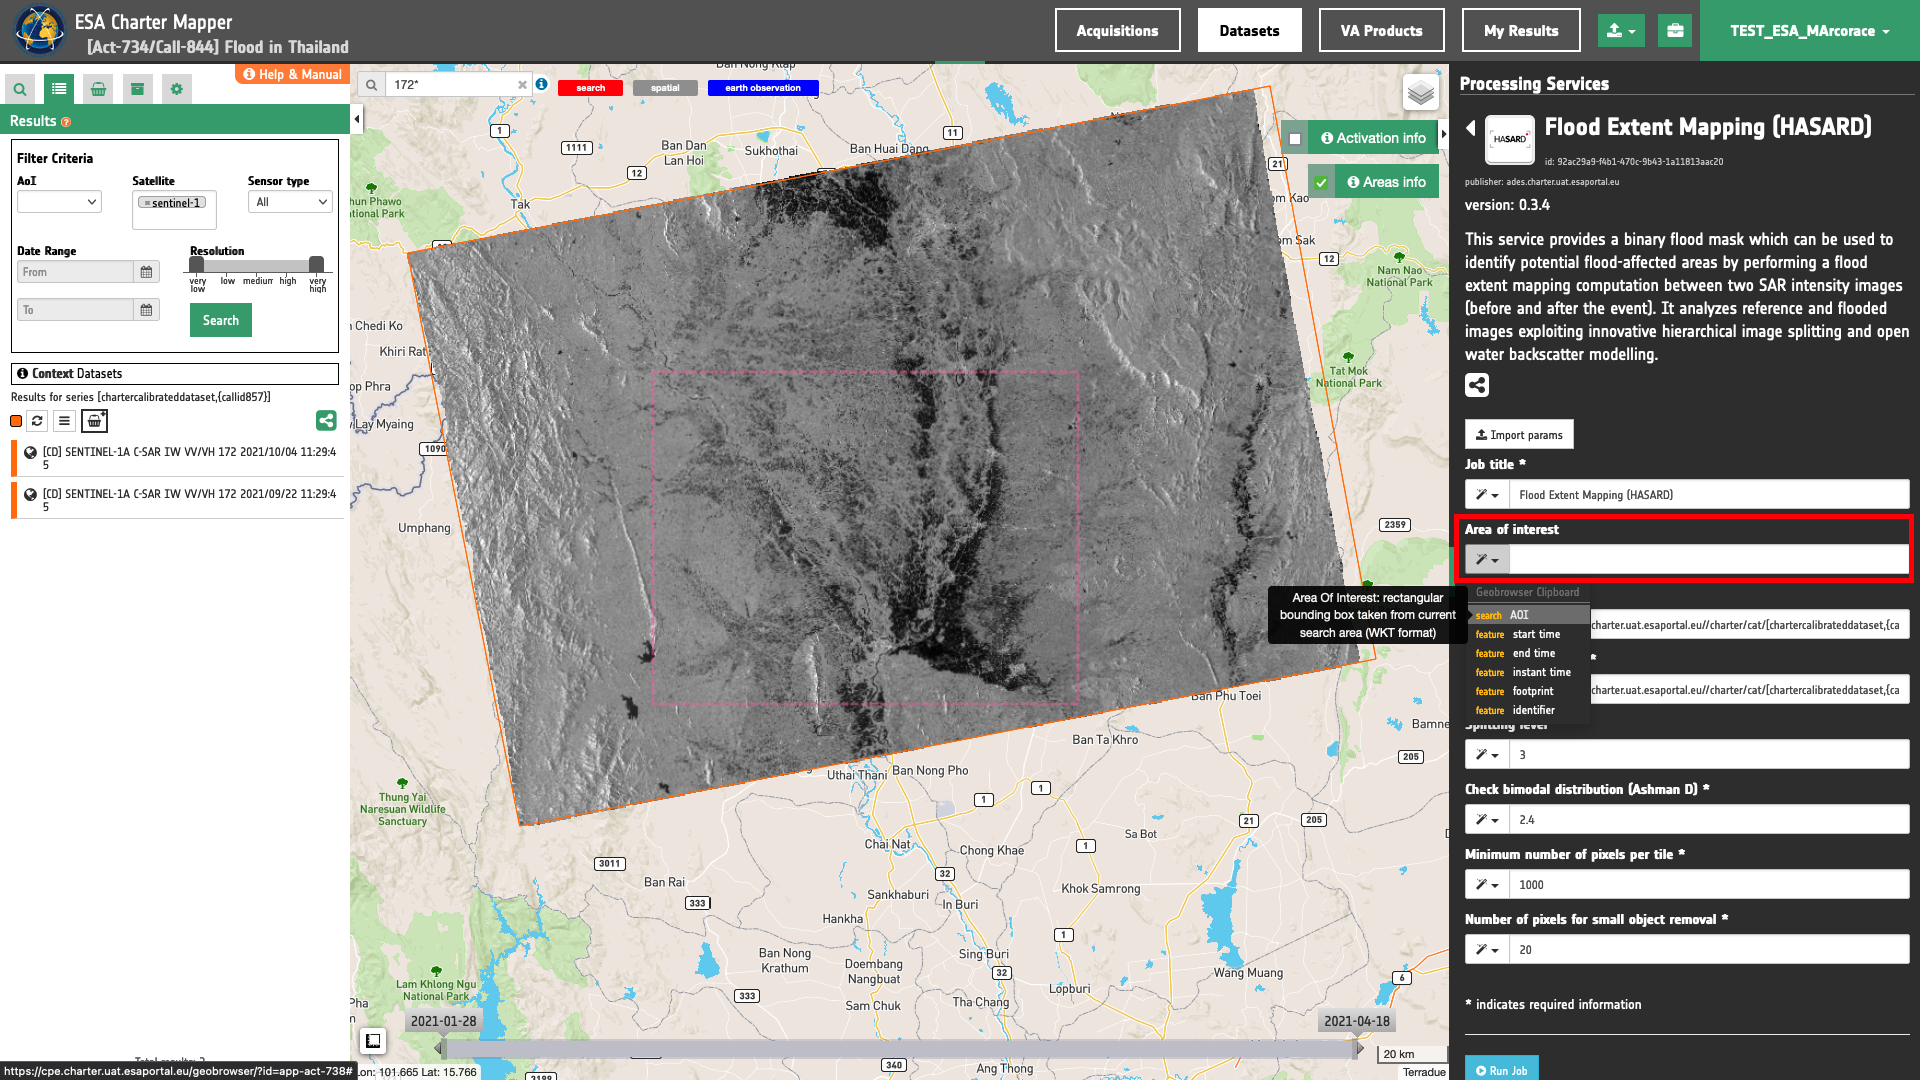
Area of interest expressed as Well-known text
The “Area of interest as Well Known Text” can be defined by using the drawn polygon defined with the area filter.
Warning
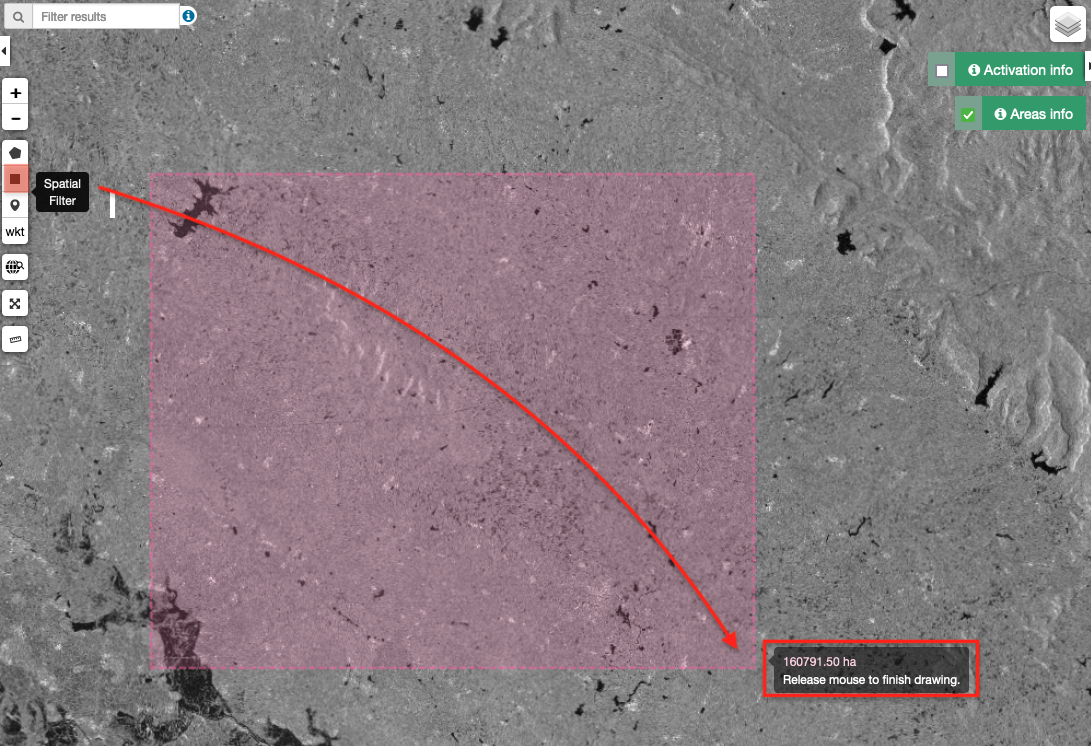
The input area of interest must have an area higher than 1600 skm or 160000 ha. If a smaller area is inserted the job will not be executed and a warning will appear.
Tip
An AOI higher than 160000 ha can be easily drawn in the ESA Charter Mapper by using the Spatial Filter button available in the Navigation and Search Toolbar in the upper left side of the map. During the drawing of the rectangular area, a popup showing the size of the current area in ha will appear in the map next to the cursor.
Tip
In the definition of “Area of interest as Well Known Text” it is possible to apply as AOI the drawn polygon defined with the area filter. To do so, click on the button in the left side of the "Area of interest expressed as Well-known text" box and select the option AOI from the list. The platform will automatically fill the parameter value with the rectangular bounding box taken the from current search area in WKT format.
Note
This parameter is optional.
Run the job
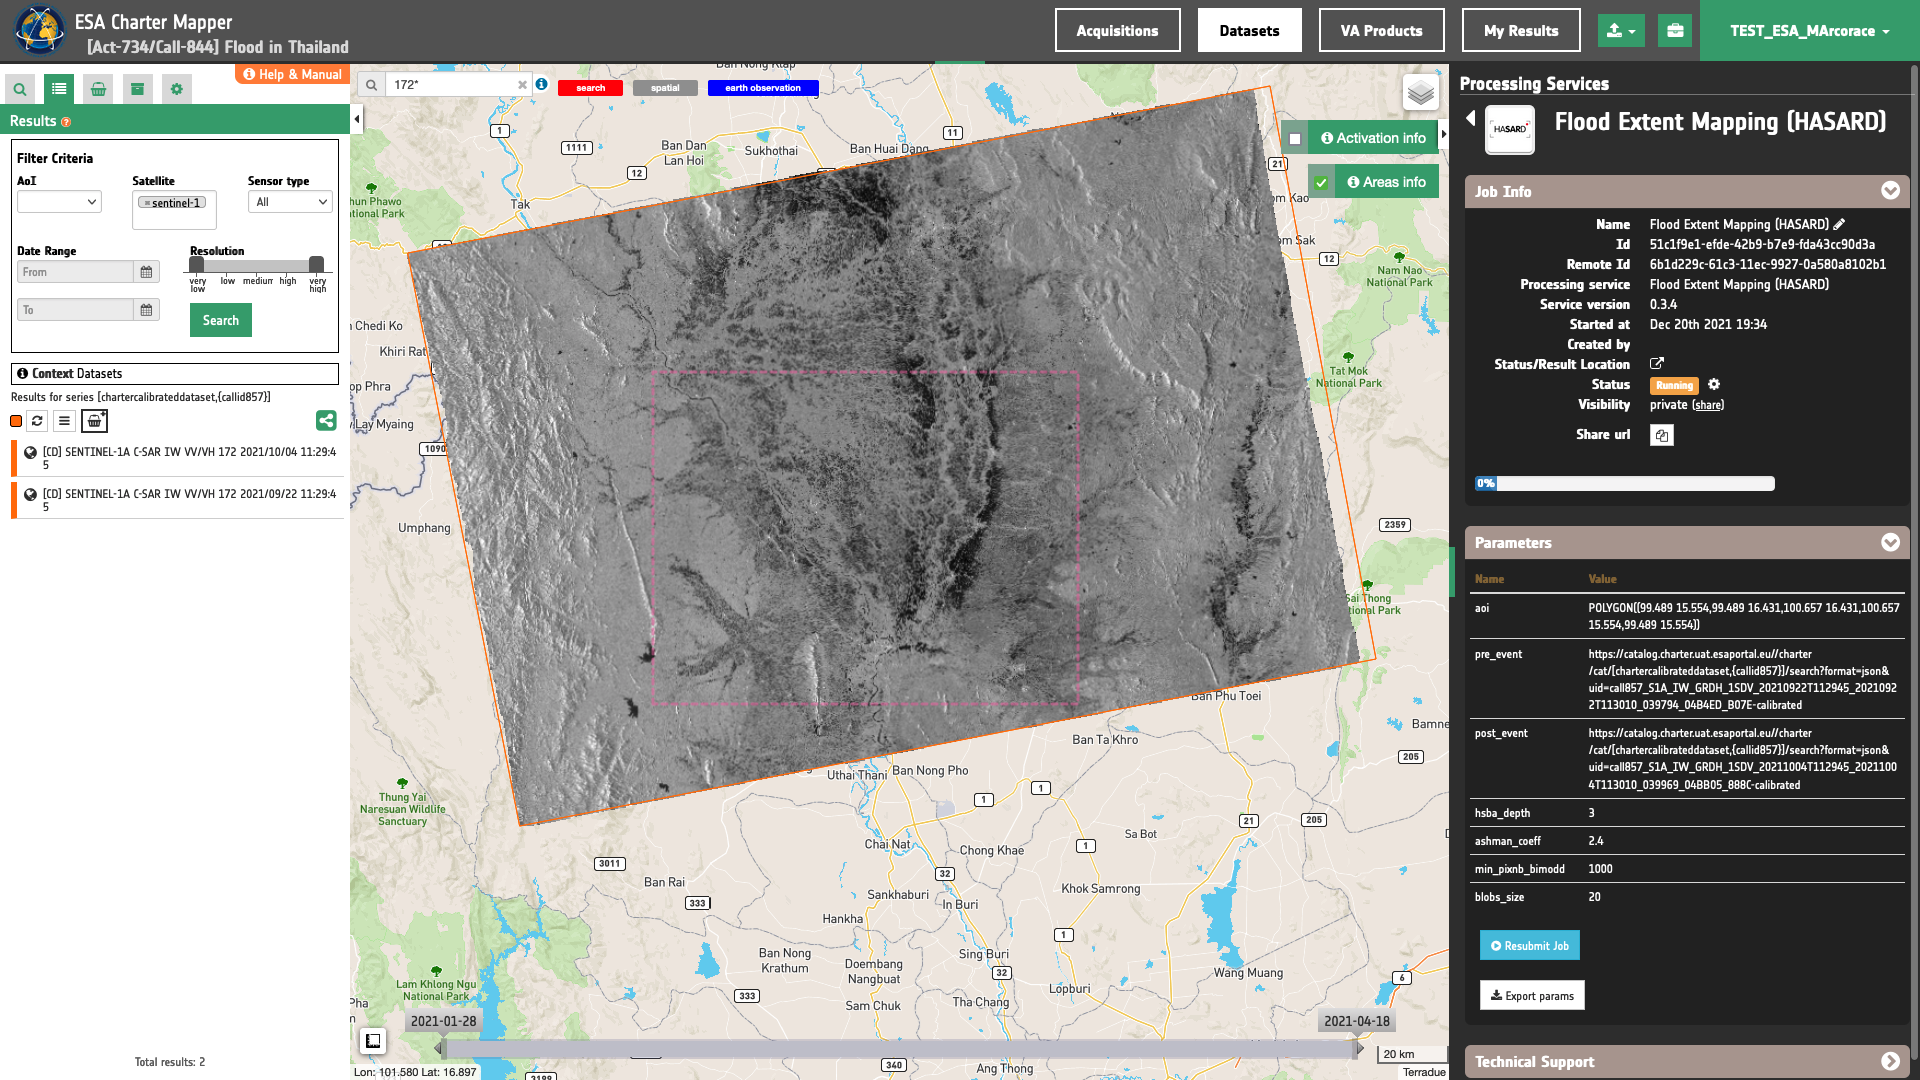
Click on the button Run Job and see the Running Job
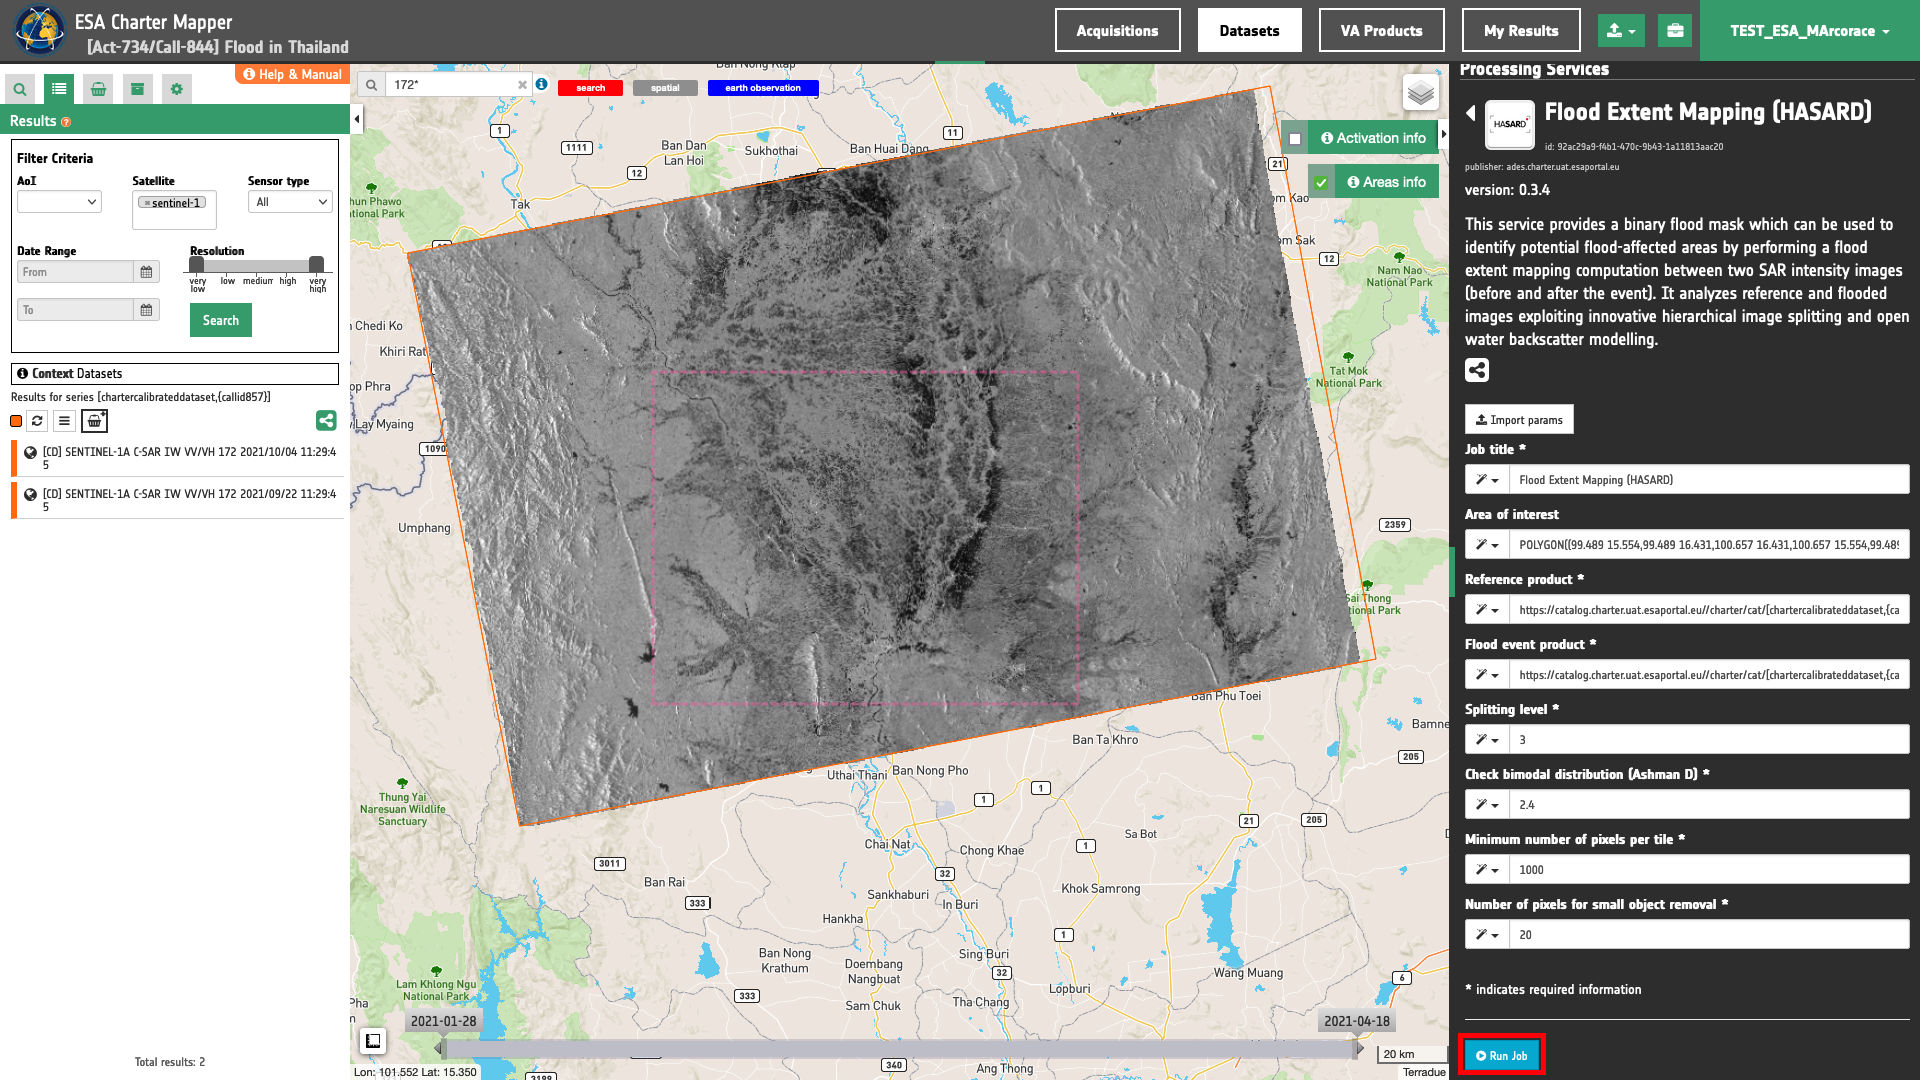
You can monitor job progress through the progress bar.
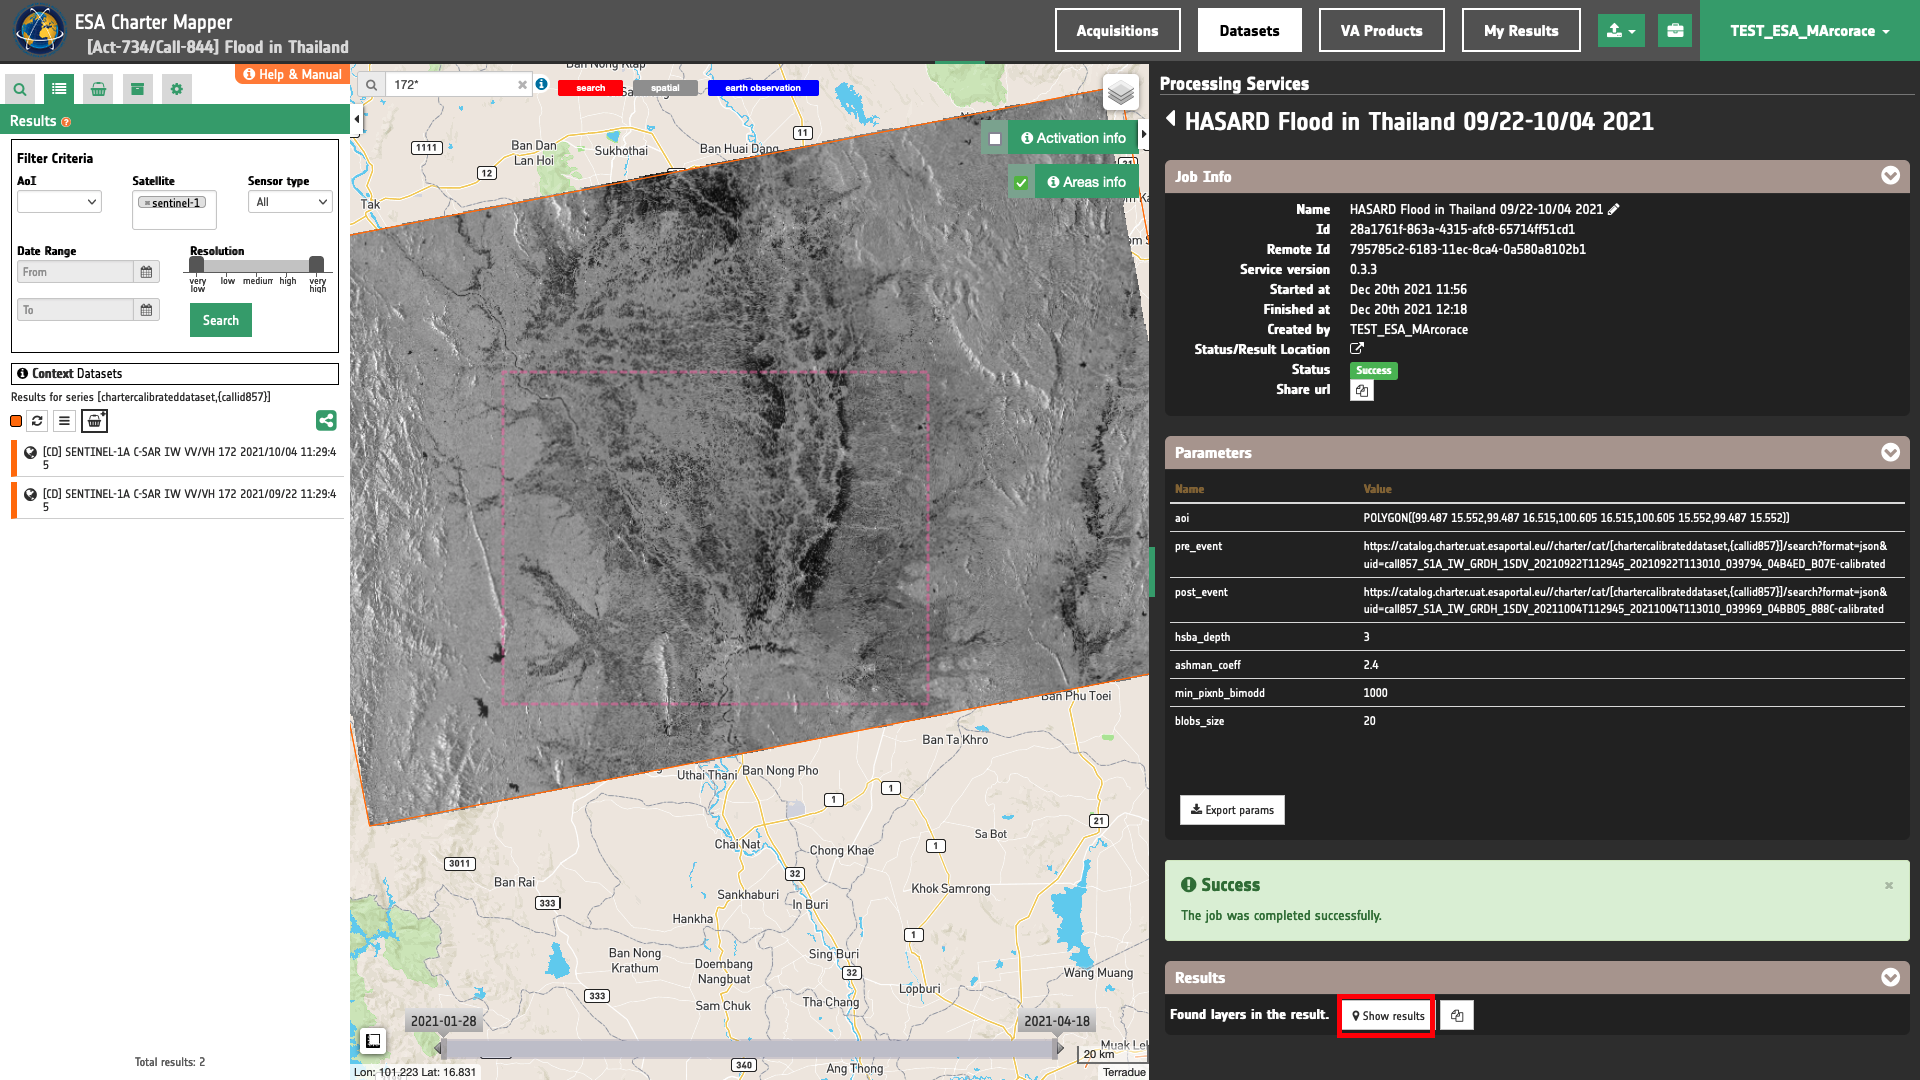
Results: download and visualization
Once the job is completed, click on the button Show results at the bottom of the processing service panel.
Tip
You can also save the parameters employed in this job by clicking on the Export params button in the right panel. This allows you to copy all your entries to the clipboard. This is meant to be used for a quick re-submission of a similar job after a fine tuning of the parameters (e.g. to add a color formula later).
Below is reported the syntax which includes all the parameters employed in this example.
{
   "aoi": "POLYGON((99.487 15.552,99.487 16.515,100.605 16.515,100.605 15.552,99.487 15.552))",
   "pre_event": "https://catalog.charter.uat.esaportal.eu//charter/cat/[chartercalibrateddataset,{callid857}]/search?format=json&uid=call857_S1A_IW_GRDH_1SDV_20210922T112945_20210922T113010_039794_04B4ED_B07E-calibrated",
   "post_event": "https://catalog.charter.uat.esaportal.eu//charter/cat/[chartercalibrateddataset,{callid857}]/search?format=json&uid=call857_S1A_IW_GRDH_1SDV_20211004T112945_20211004T113010_039969_04BB05_888C-calibrated",
   "hsba_depth": "3",
   "ashman_coeff": "2.4",
   "min_pixnb_bimodd": "1000",
   "blobs_size": "20"
}
Visualization
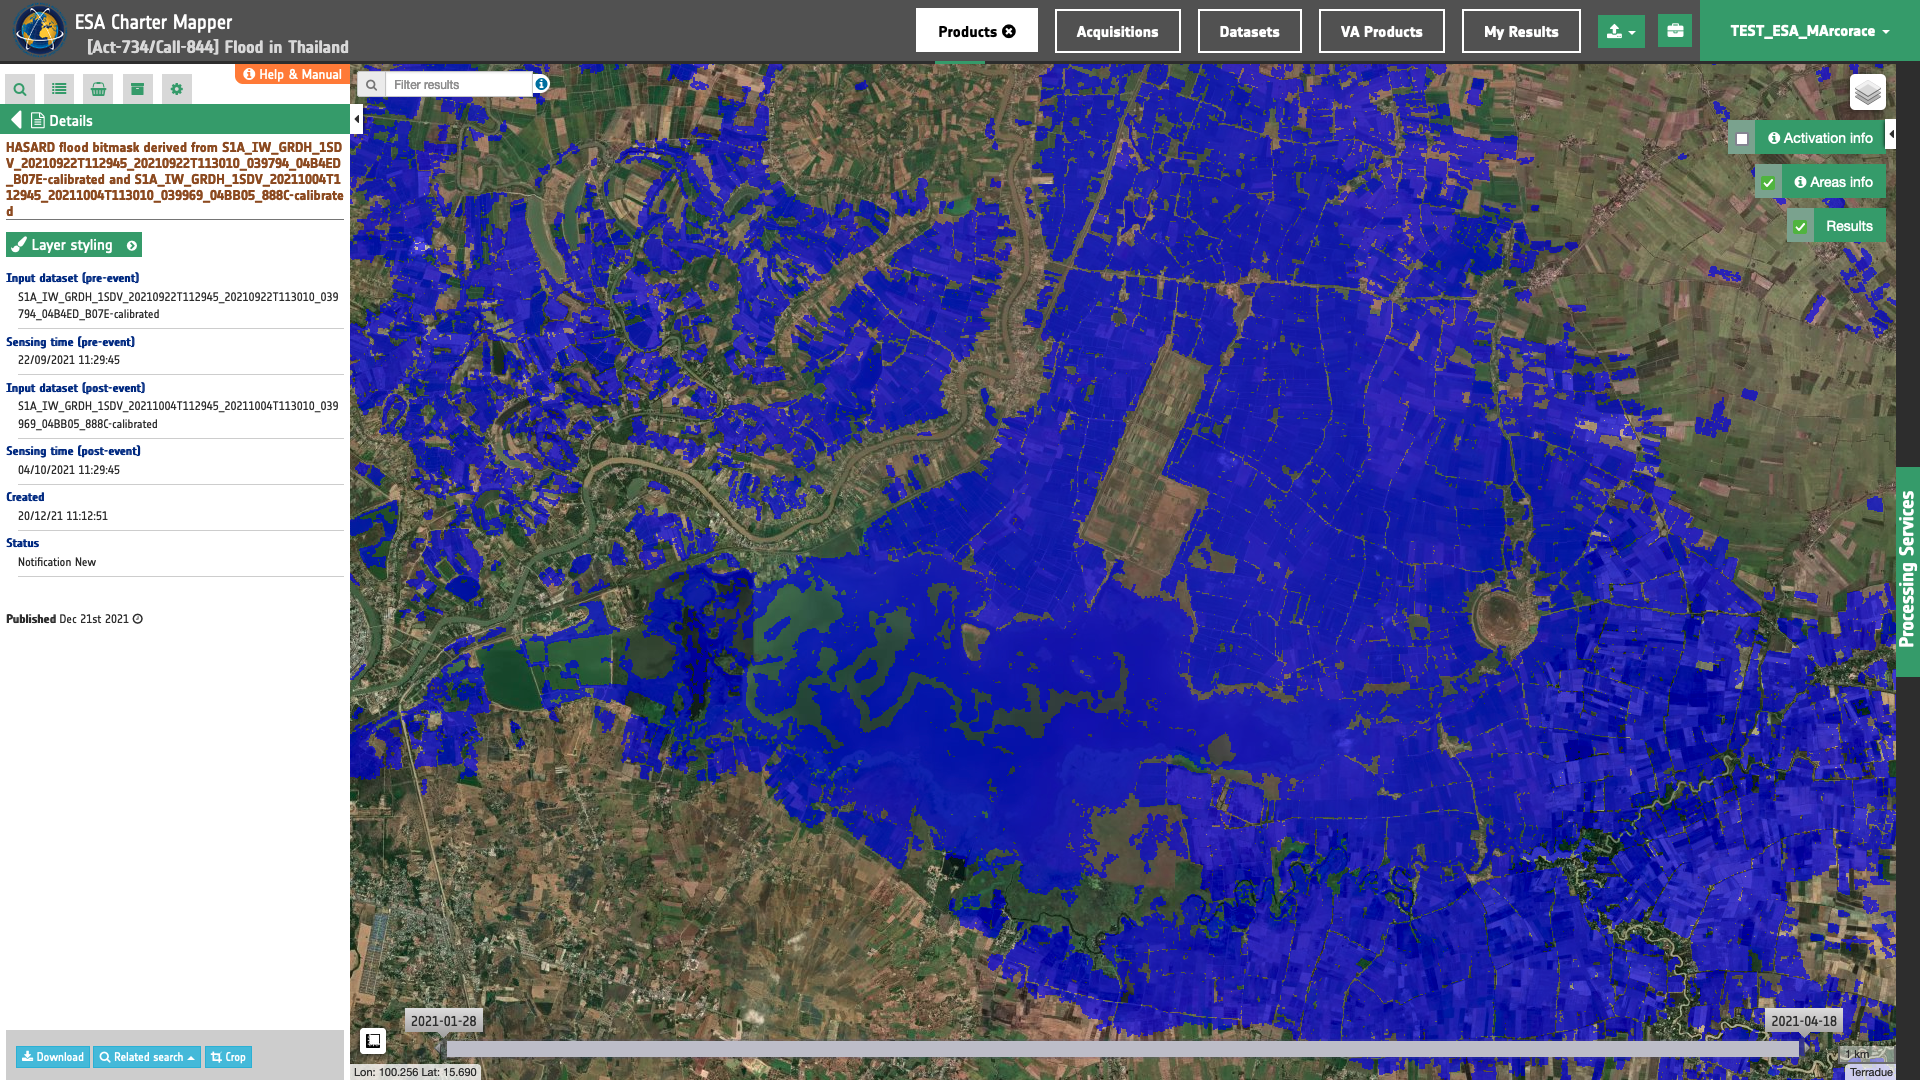
See the result on the map. The preview appears within the area defined in the spatial filter.
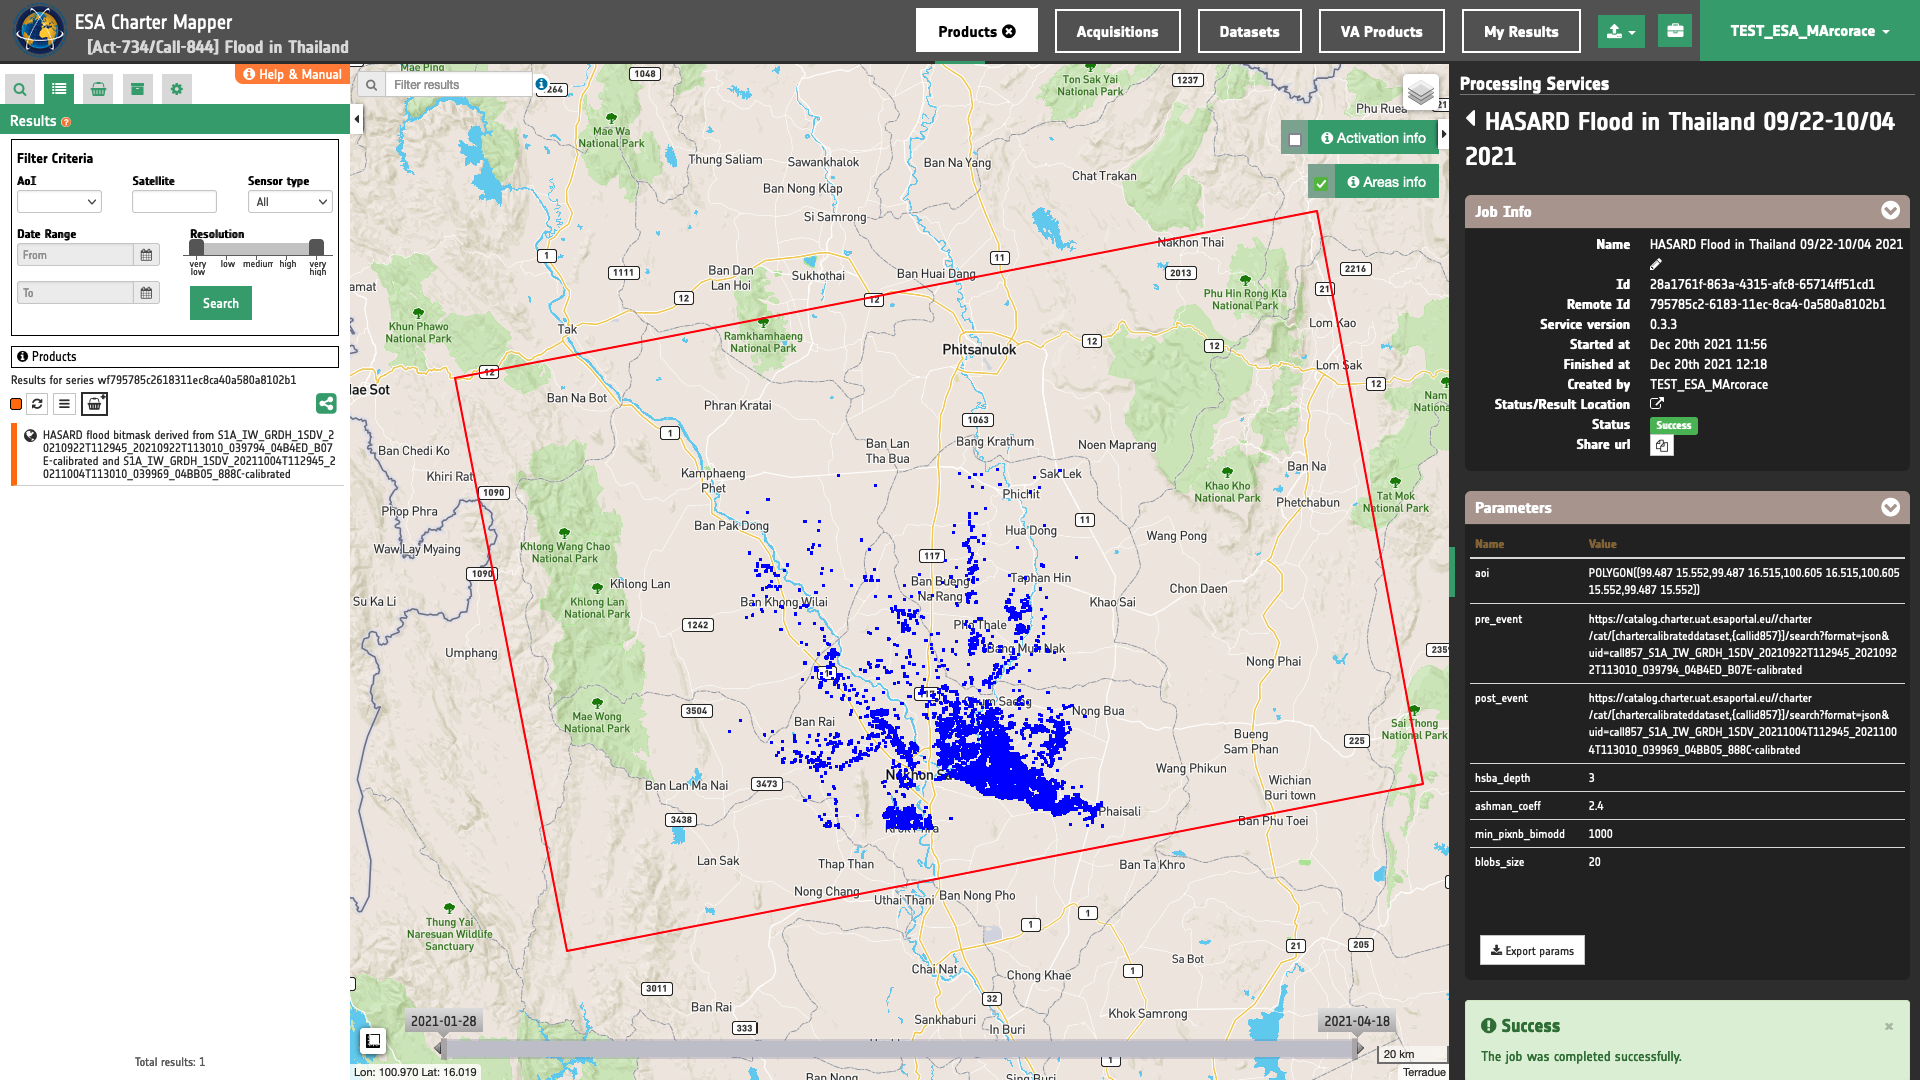
To get more information about the product just click on the preview in the map, a bubble showing the name of the layer “HASARD flood bitmask derived from S1A_IW_GRDH_1SDV_20210922T112945_20210922T113010_039794_04B4ED_B07E-calibrated and S1A_IW_GRDH_1SDV_20211004T112945_20211004T113010_039969_04BB05_888C-calibrated” will appear and then click on the Show details button.
Tip
To quickly access Product Details double click on the layer from the Results list.
In the left panel of the interface, the details of Job Result will appear with Product metadata. Furthermore by clicking on Layer styling you can also access to the View options. In here it is possible to see histogram/s of the Product which is visible in the map, set color formula, change Filters (e.g. Brightness, Opacity).
Tip
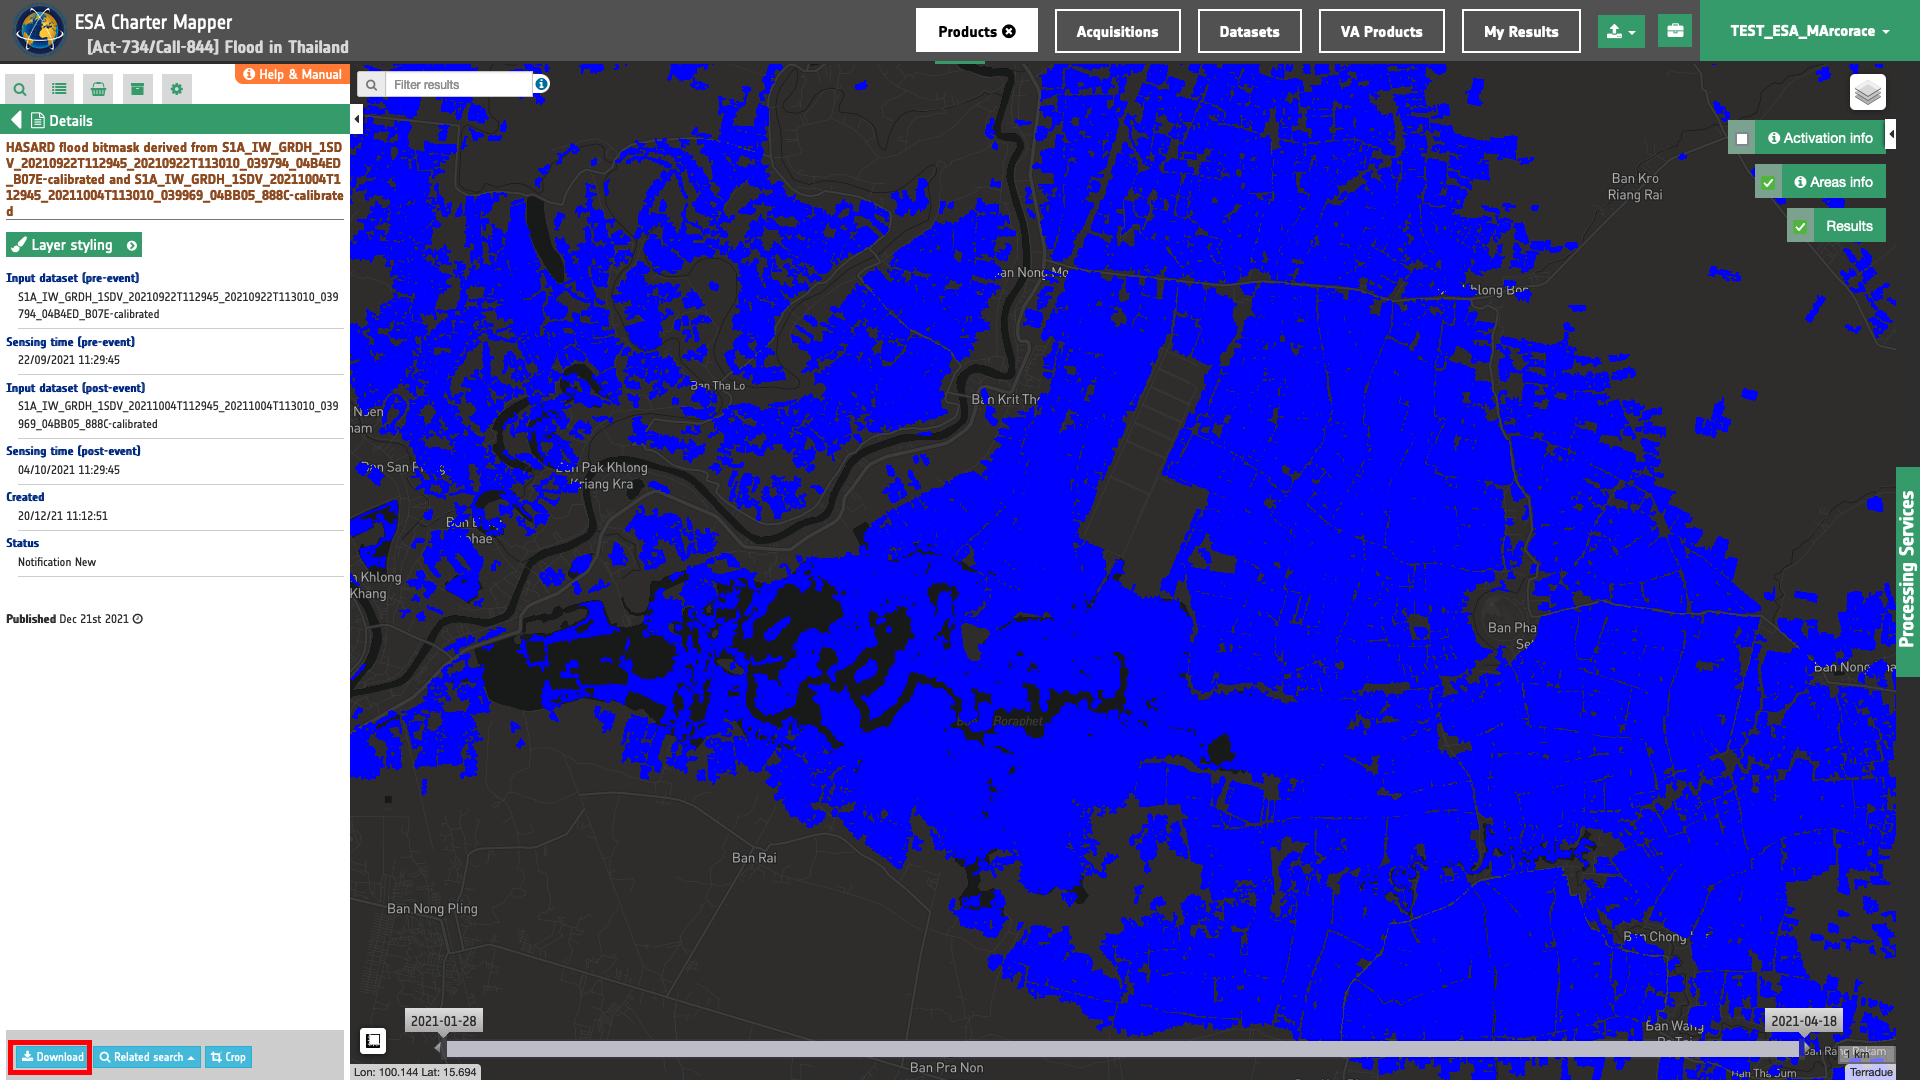
To visually compare the product overview with the underlying base layer (e.g. Natural Earth or Dark map) you can set the Opacity filter under View options as 60%.
Download
In the HASARD Dual Image service the following files are produced:
- flood-mask: single-band geophysical asset as Flood bitmask (1=Flooded, 0=Not-flooded) as single band GeoTIFF in COG format,
- overview-flood-mask: multi-band asset as RGBA from Flood bitmask in the blue channel including transparency as multi band GeoTIFF in COG format,
- pre-s0_db_c_vv: single-band geophysical asset
s0_db_c_vvproduct from reference image as single band GeoTIFF in COG format, - post-s0_db_c_vv: single-band geophysical asset
s0_db_c_vvproduct from flood image as single band GeoTIFF in COG format, - overview-vv-pre: multi-band asset as RGBA in grayscale from reference image as multi band GeoTIFF in COG format,
- overview-vv-post: multi-band asset as RGBA in grayscale from flood image as multi band GeoTIFF in COG format.
These products can be downloaded by clicking on the Download button located at the bottom of the Product Details tab in the left panel.
-
LIST, An automatic satellite image processing tool for flood hazard prevention on a global scale, available at www.list.lu. ↩
-
UNOSAT, Satellite detected flooding in the central region of Thailand, Delineation Map, available at https://disasterscharter.org. ↩
-
UNITAR-UNOSAT, Rapid Mapping, available at www.unitar.org. ↩
-
International Charter Space and Major Disasters, Charter Activations, Flood in Thailand, 28 September 2021, available at https://disasterscharter.org. ↩