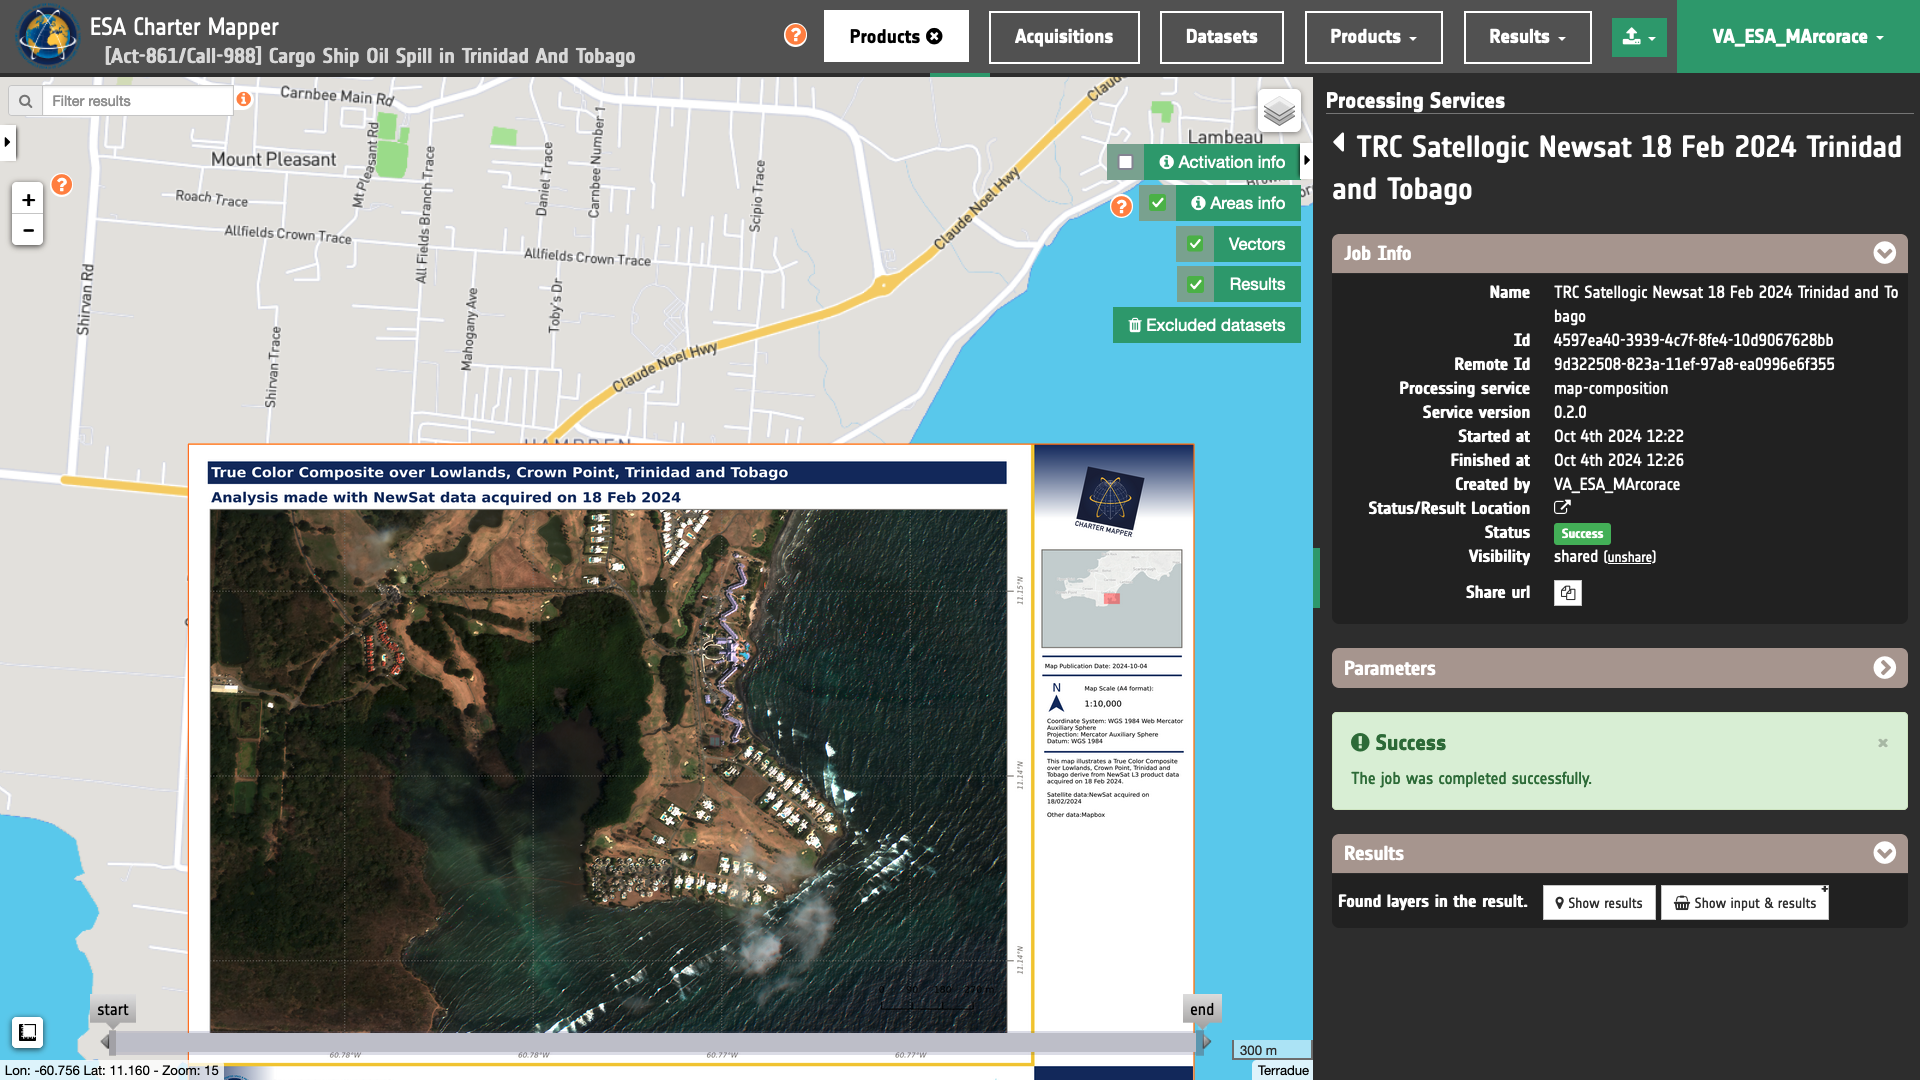
Map composition
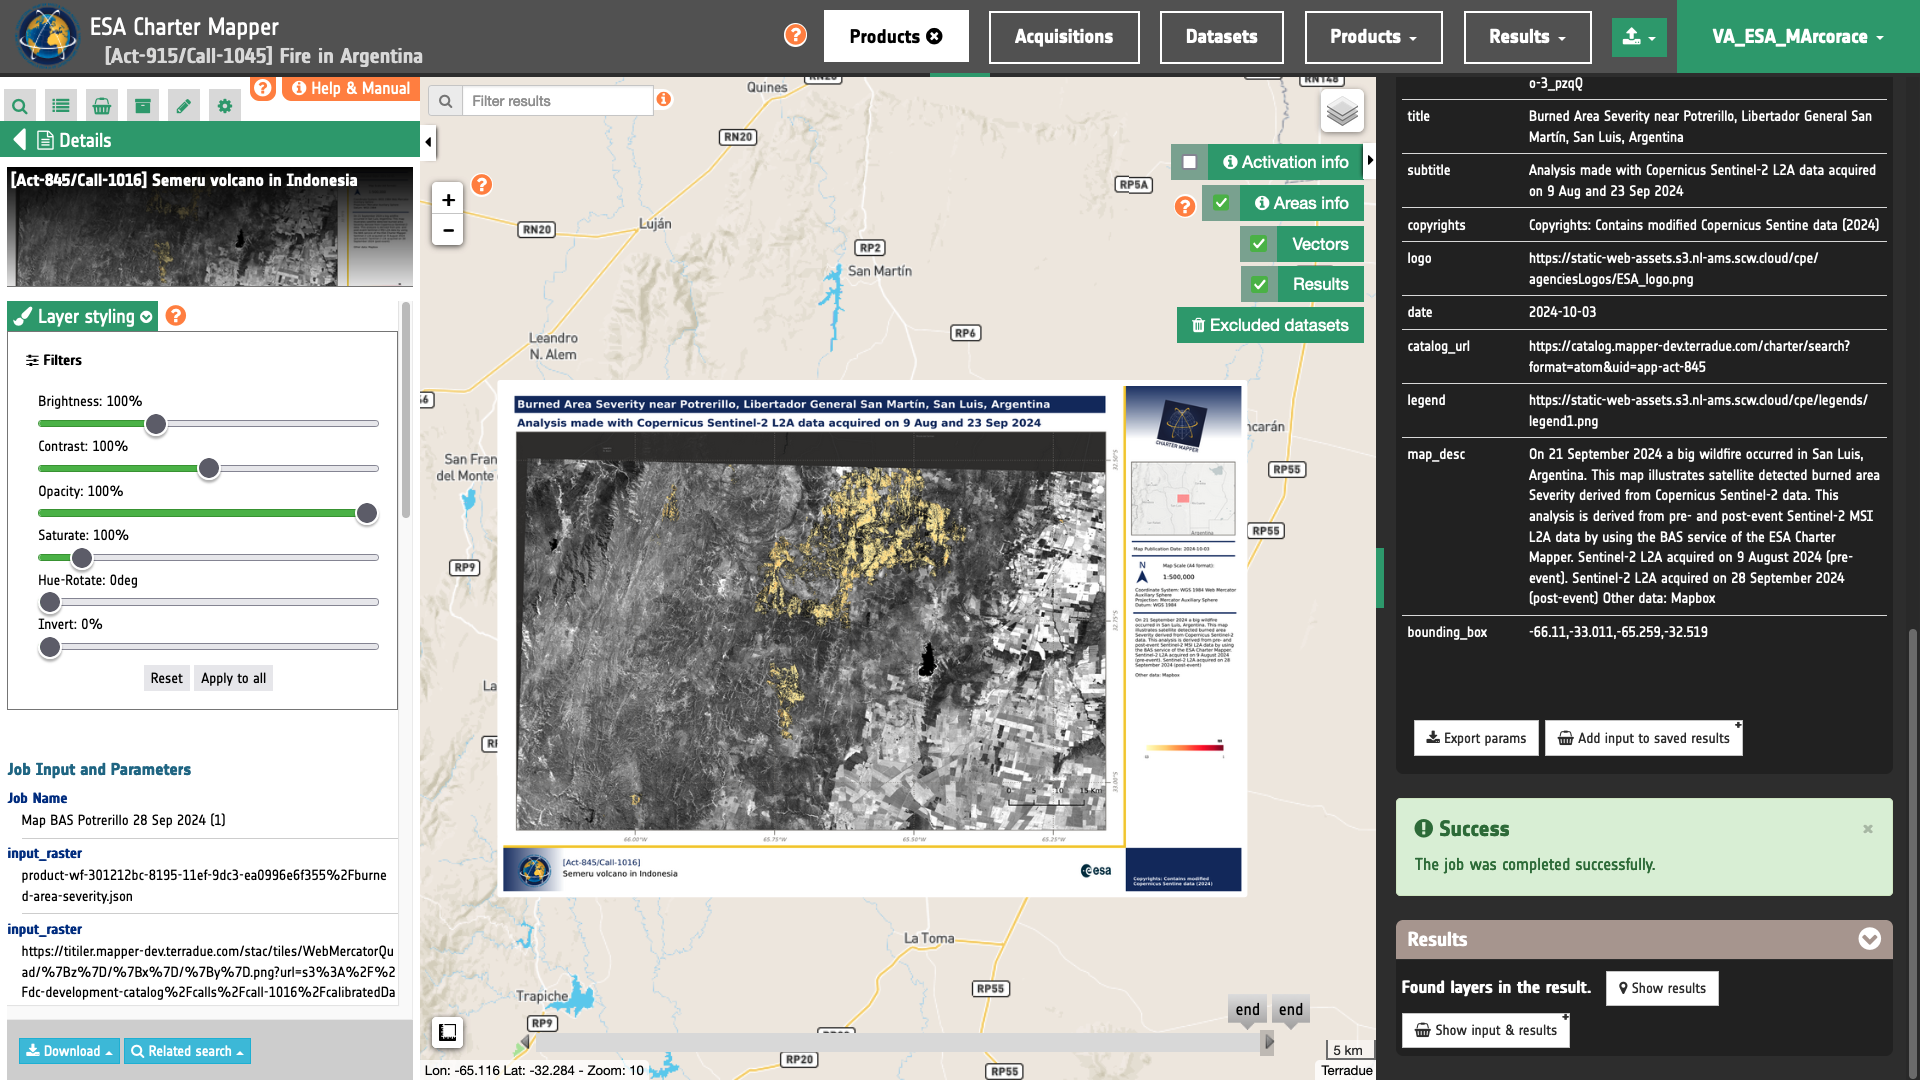
The Map composition tool allows the end-to-end production of a VAP fully online within the platform, without the need to download any data or GIS software. Thanks to an intuitive map composition interface, PMs and VAs users can automatically generate a cartographic product based on a predefined map template that includes main and locator maps, legend, scale bar, north arrow, logos, event description, acquisition dates, copyrights, disclaimers, credits.
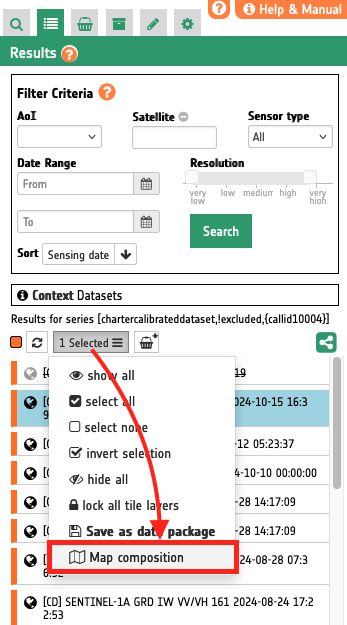
Access the Map Composition panel
The Map Composition panel is available in the left panel of the interface. This function can be used when 1 up to 4 features are selected. A dedicated button ‘Map Composition’ appears under the Selected button at the top of the list. Selectable features in the left panel are either from the Results or Features Basket tabs.
Map template description
A portrait landscape has been designed in the A4 format to satisfy the need of automatically generating cartographic products from map tiles taken from the ESA Charter Mapper. In total the template is composed of 14 items as described in the below schema.
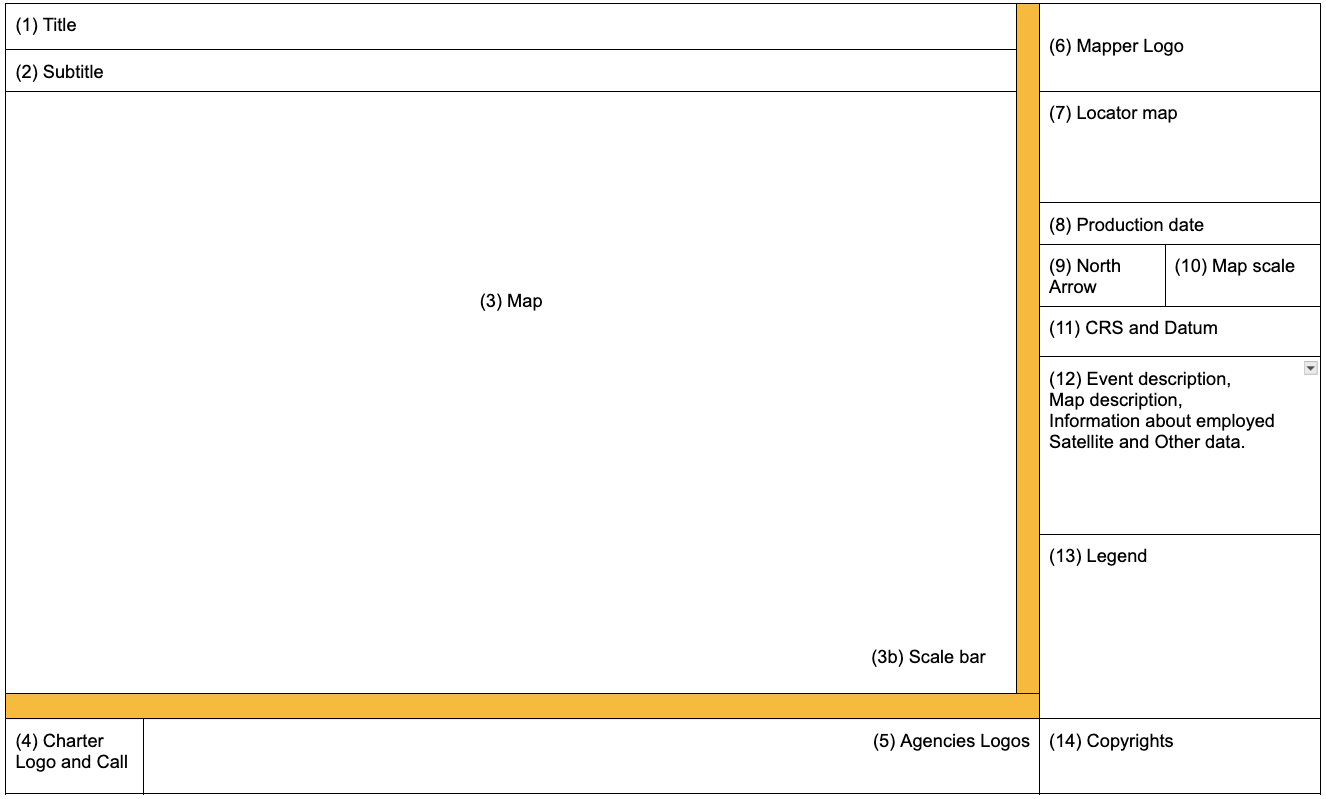
The upper right part of the cartographic product shows the title and the subtitle. All the other information required to describe the product is located on the left (locator map, map scale, map description, legend, etc.). The map is located in the center of the template where the grid is showing ticks with coordinates in decimal degrees only in the bottom and left borders of the frame. Finally in the bottom of the cartographic product are located the charter logo, other logos from PM/VAs and space agencies, and a text for the copyrights.
Main Map
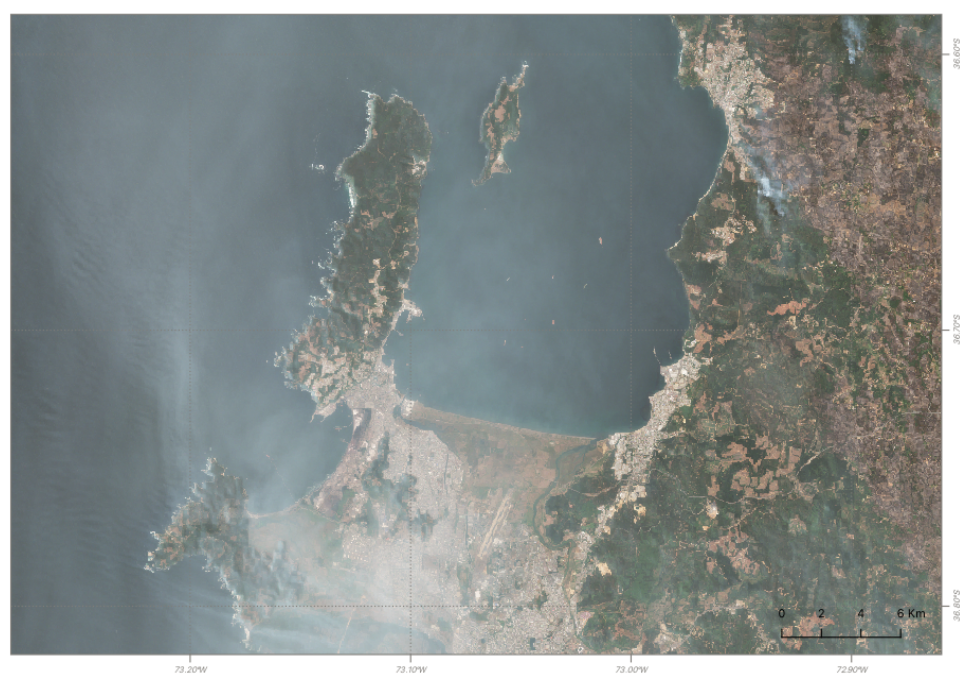
In the main map (item 3) is shown the result from the map composition over a grid from a base layer and one or more superimposed layers chosen by the user.
Set layers ordering
At the opening of the Map Composition the function lists the features selected. At this stage the user can still change the view options of each feature, and can define in which order they shall be used when drawing the map in GIS.
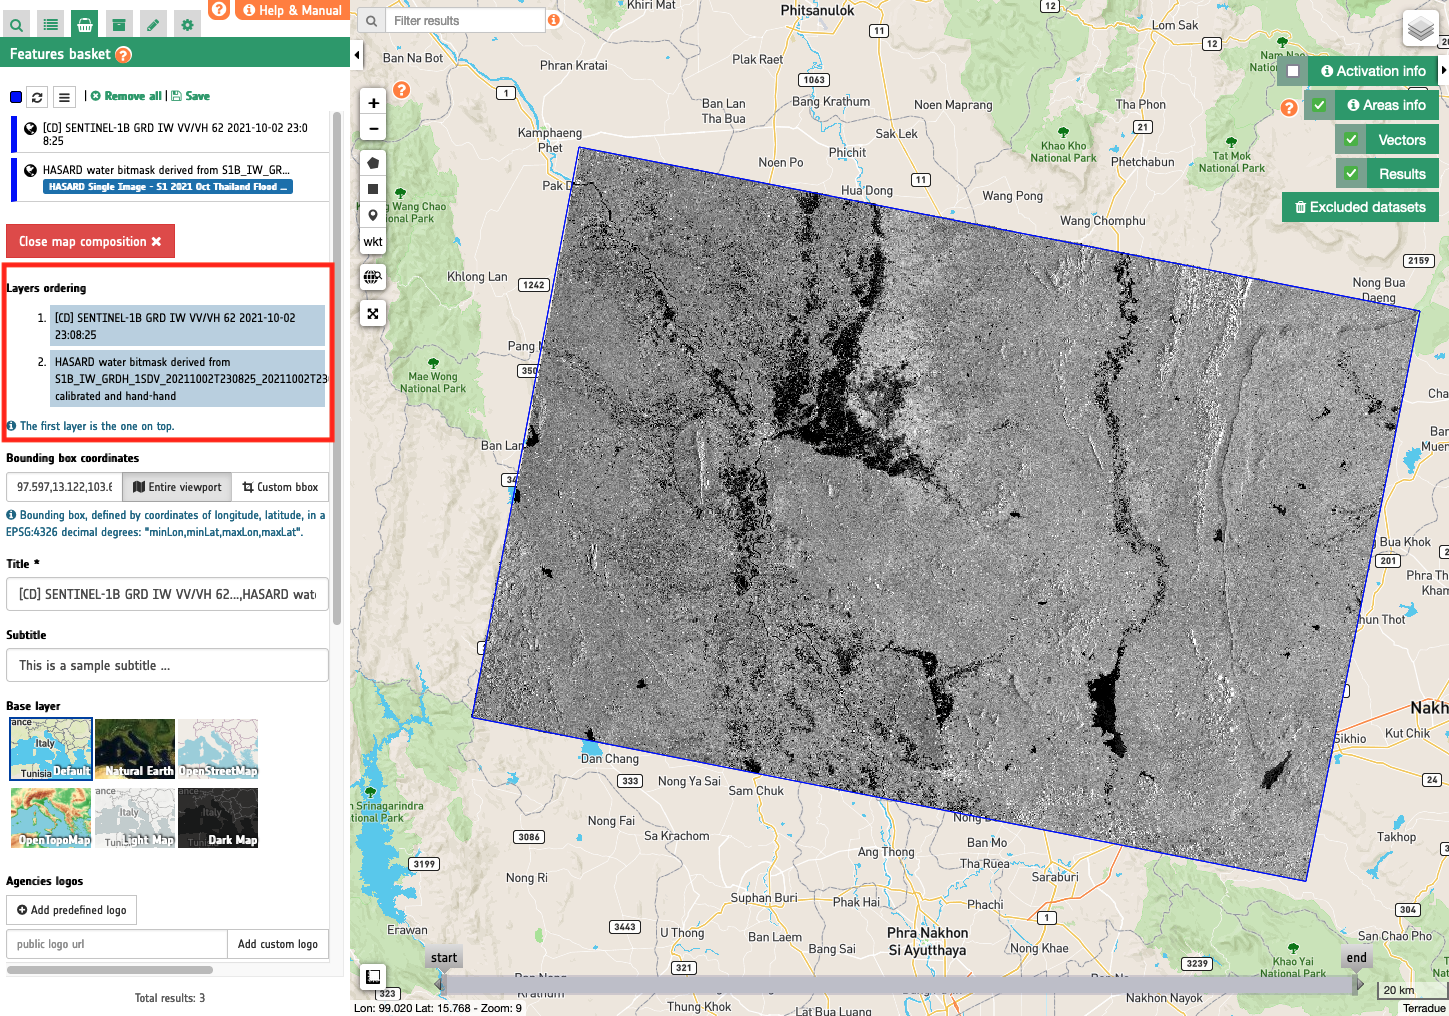
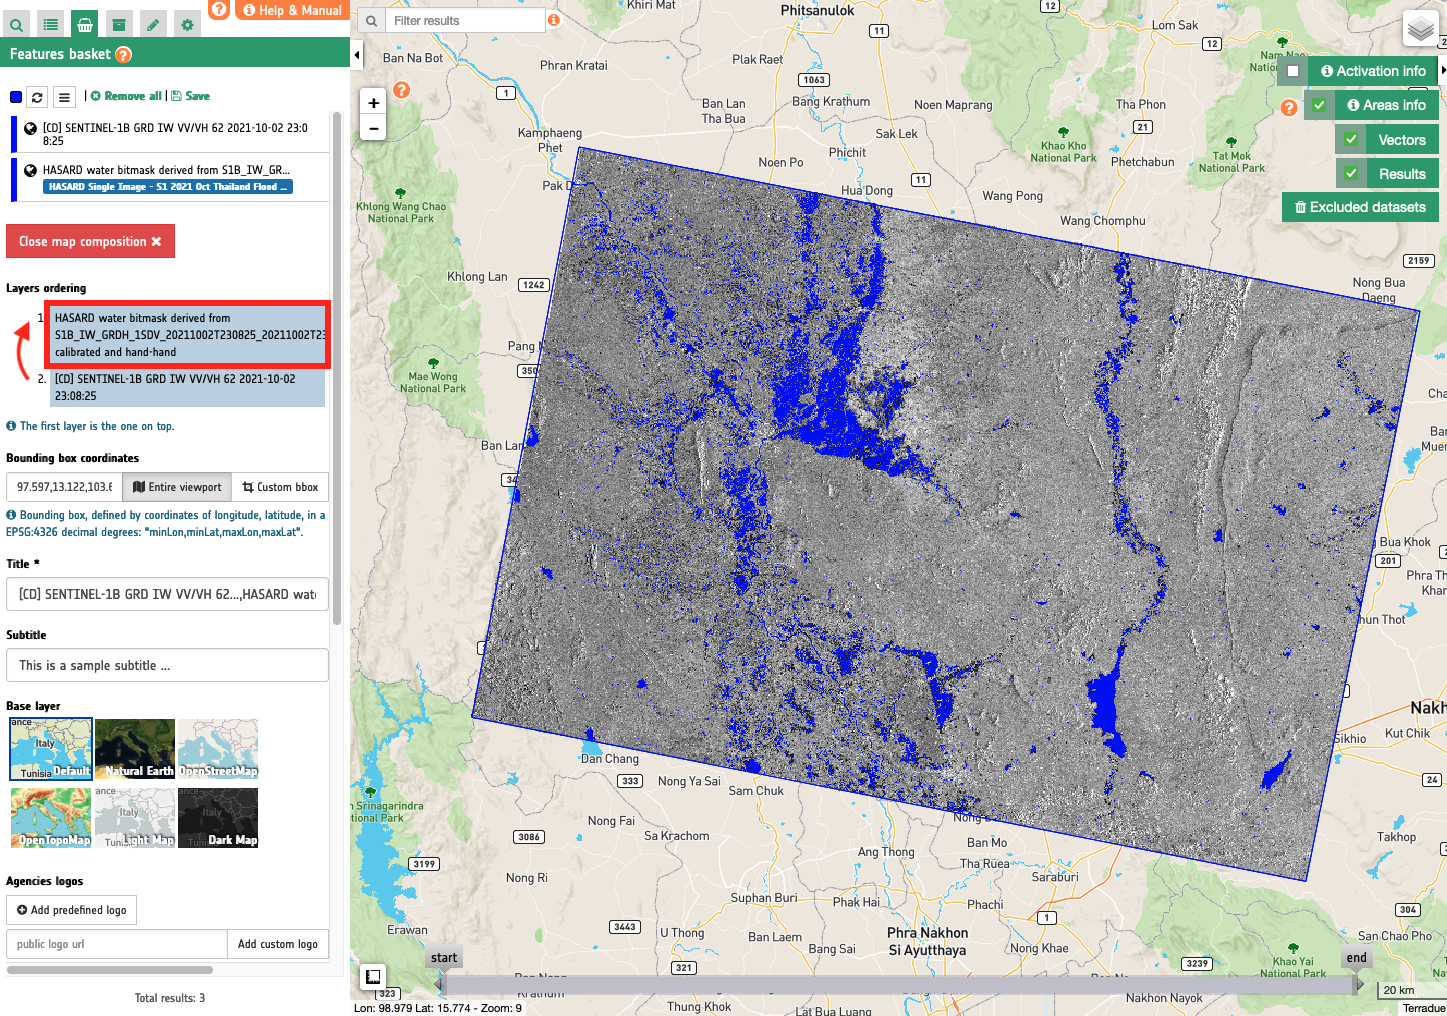
In GIS software map canvas are drawn following the order of active layers. The higher a layer is in the list, the higher (hence, more visible) it'll be in the output map product. To set the order of layers the user with a simple drag can simply move up or down each feature in the list.
Define bounding box coordinates
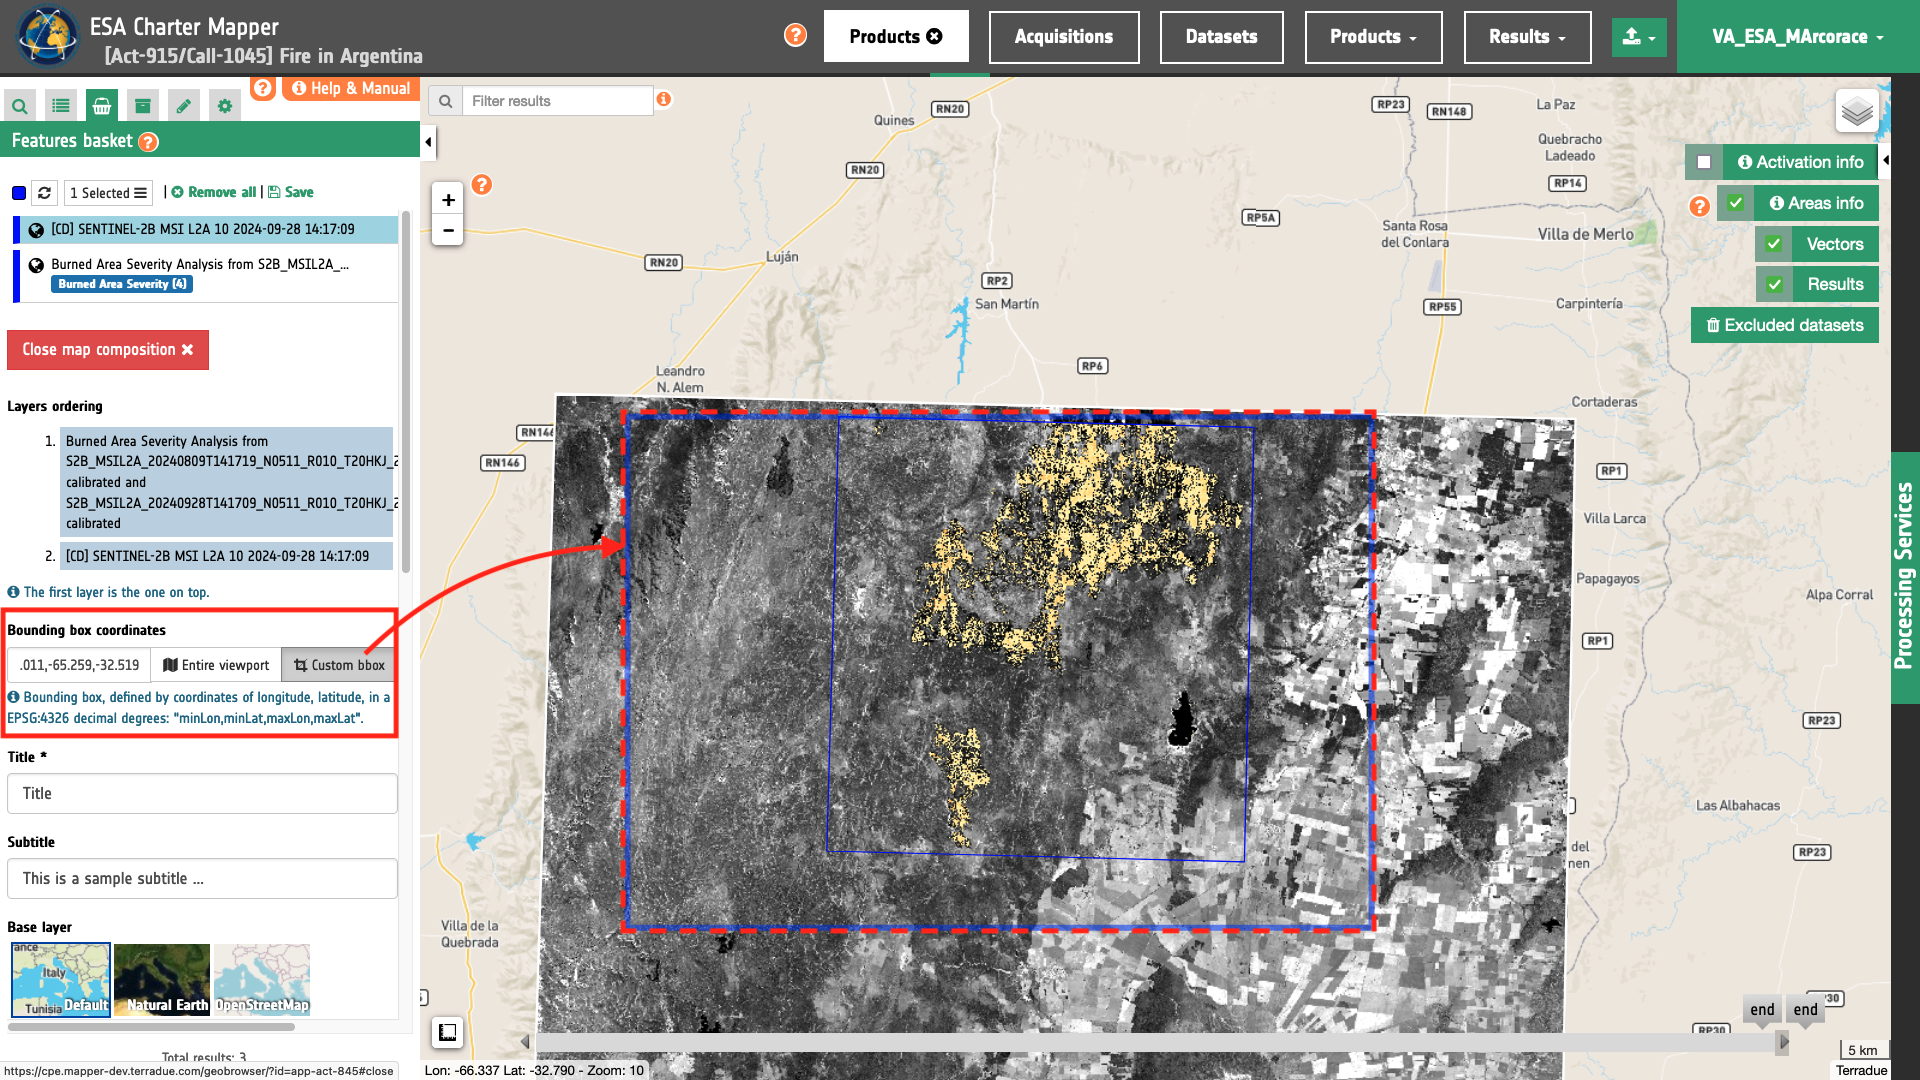
The scale of the Main Map is computed based on the area defined by the user and is centered on its centroid. To define an area the user must define its bounding box coordinates.
This can be done by clicking on the Custom bbox button and drawing an area directly on the map. When drawing a rectangular area on the map the user is forced to follow a predefined length-to-width ratio in line with the template.
Note
The user currently cannot employ another length-to-width ratio than the one set for the landscape template.
The resulting scale after the zoom to the AOI is rounded to the nearest scale factor (e.g. if the resulting scale is 1:4756 the scale is rounded to the closest pre-defined map scale of 1:5000). The grid is pre-configured with annotated ticks in the left/bottom borders of the frame.
Superimposed to the main map on the bottom right corner is shown the scale bar. Scale bar size and units depend on the scale of the map. By default the scale bar is showing units in km. If the selected pre-defined scale for the map is minor than 1:10000 the scale bar has units in meters.
Note
The user cannot edit the grid and the scale bar of the main map. These are automatically generated based on the defined bounding box.
Choose base layer
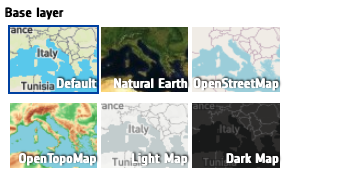
After the definition of layers and bounding box the user must also choose which baselayer shall be used in the map compositions. Options are the following:
-
Default
-
Natural Earth
-
OpenStreetMap
-
OpenTopoMap
-
Light Map
-
Dark Map
Title
Item 1 of the map template is dedicated to the title of the cartographic product and is located in the upper left part of the template. The user can insert a text with a maximum number of characters of 86 characters including spaces.
Subtitle
Item 2 of the template is located just under the Item 1 and is about the subtitle of the cartographic product. The user can insert a text with a maximum number of characters of 86 characters including spaces.
Charter Mapper Logo
In the top left of the template is shown the Charter Mapper logo (item 6 of the template).
Note
The user cannot edit the contents for this item.
Locator Map
Just above the Charter Mapper logo is placed the locator map (item 7) which shows in red the bounding box of the Main Map overlayed to a global grayscale map. Its scale is set to 50 times more the scale of the Main map.
Note
The locator map is automatically generated and the user cannot edit it.
Production Date
During the generation of the map the item 8 of the template provides a text with the printing of a now date. If needed, the user can insert a different map production date using the dedicated field.
North Arrow
Item 9 shows the north arrow. No rotation of the frame is foreseen and thus layers will be automatically oriented to the north. As a result, the north arrow is a predefined image.
Map Scale
Item 10 of the template reports the map scale of the Main Map (see Item 3).
Geographic information
Item 11 provides description of the pre-defined CRS (WGS 1984 Web Mercator).
Map description
Item 12 is dedicated to the map description. The length of the text to be hosted by this item is not known a priori cause it depends on the number of characters inserted by the user for:
-
Event description
-
Map description
-
Information about satellite imagery
-
Information about other data
Warning
The description of the event is automatically retrieved from COS-2. In case a long description is given the text is cutted at 400 characters.
This parameter is automatically filled with an extracted text from the event description of Charter activation and a suggested structure for the map description.
This map illustrates...

Satellite data:

Satellite-# acquired on DD/MM/YYYY (Pre event #), Satellite-# acquired on DD/MM/YYYY (Post event #)

Other data:

University of Tokyo, DLR, WorldPop, JRC, Copernicus, ESA, OpenStreetMap, Mapbox
Warning
The description of the event is automatically retrieved from COS-2. In case a long description is given the text is cutted at 400 characters.
Warning
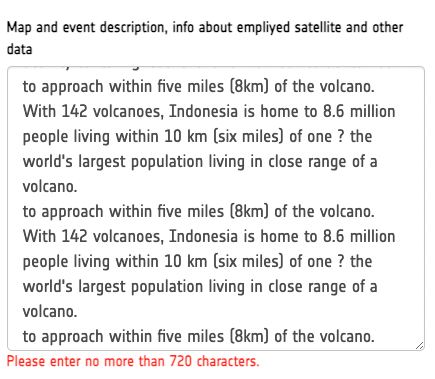
The Map Description text box has a limit of 720 characters. It can increase according to the number of legends to be included in the panel.
Legend
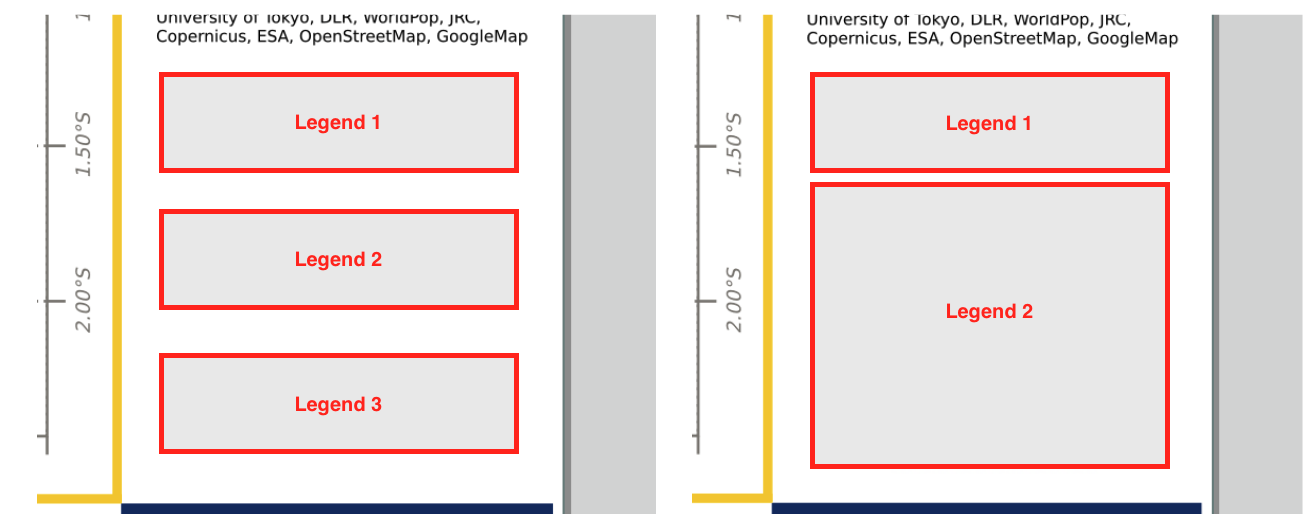
In the left panel of the map, the lower space is dedicated to the legend (Item 13). This space is organized to allocate at maximum 3 rectangular legends or 1 rectangular legend and a square one. Item 13 is optional because the legend is not always needed (e.g. a Map showing an RGB composite from Pleiades imagery). When at least one legend is required the user will be able to select one from a pre-defined list of legends or by uploading via a direct URL.
To fill in this space 3 possible options are foreseen:
-
When 3 rectangular legends, or 1 rectangular legend and a square one, the Map Description text box remains to 720 characters.
-
A single legend is given and the dedicated space for Item 13 is partially filled. In such a situation the Item 12 Map description has then more space for more characters. Thus, If only one legend is given the limit in the Map Description text box increases to 860 characters.
-
When no legend is given and Item 13 is therefore empty. In such a situation the Item 12 Map description has more space to allocate more characters. Therefore the limit in the Map Description text box becomes 1200 characters.
Default legends to be added in apps
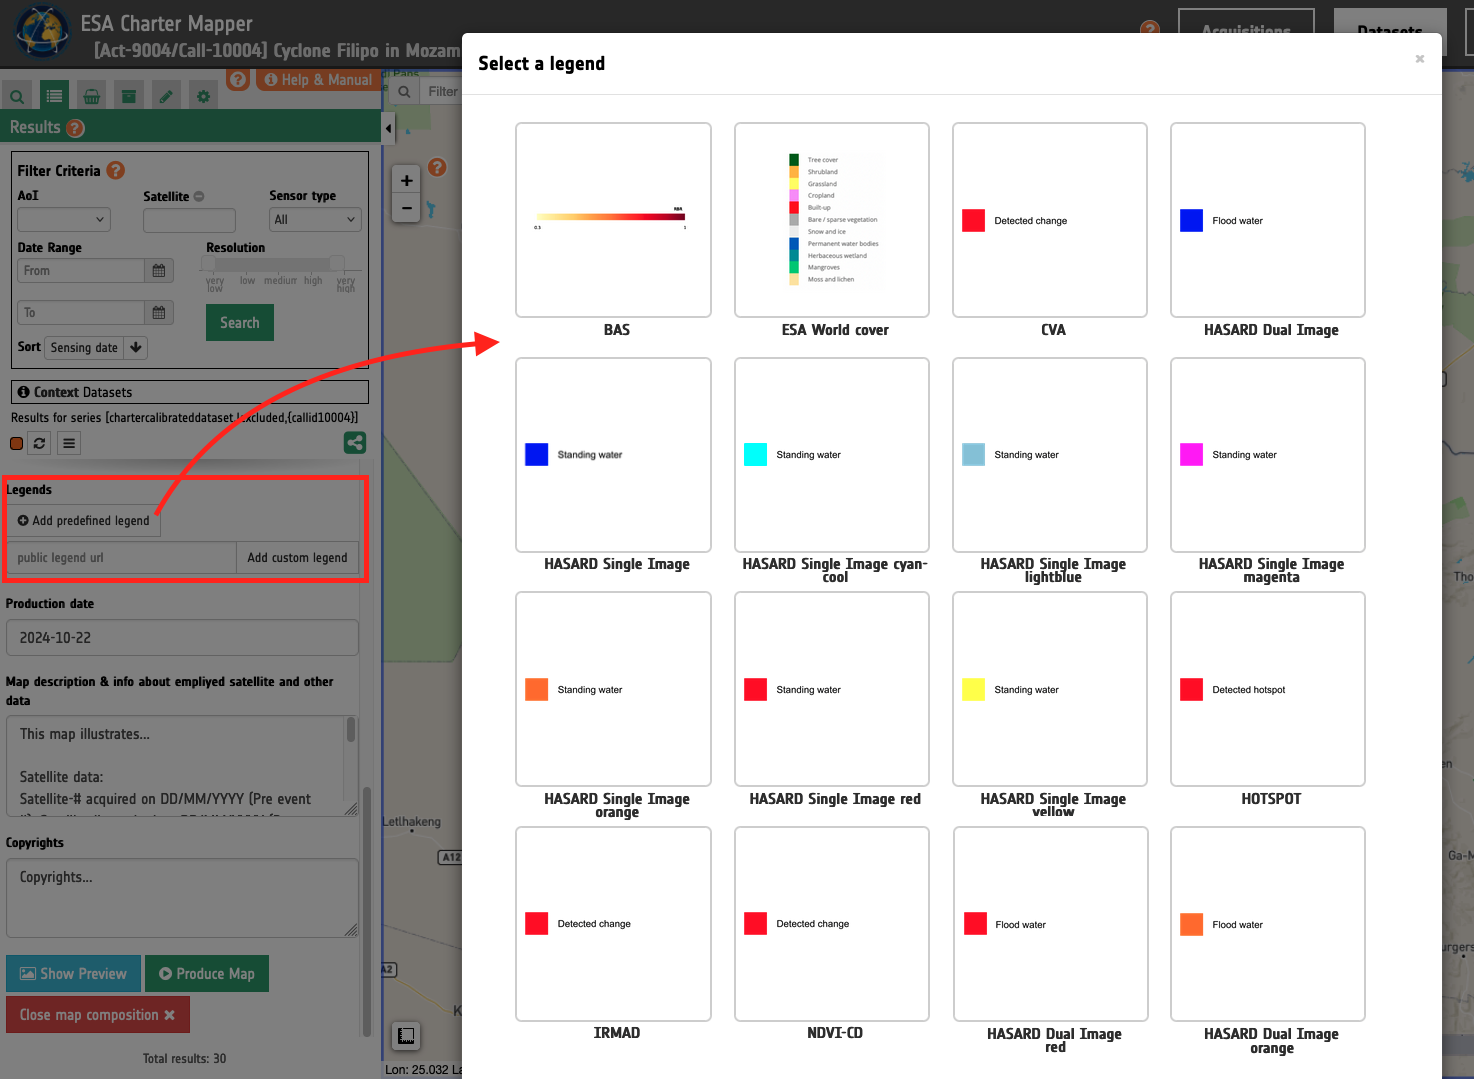
When available, default legends are automatically added to the map (e.g. the legend for the BAS severity overview asset). In case a legend is not found by the Map composition function, legend for some assets from on-demand processing services can be selected by the user as:
NDVI-CD
Legend for the ndvi-change-filtered asset:

HASARD Dual Image
Legend for the flood-mask asset:

HASARD Single Image
Legend for the water-mask asset:

IRMAD
Legend for the irmad_change_detection asset:

CVA
Legend for the Change_vector_analysis asset:

HOTSPOT
Legend for the hotspot asset:

Customized legend
Below are listed suggested color maps for binary single band assets having No data value = 0:
-
bwr color map to get red on DN=1
-
wistia color map to get orange on DN=1
-
autumn color map to get yellow on DN=1
-
cool_r color map to get cyan on DN=1
-
paired_r color map to get light blue on DN=1
-
bwr_r color map to get blue on DN=1
-
cool color map to get magenta on DN=1
Thus, alternative legends for the water-mask asset from HASARD-SI are shown below.
Standing water in red

The user can employ the same legend for the water-mask asset by setting bwr as color map and No data value = 0.
Standing water in orange

The user can employ the same legend for the water-mask asset by setting wistia as color map and No data value = 0.
Standing water in yellow

The user can employ the same legend for the water-mask asset by setting autumn as color map and No data value = 0.
Standing water in cyan

The user can employ the same legend for the water-mask asset by setting cool_r as color map and No data value = 0.
Standing water in light blue

The user can employ the same legend for the water-mask asset by setting paired_r as color map and No data value = 0.
Standing water in magenta

The user can employ the same legend for the water-mask asset by setting cool as color map and No data value = 0.
Charter activation name and number
In the bottom left part of the template (item 4) the map provides basic information about the charter activation showing also the International Space and Major Disasters logo. The title and Call title and Act/Call numbers are automatically extracted from the catalog reference of the activation workspace.
Note
The user cannot edit the contents for this item.
Agencies Logos
A fixed space dedicated to host a maximum number of agency logos defined by the user. Item 5 is optional because it depends if the user wants to add logos for its organization and/or the satellite image providers/agencies.
The user can select one or more logos from the one available in the system by clicking on Add predefined logo button. Furthermore it is also possible to upload a logo from a public URL by clicking on the Add custom logo button.
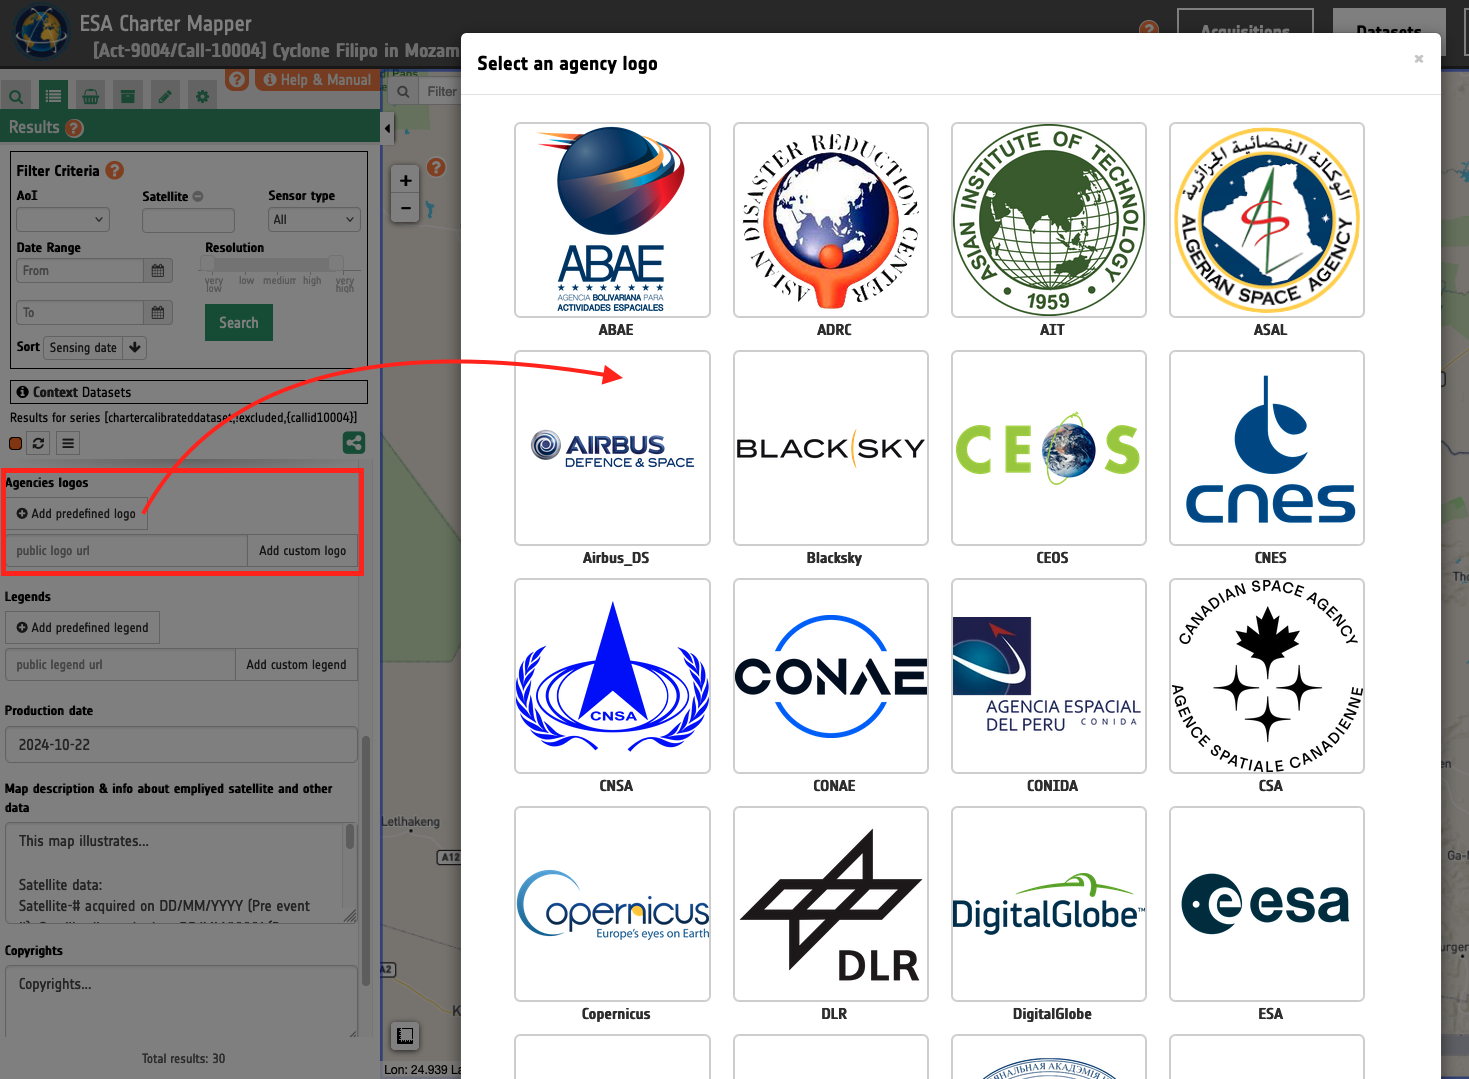
The extent of this bar is fixed and therefore only a certain number of logos can find a place in there. The user can insert a maximum of 7 logos.
Copyrights
Item 14 provides a text box where the user must insert the copyrights. As an example if the map contains satellite imagery from the Sentinel-1 mission the VAP must include the following:
Contains modified Copernicus Sentinel-1 data (YEAR).
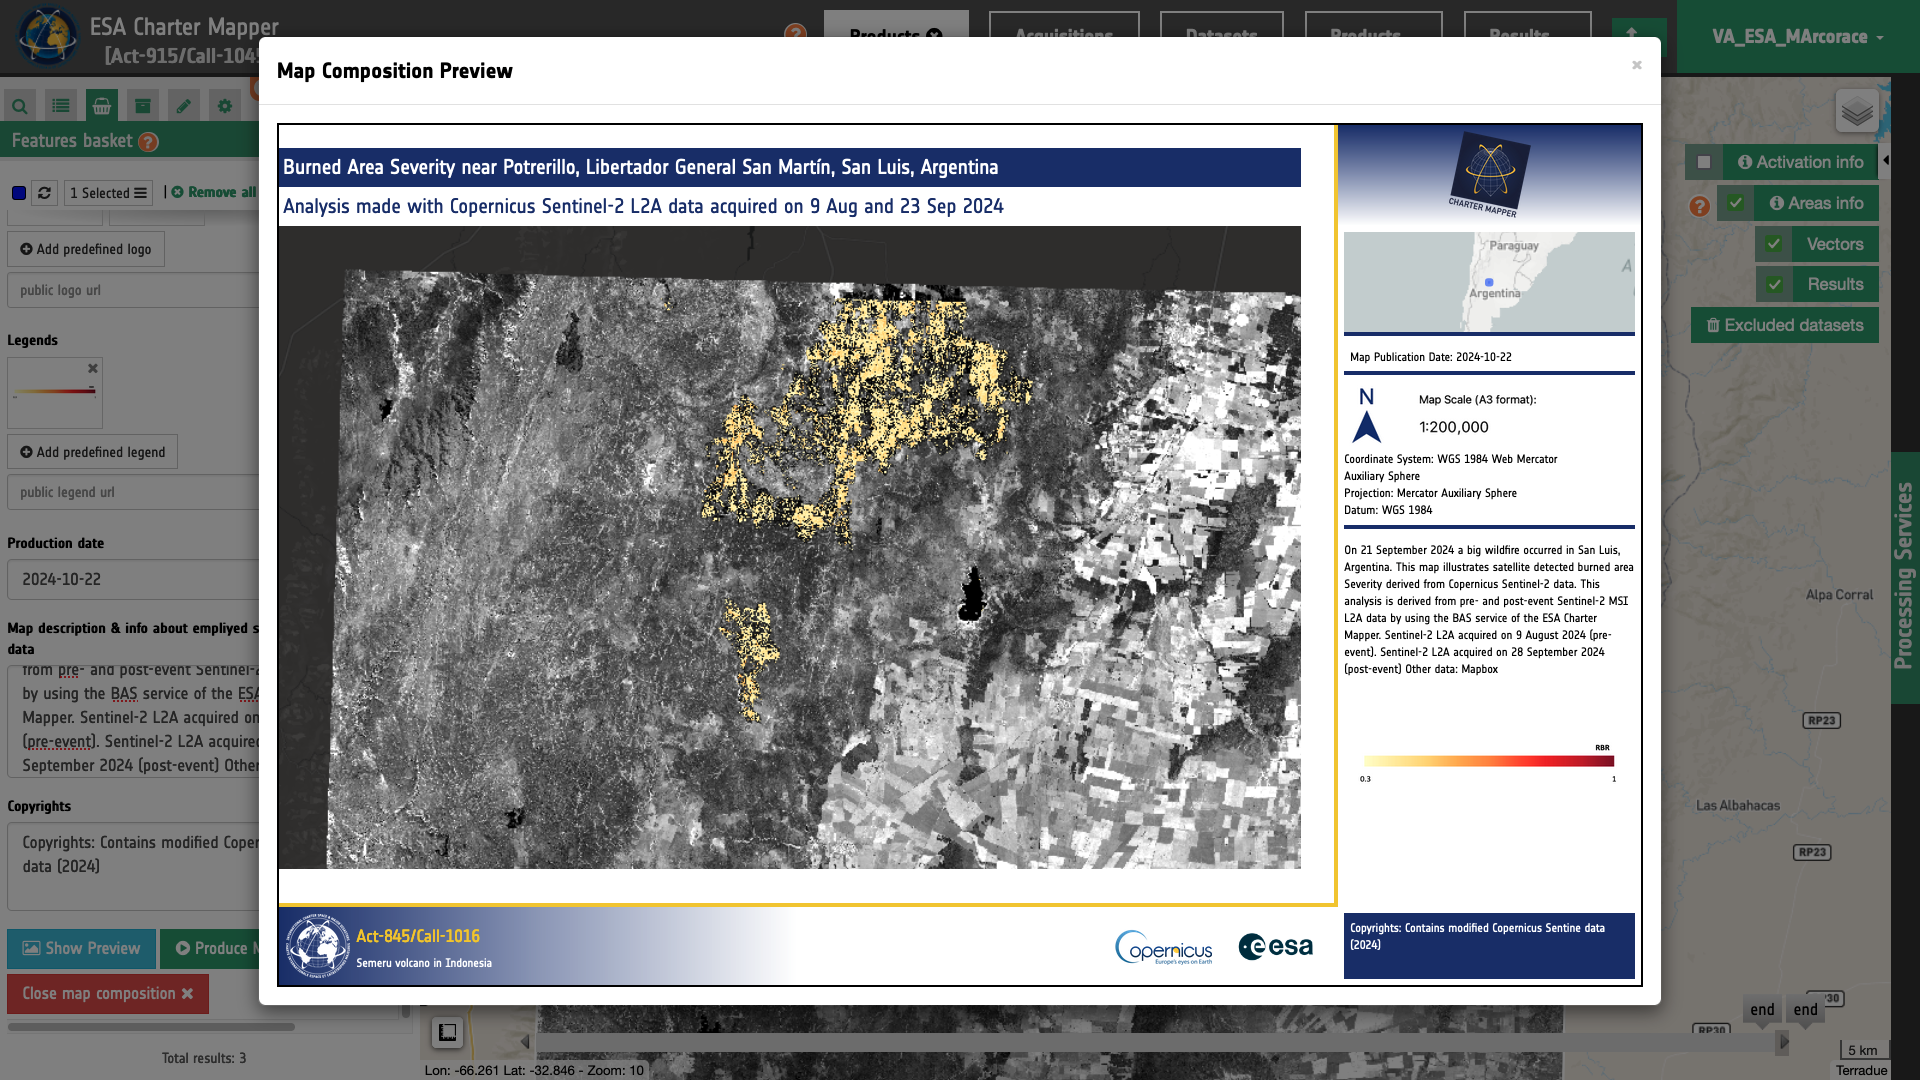
Show preview
Once all parameters are defined the user can see a preview of the map composition and then easily trigger the on-demand processing to generate the map by clicking on the Produce Map button.
Produce Map
Once all parameters are properly defined the user can click on the Produce Map button. This button triggers the on-demand processing to generate the map.
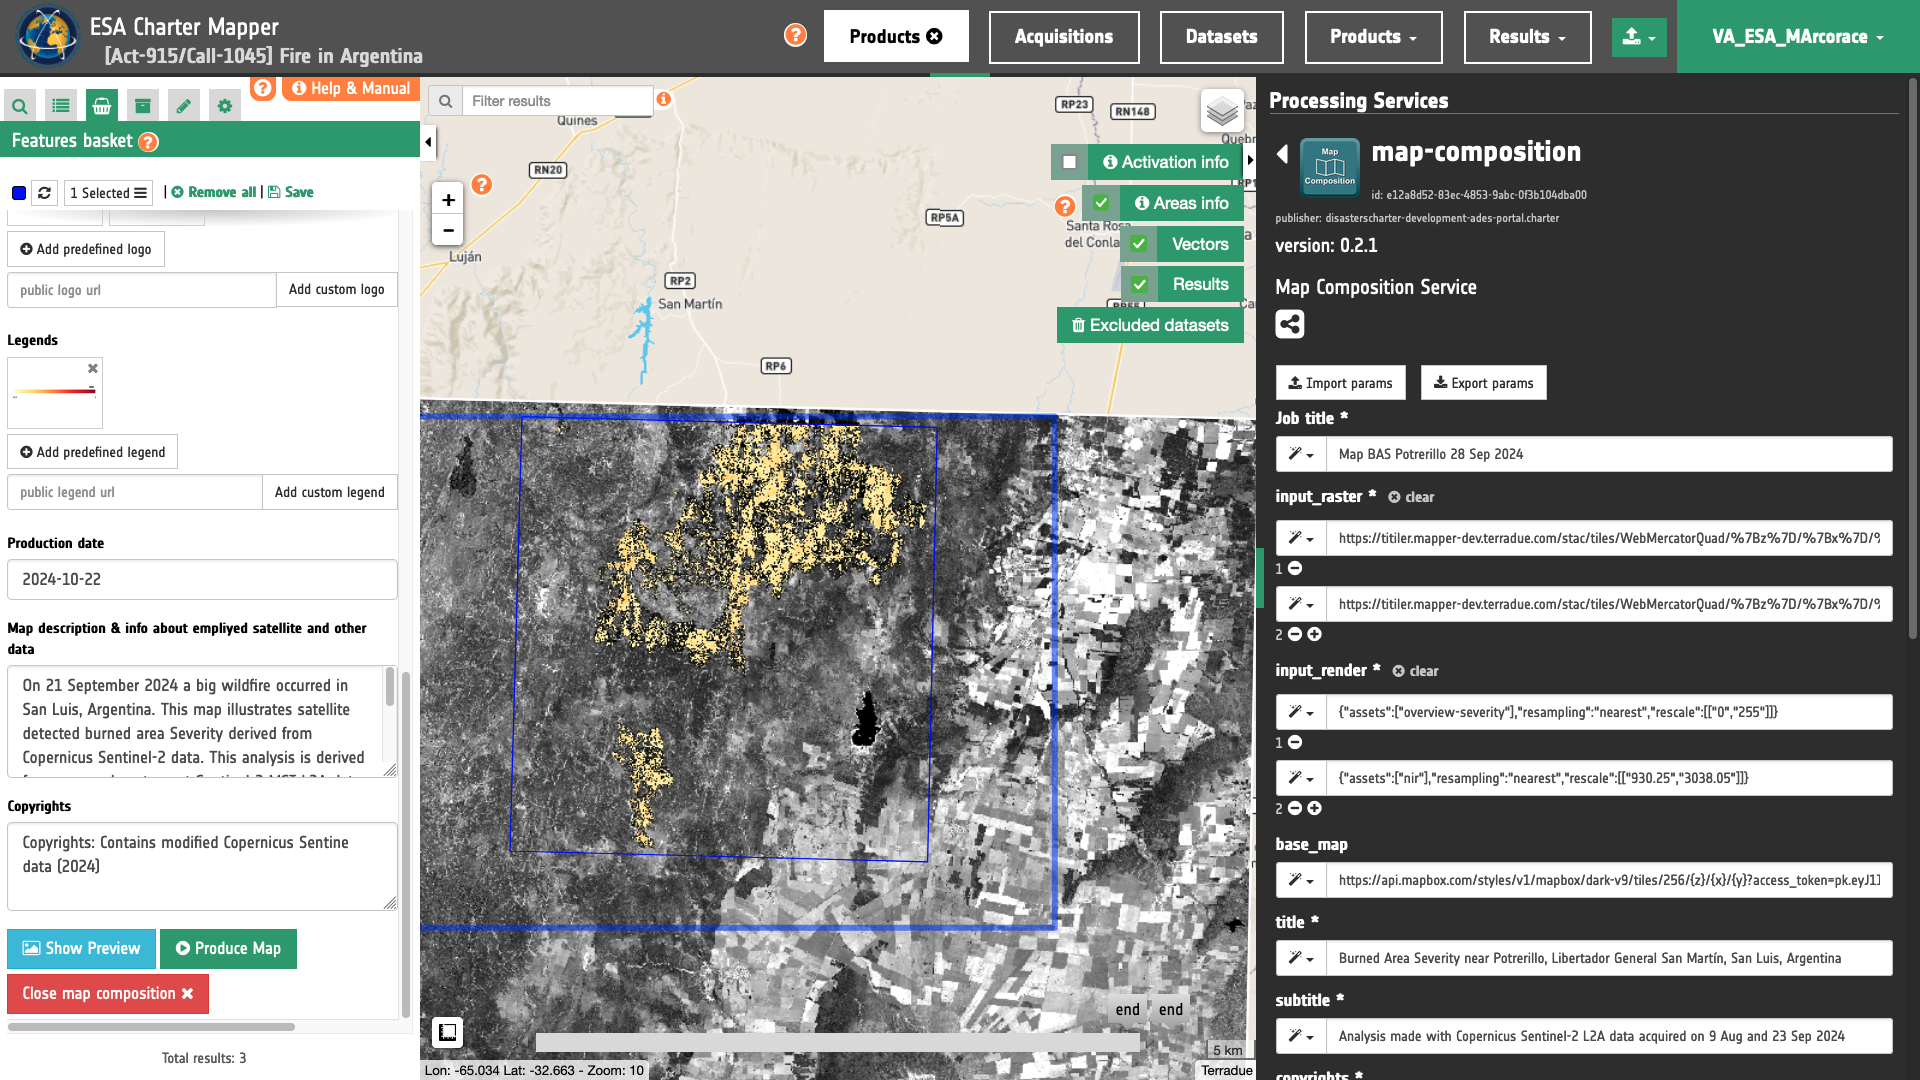
In the right panel the Map Composition panel is displayed with all the parameters already filled-in. To launch the service the user must click on the button Run Job and see the Running Job. Once the job is completed, the user shall then click on the button Show results at the bottom of the processing service panel.
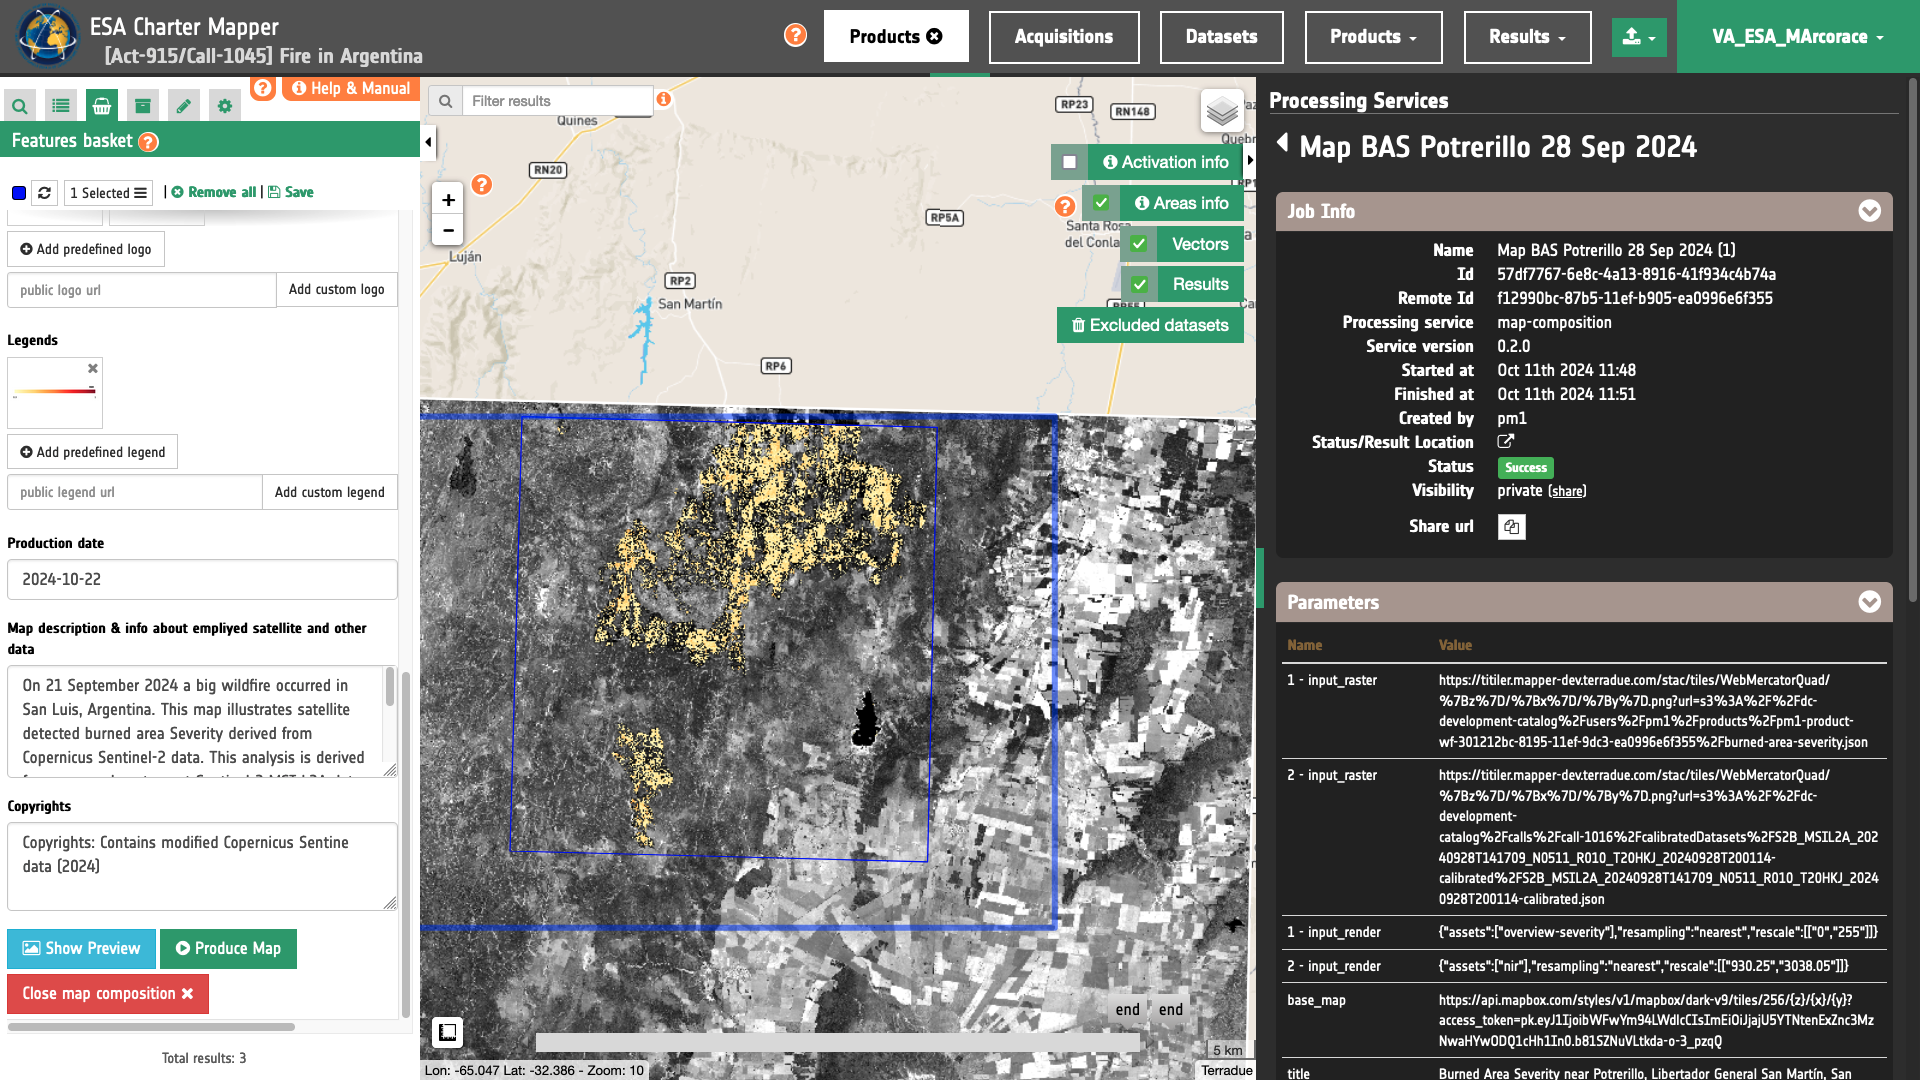
After that the generated cartographic products will be displayed in the map of the activation workspace. The user can download the generated PDF or PNG files by clicking on the Download button at the bottom of the left panel.
Use cases
Map from an asset of a calibrated dataset
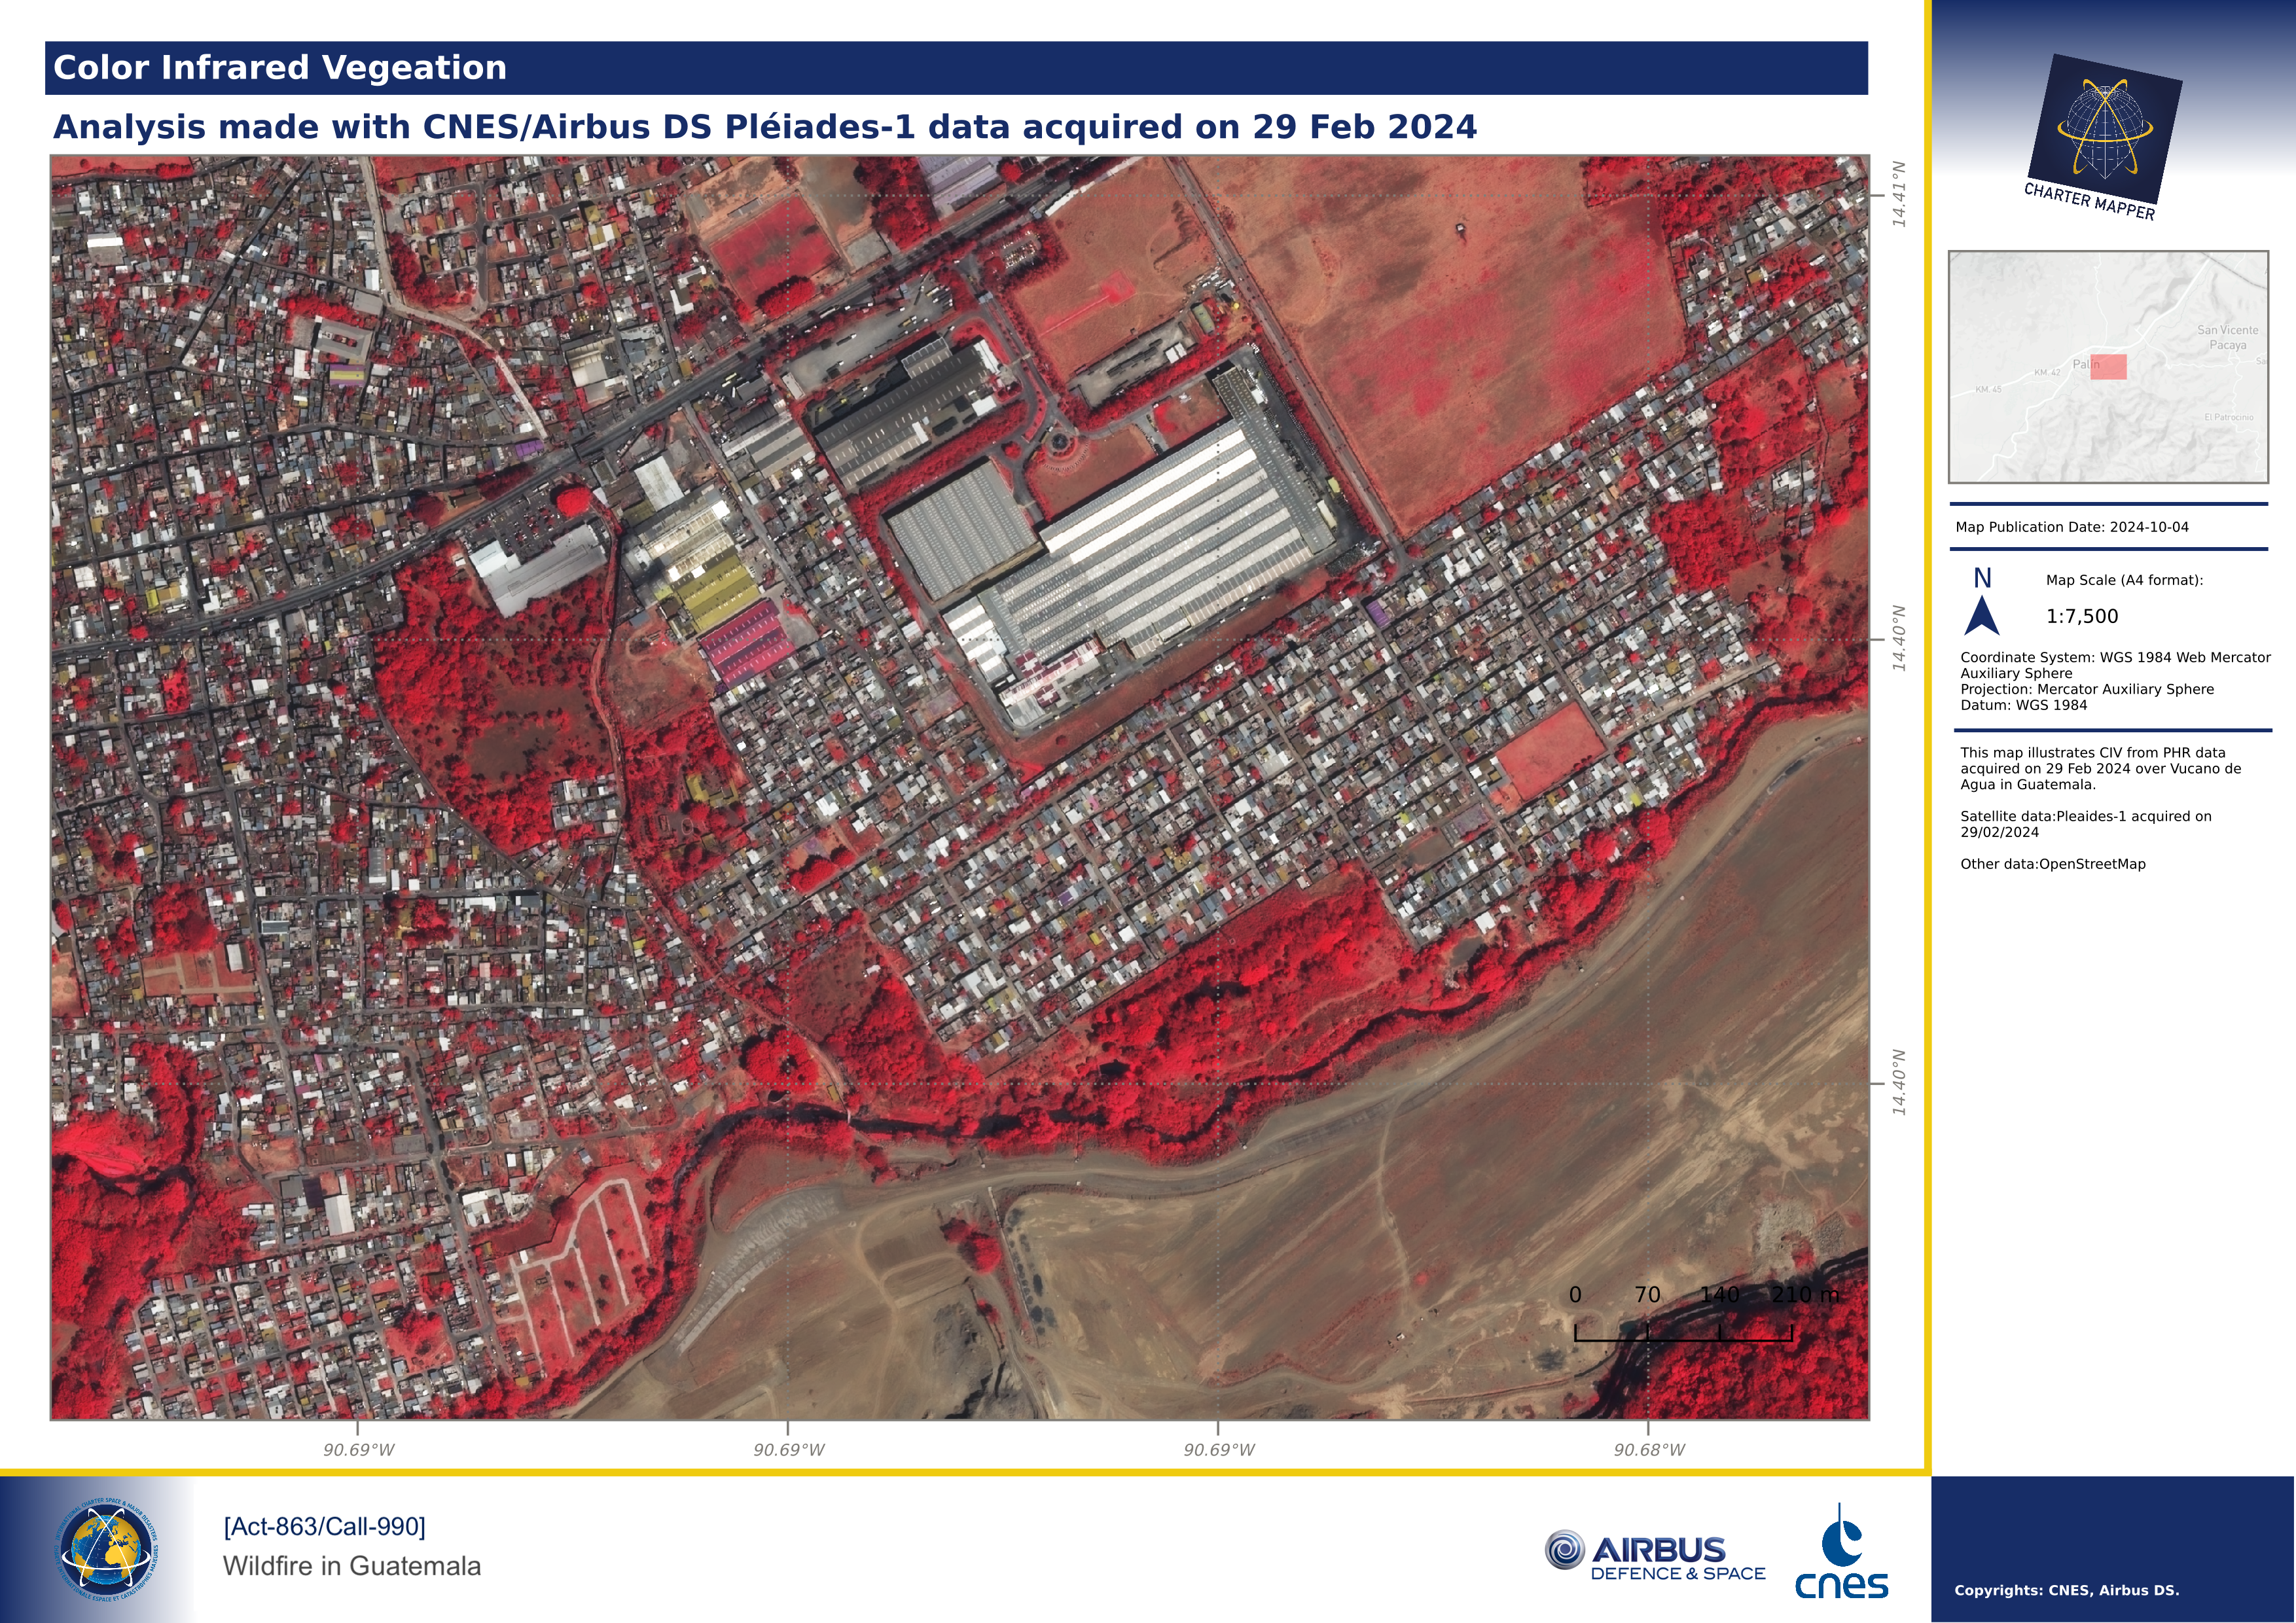
The first use case is about the creation of a map showing an asset from a Calibrated Dataset. The below map shows the True Color overview asset from a VHR calibrated optical data.
After the setup of desired View options for the overview-trc asset from the Calibrated Dataset (e.g. by doing a linear stretch of 8-bit values), the map composition function has been used with the selected feature by drawing a BBOX, and adding title, subtitle, map description, logos, and copyrights. The obtained result is shown below.
Map using an asset from a Result
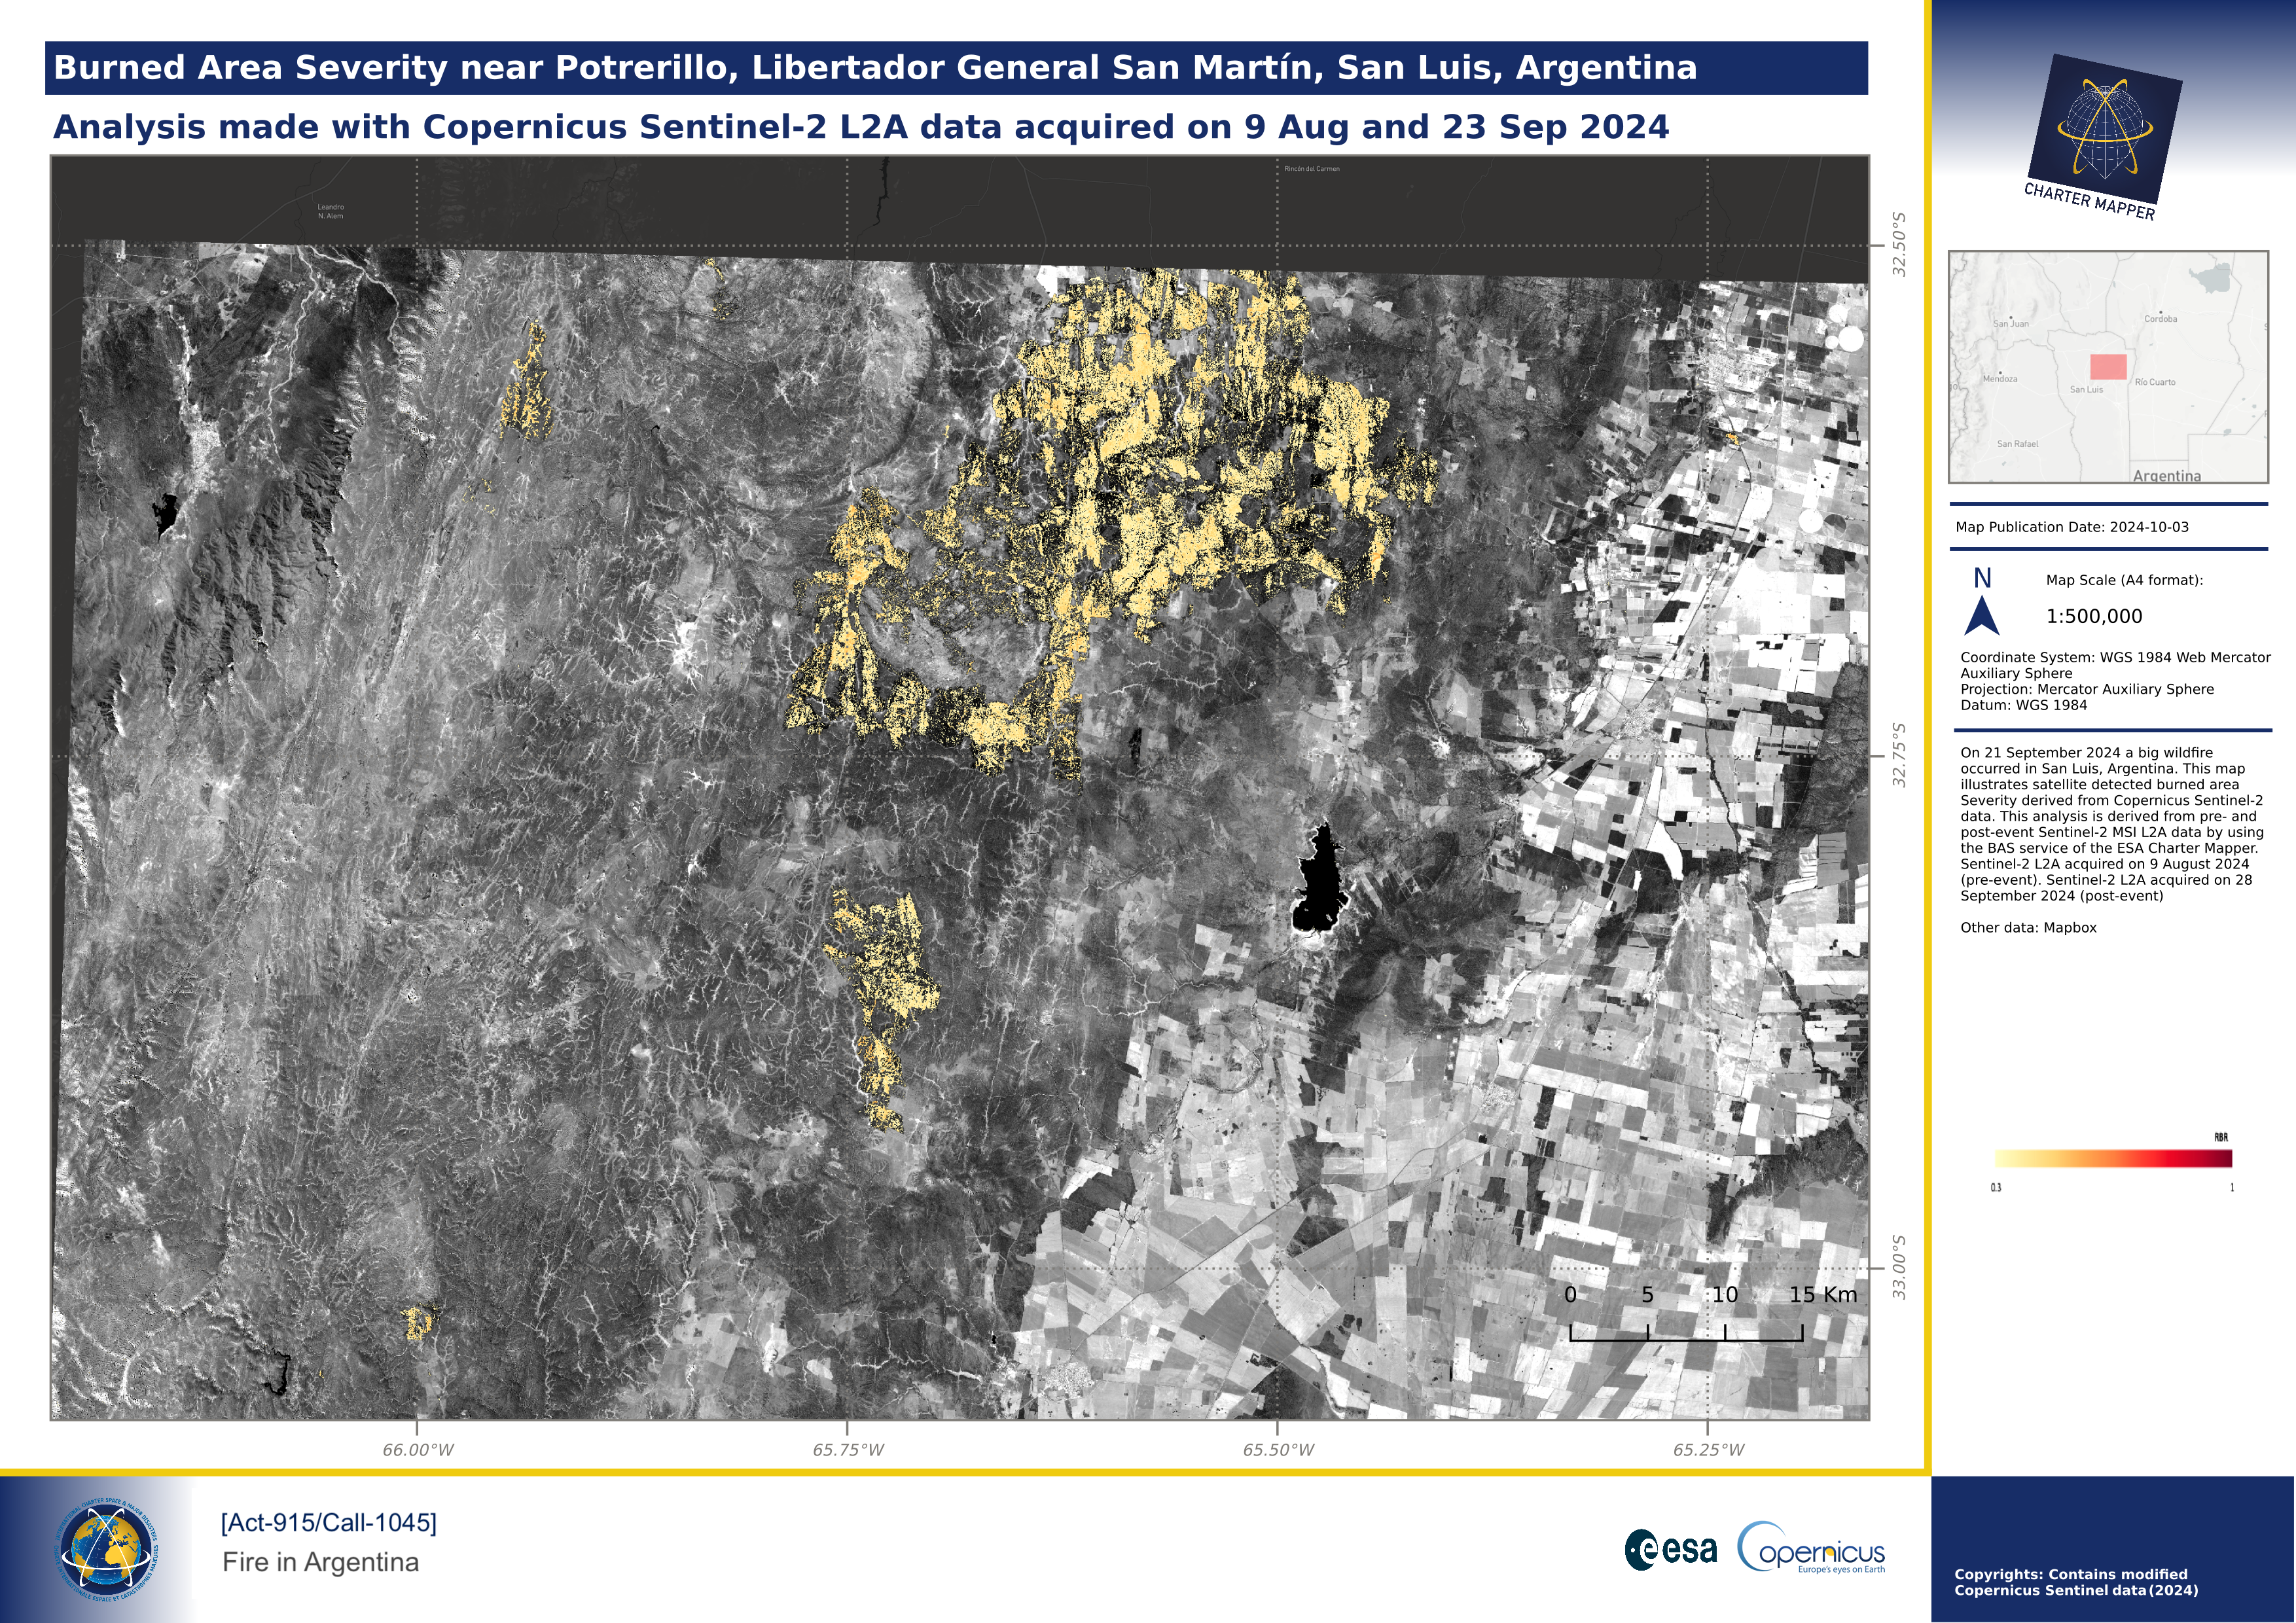
A second use case is dedicated to the creation of a map showing one asset from a Result of on-demand processing. The below example shows a map showing the BAS overview asset overlaid to a Sentinel-2 NIR band. For the BAS overview asset the Map composition functionality is able to pre-select the legend and include it in the map.
After the setup of desired View options for the nir asset from the Calibrated Dataset and the overview-bas asset from the BAS Result, the map composition function has been used with the 2 selected features by defining layers order, drawing a BBOX, and adding title, subtitle, map description, logos, and copyrights. The obtained result is shown below.
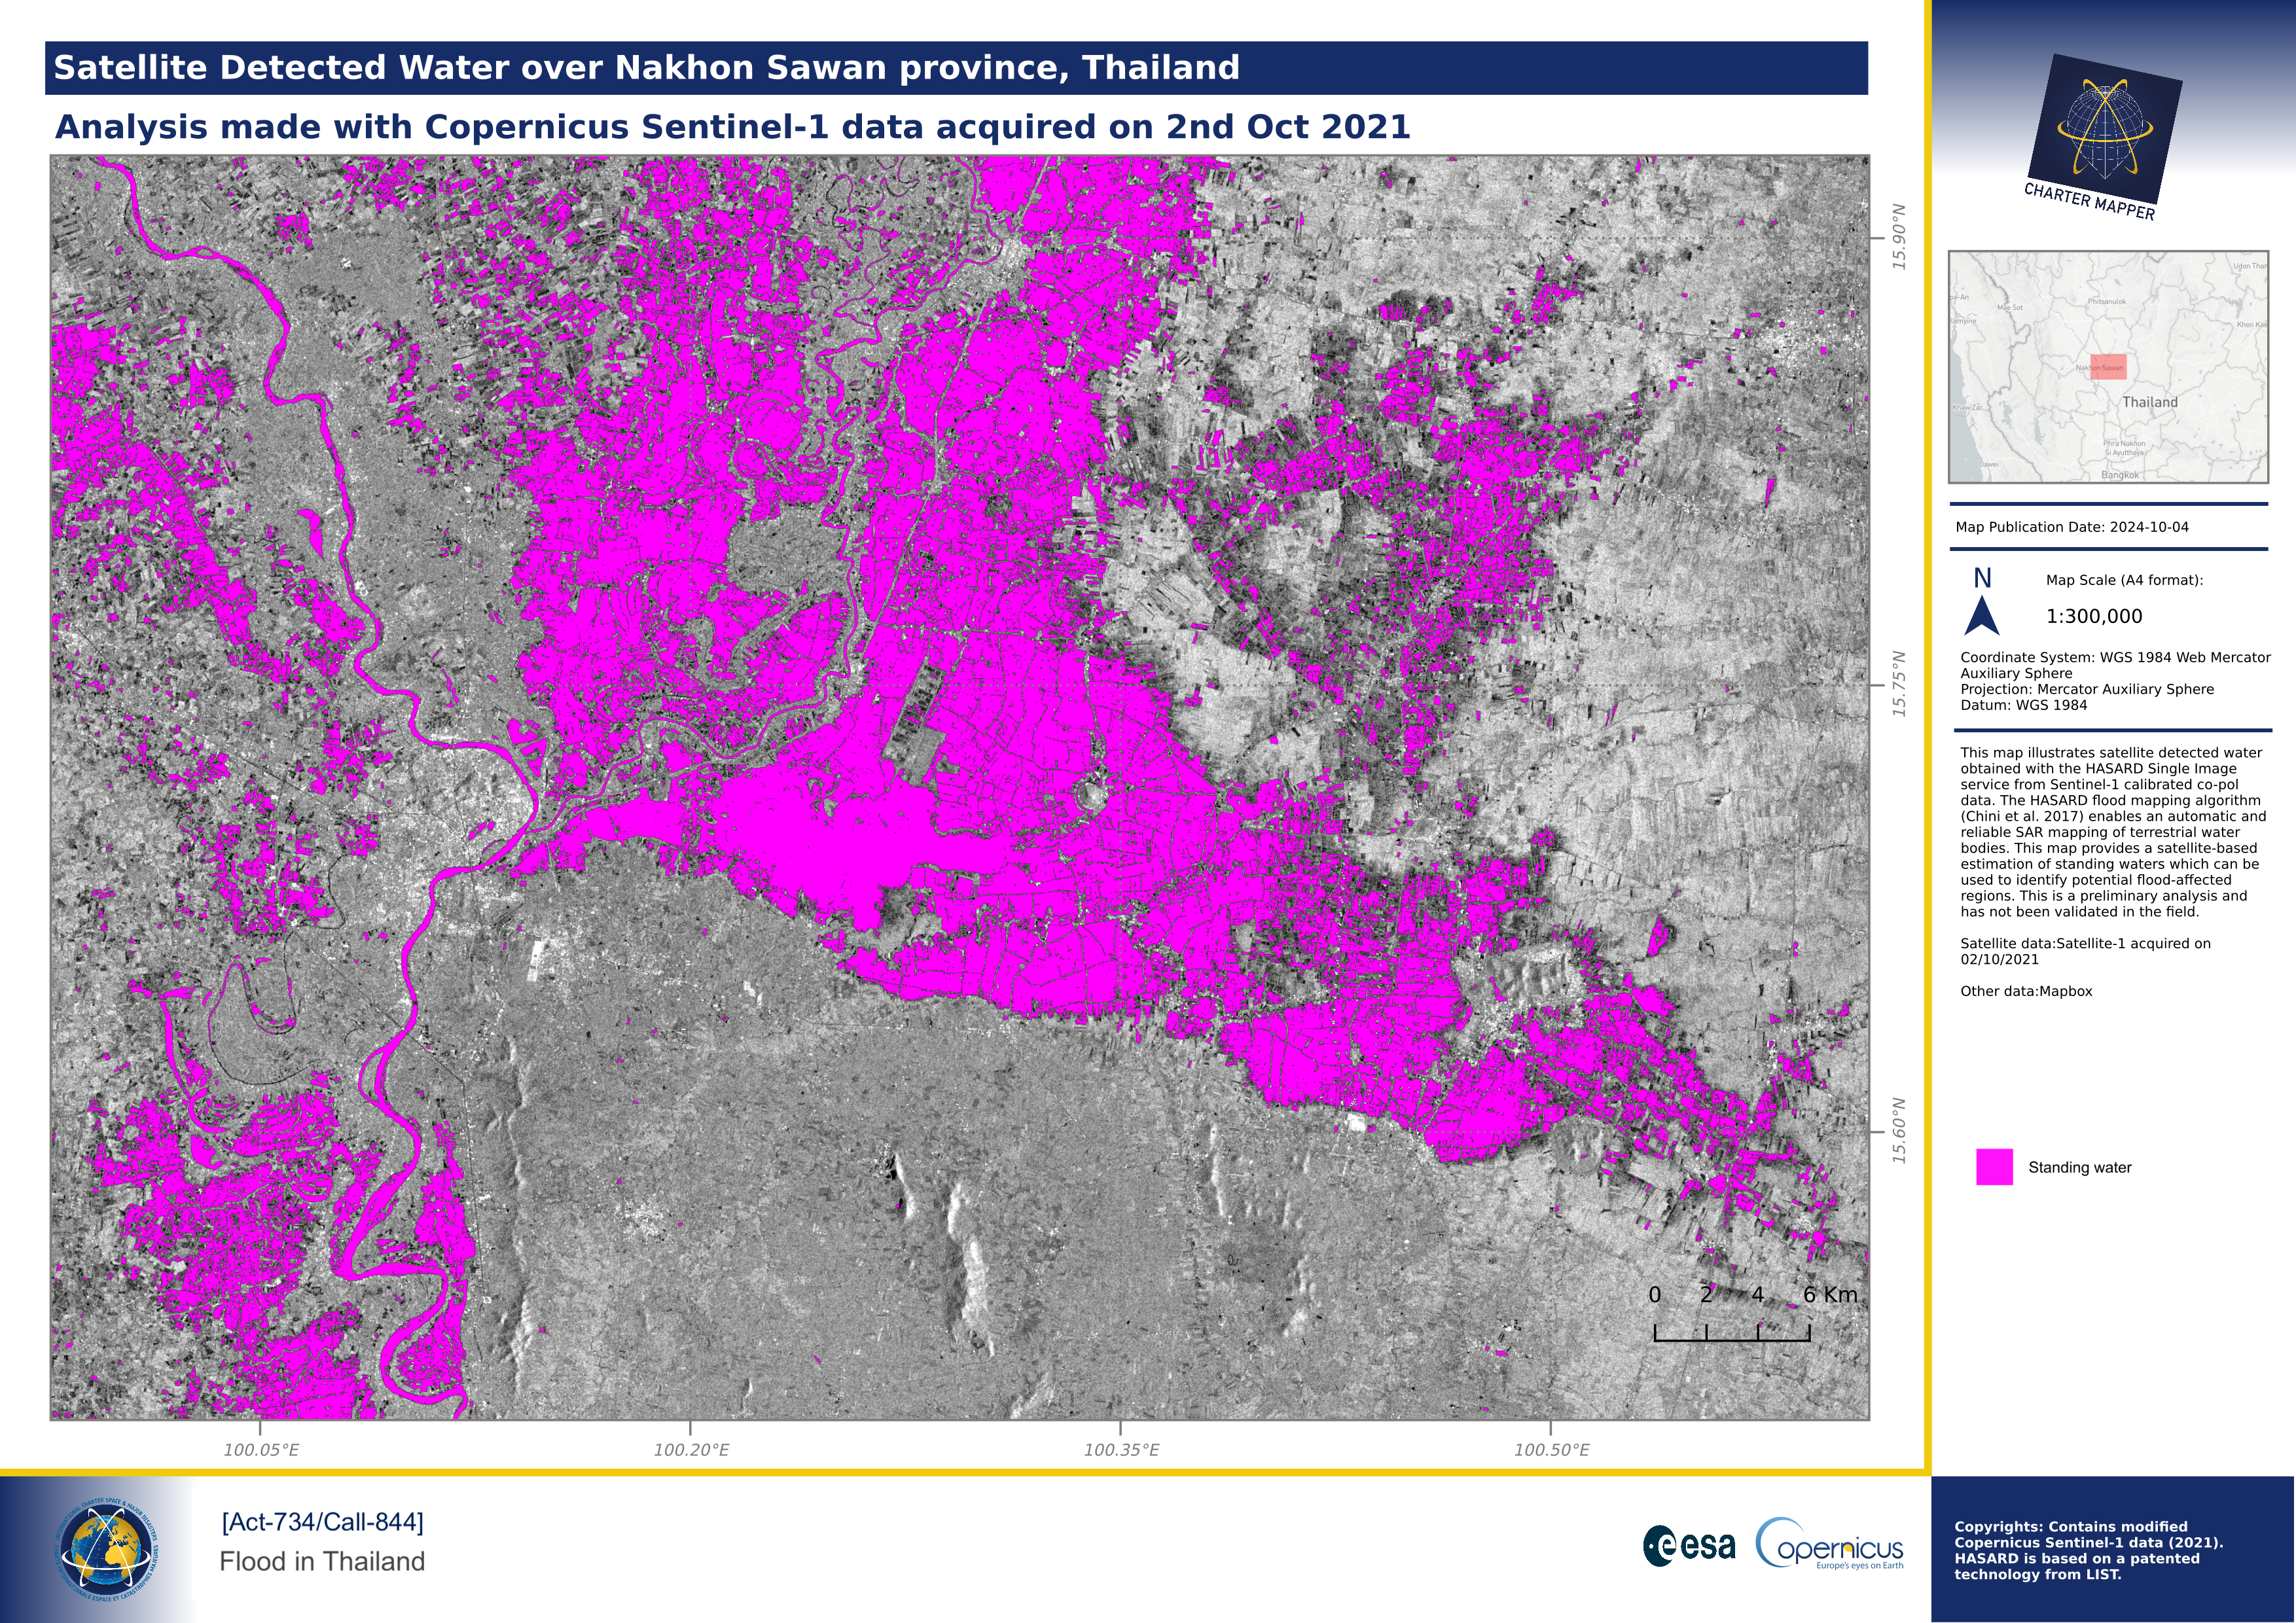
In case the user wants to change the pre-defined color map of an asset generated from on-demand processing (e.g. a water map), it is possible to change the view options of an asset (e.g. by showing standing waters in magenta) and then associate its customized legend for the map generation. The below example shows a map showing the water mask in purple overlaid to the post-event Sentinel-1 VV.
After the setup of desired View options for the s0_db_c_vv asset from the Calibrated Dataset and the water-mask asset from the HASARD-SI Result, the map composition function has been used with the 2 selected features by defining layers order, drawing a BBOX, and adding title, subtitle, map description, logos, and copyrights. The obtained result is shown below.
Map from combine assets
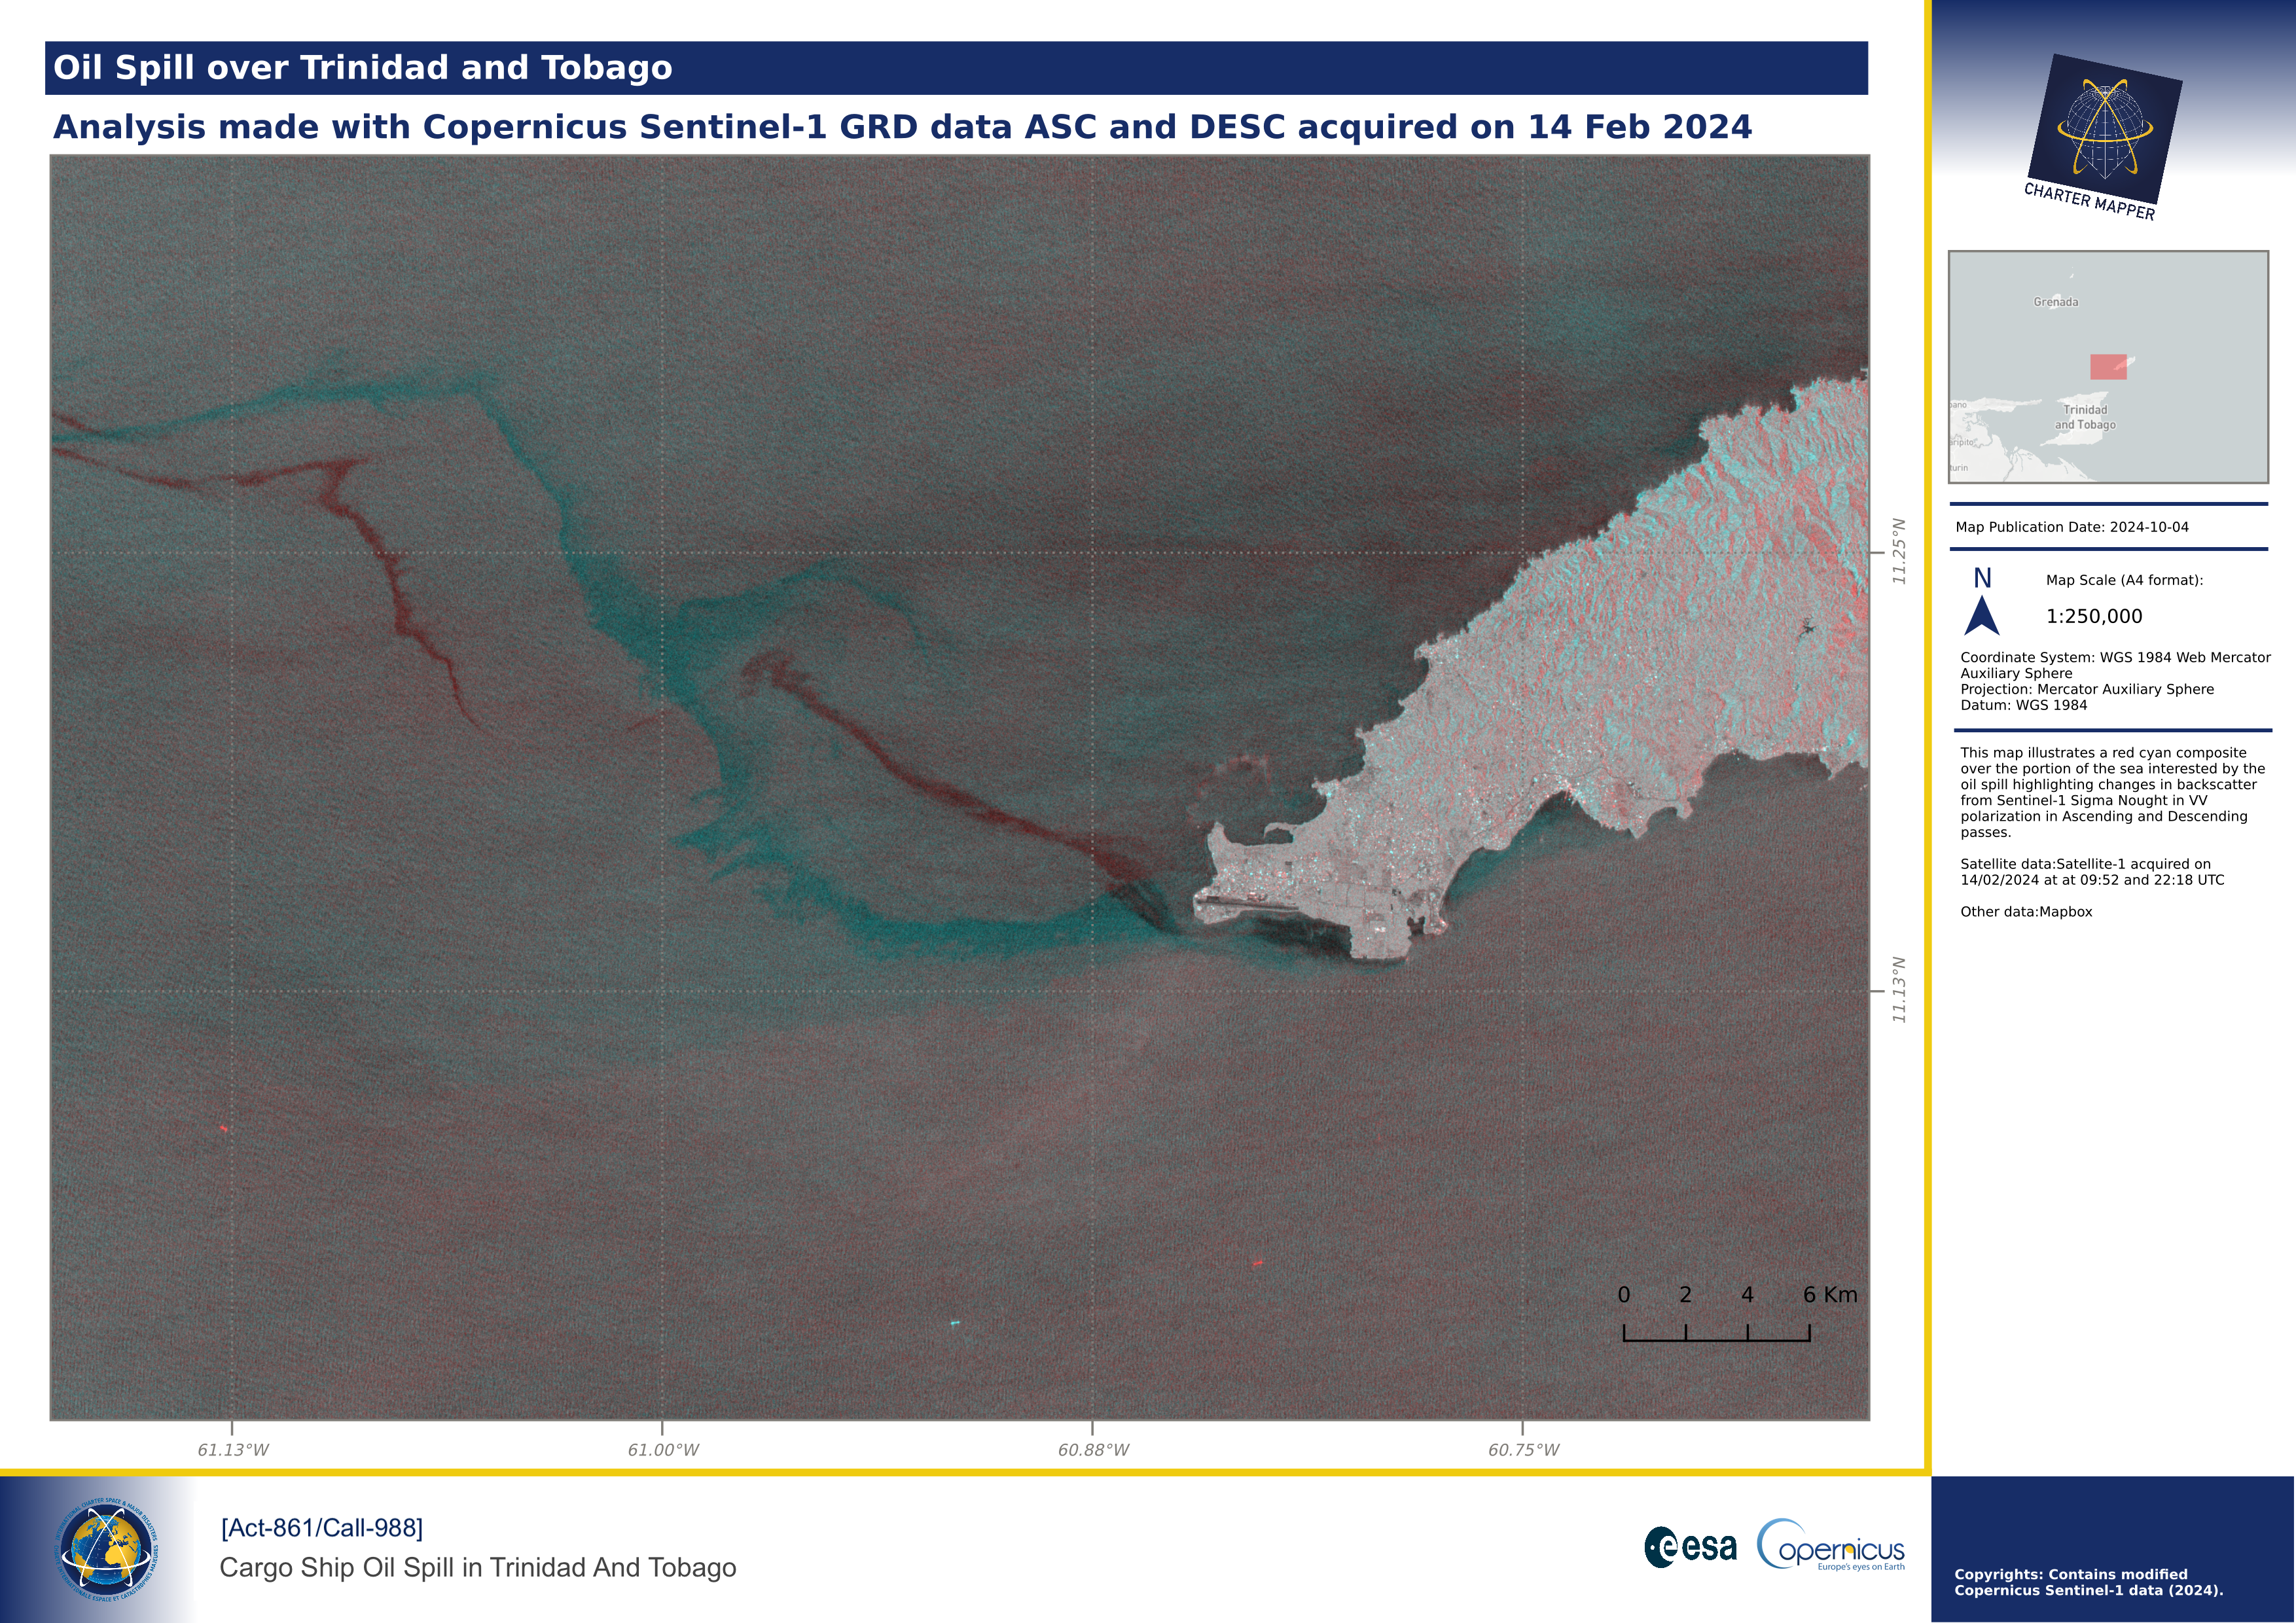
The third use case is dedicated to the creation of a map showing an RGB composite made using the assets contained in a Calibrated Dataset or a Result from on-demand processing. The below example shows a Red-Cyan composite from the combination of co-located backscatter assets from a Result with the SAR-Change service.
After the setup of desired View options in the Combine asset of the SAR-Change Result, the map composition function has been used with the selected feature by defining a BBOX, adding title, subtitle, map description, logos, and copyrights. The obtained result is shown below.
Map from an imported external product
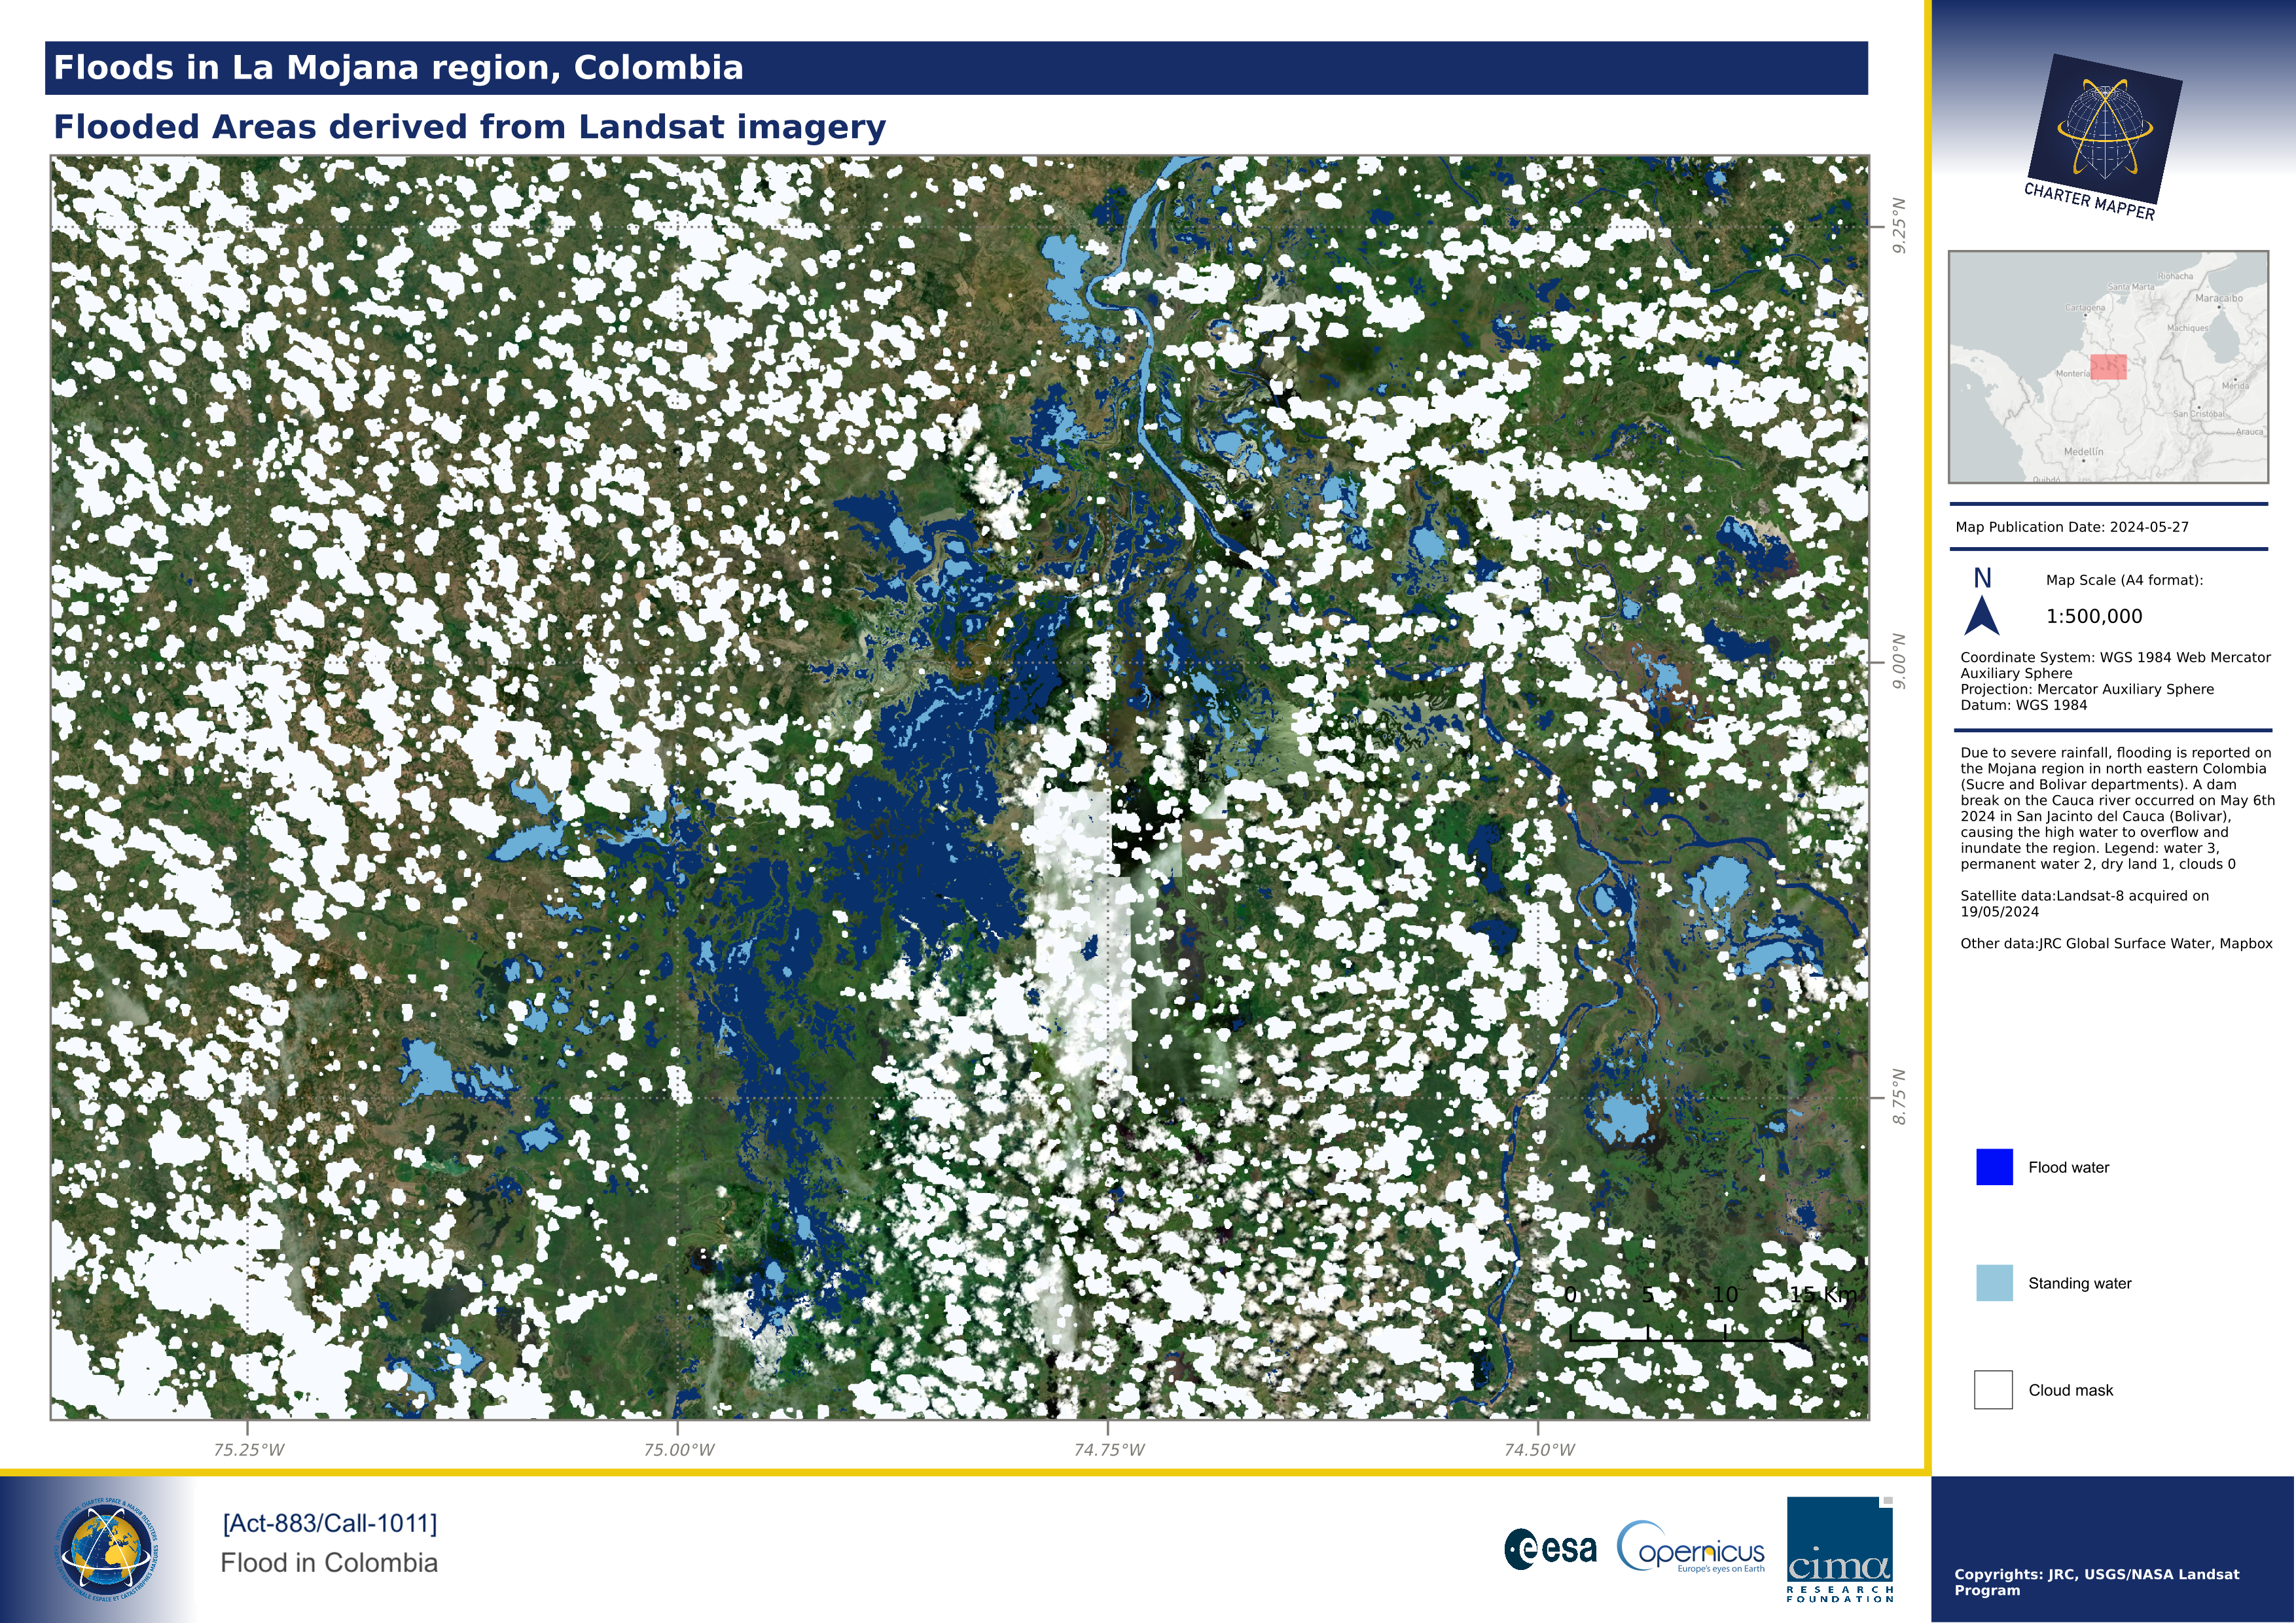
This fourth use case is about the creation of a map using an external product imported into the platform. The below example shows a map derived using the raster product employed in this VAP of CIMA Research Foundation for the [Act-883/Call-1011] Flood in Colombia. The raster has been uploaded in the Charter Mapper using the Import External Prorudct functionality. Values for this imported raster are 3 for water, 2 for permanent water, 1 for dry land, and 0 for clouds. After the upload the default view options of the generated single band asset has been changed as:
-
color map = blues
-
No data value = 1
in this way: flood water are shown in blue, permanent water in light blue, dry land is transparent, and clouds in white.
After the setup of desired View options for the CIMA's uplaoded product, the map composition function has been used with the selected feature by defining a BBOX, adding title, subtitle, map description, logos, and copyrights. The obtained result is shown below.
