COMBI-Plus tutorial
![]()
This service provides an advanced environment to create a full resolution RGB composite from a fully customizable combination of multiple single band assets from Optical or Radar Calibrated Datasets. The output has the finest resolution as of the input data (only if all selected bands are coming from the same sensor). It also provides co-located single band assets (reflectance or Sigma0 in dB) after reprojection and resampling on the same grid.
 COMBI-Plus service description and specifications are available in this section.
Select the processing service
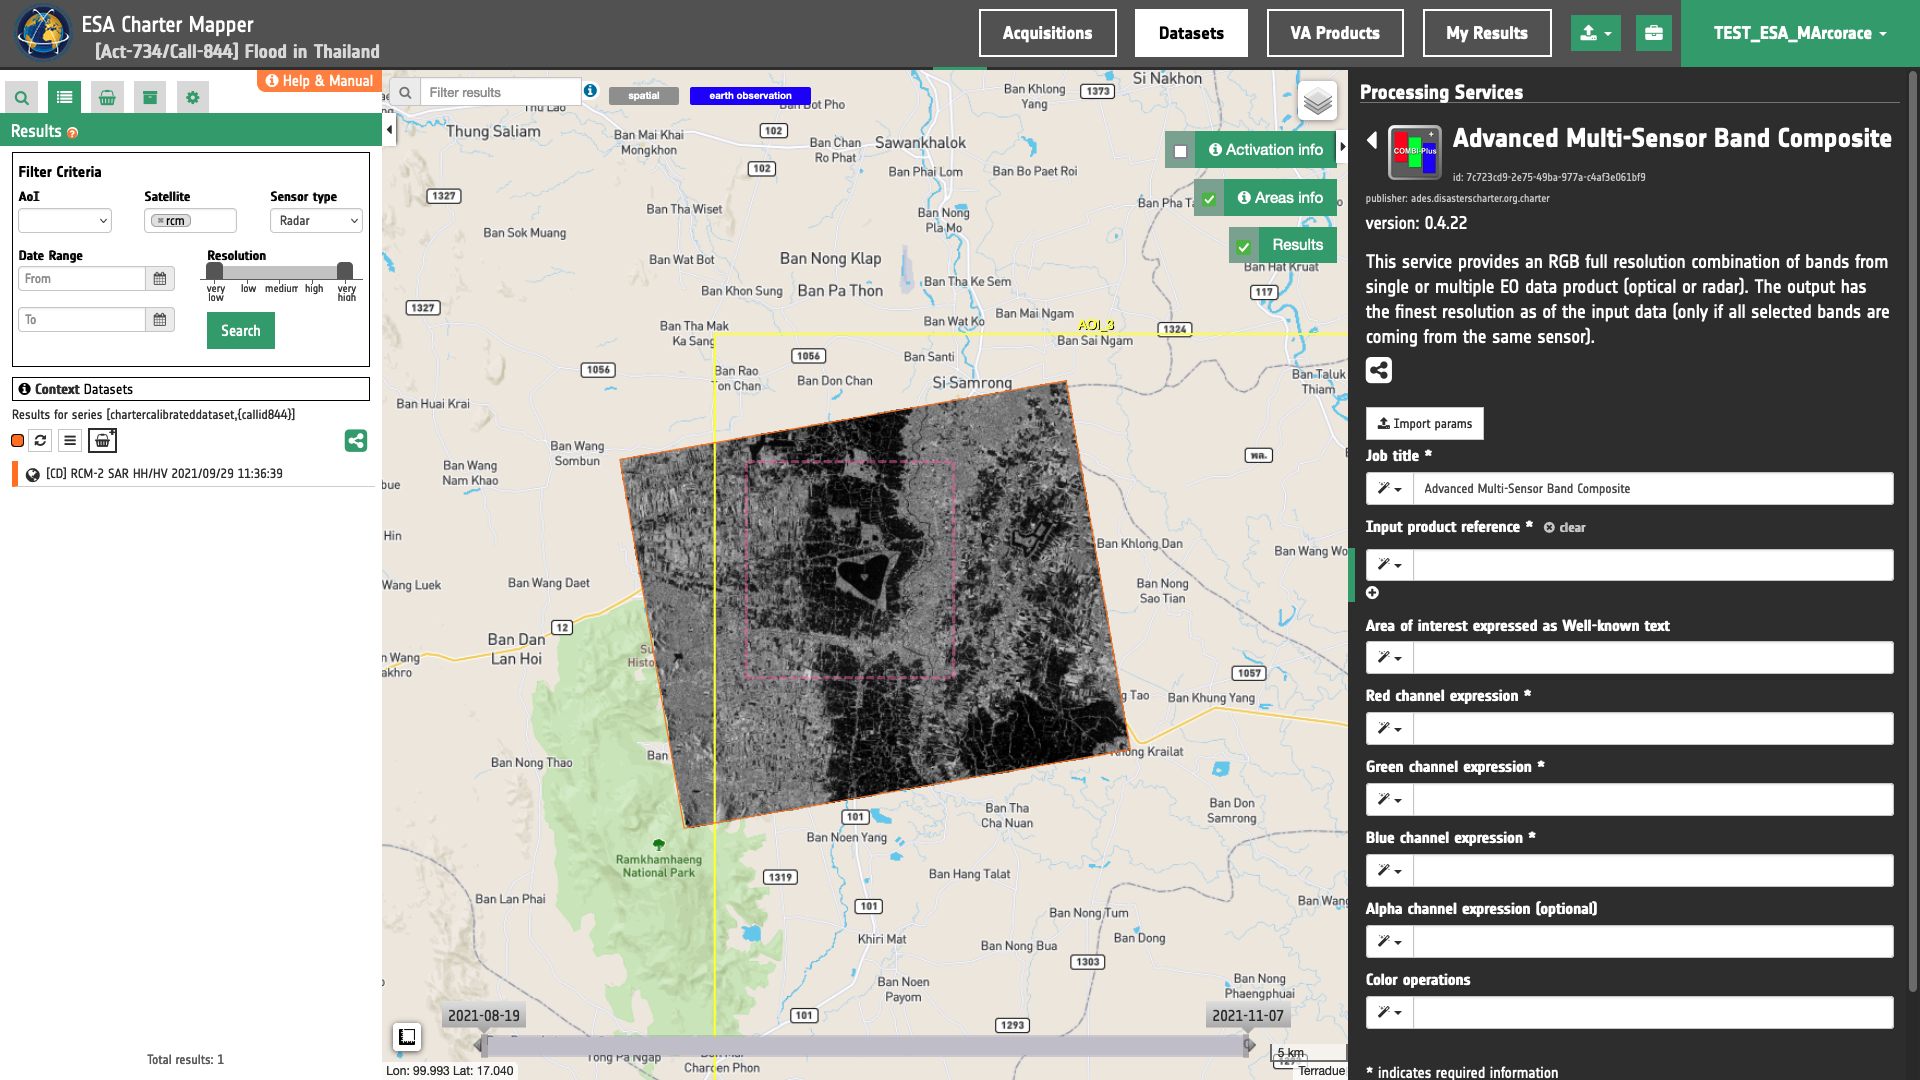
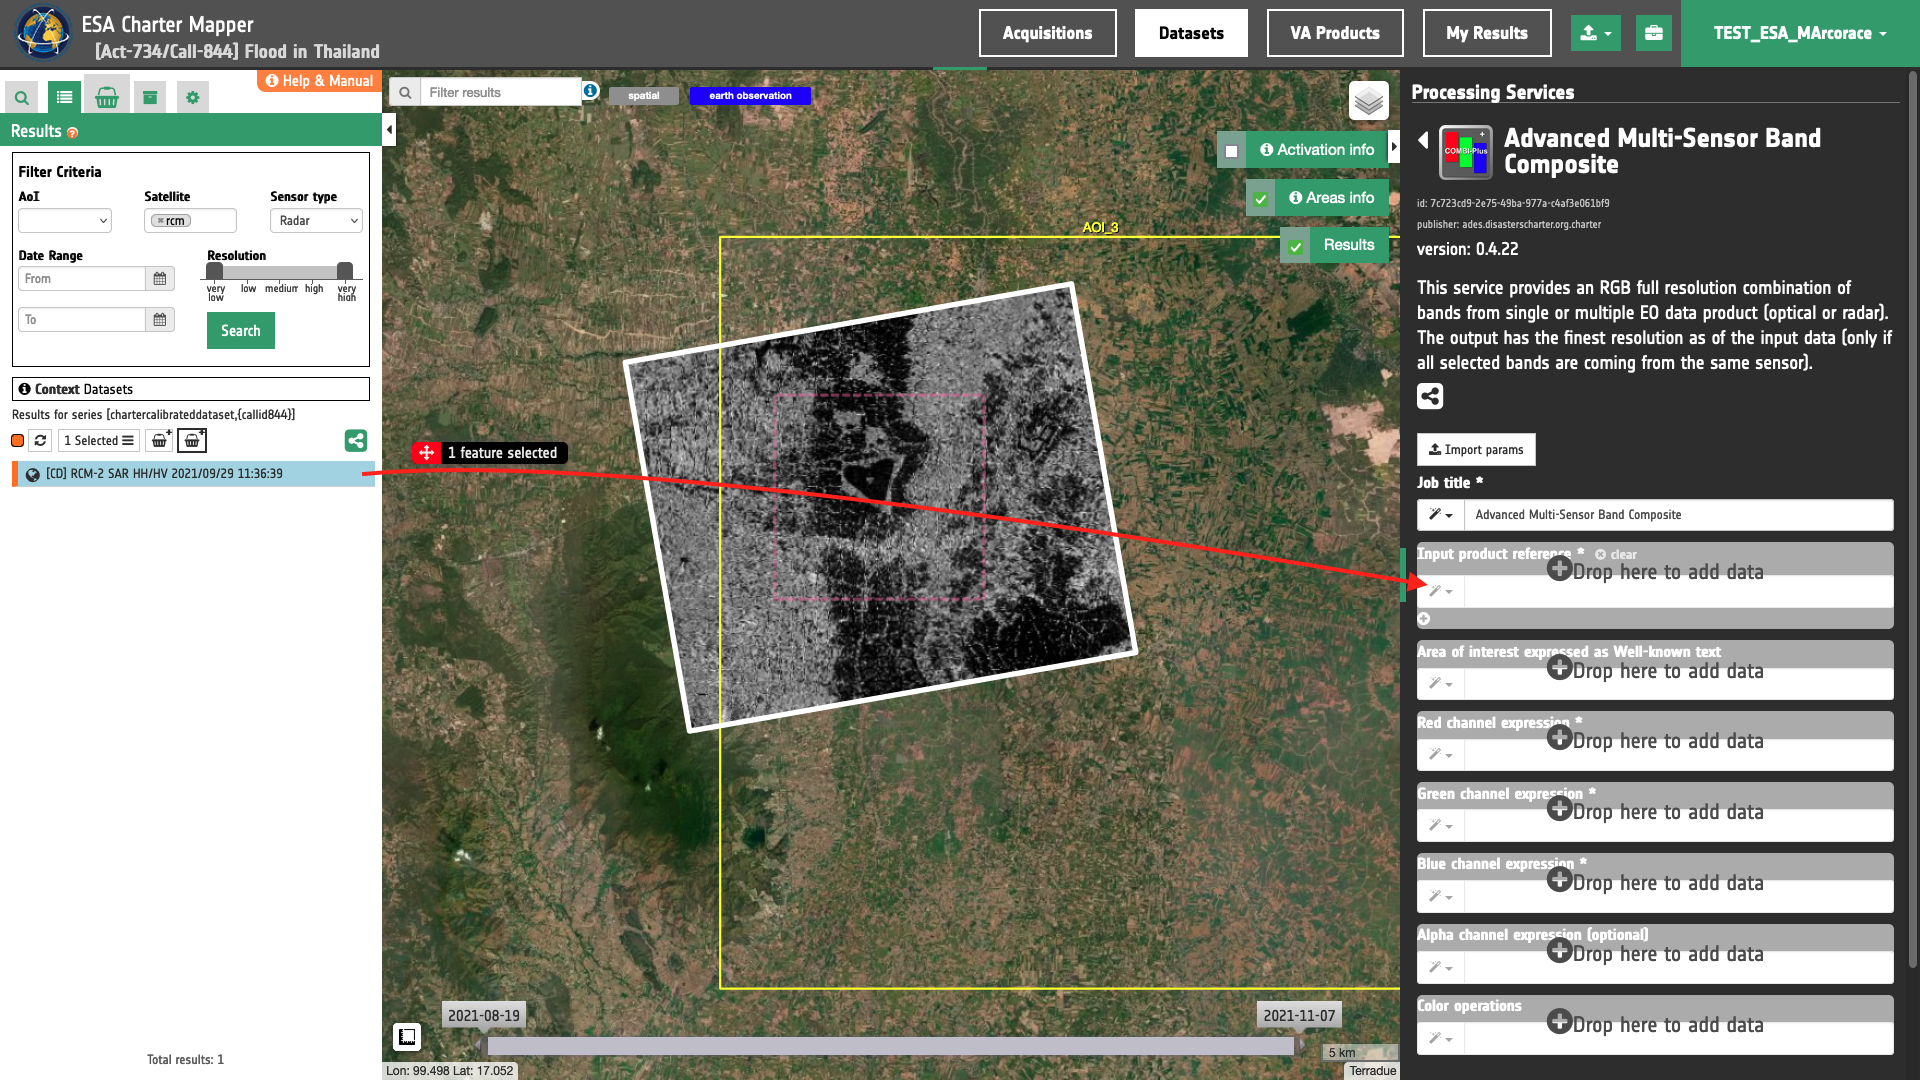
After the opening of the activation workspace, in the right panel of the interface, open the Processing Services tab, select the processing service Advanced Multi-Sensor Band Composite.
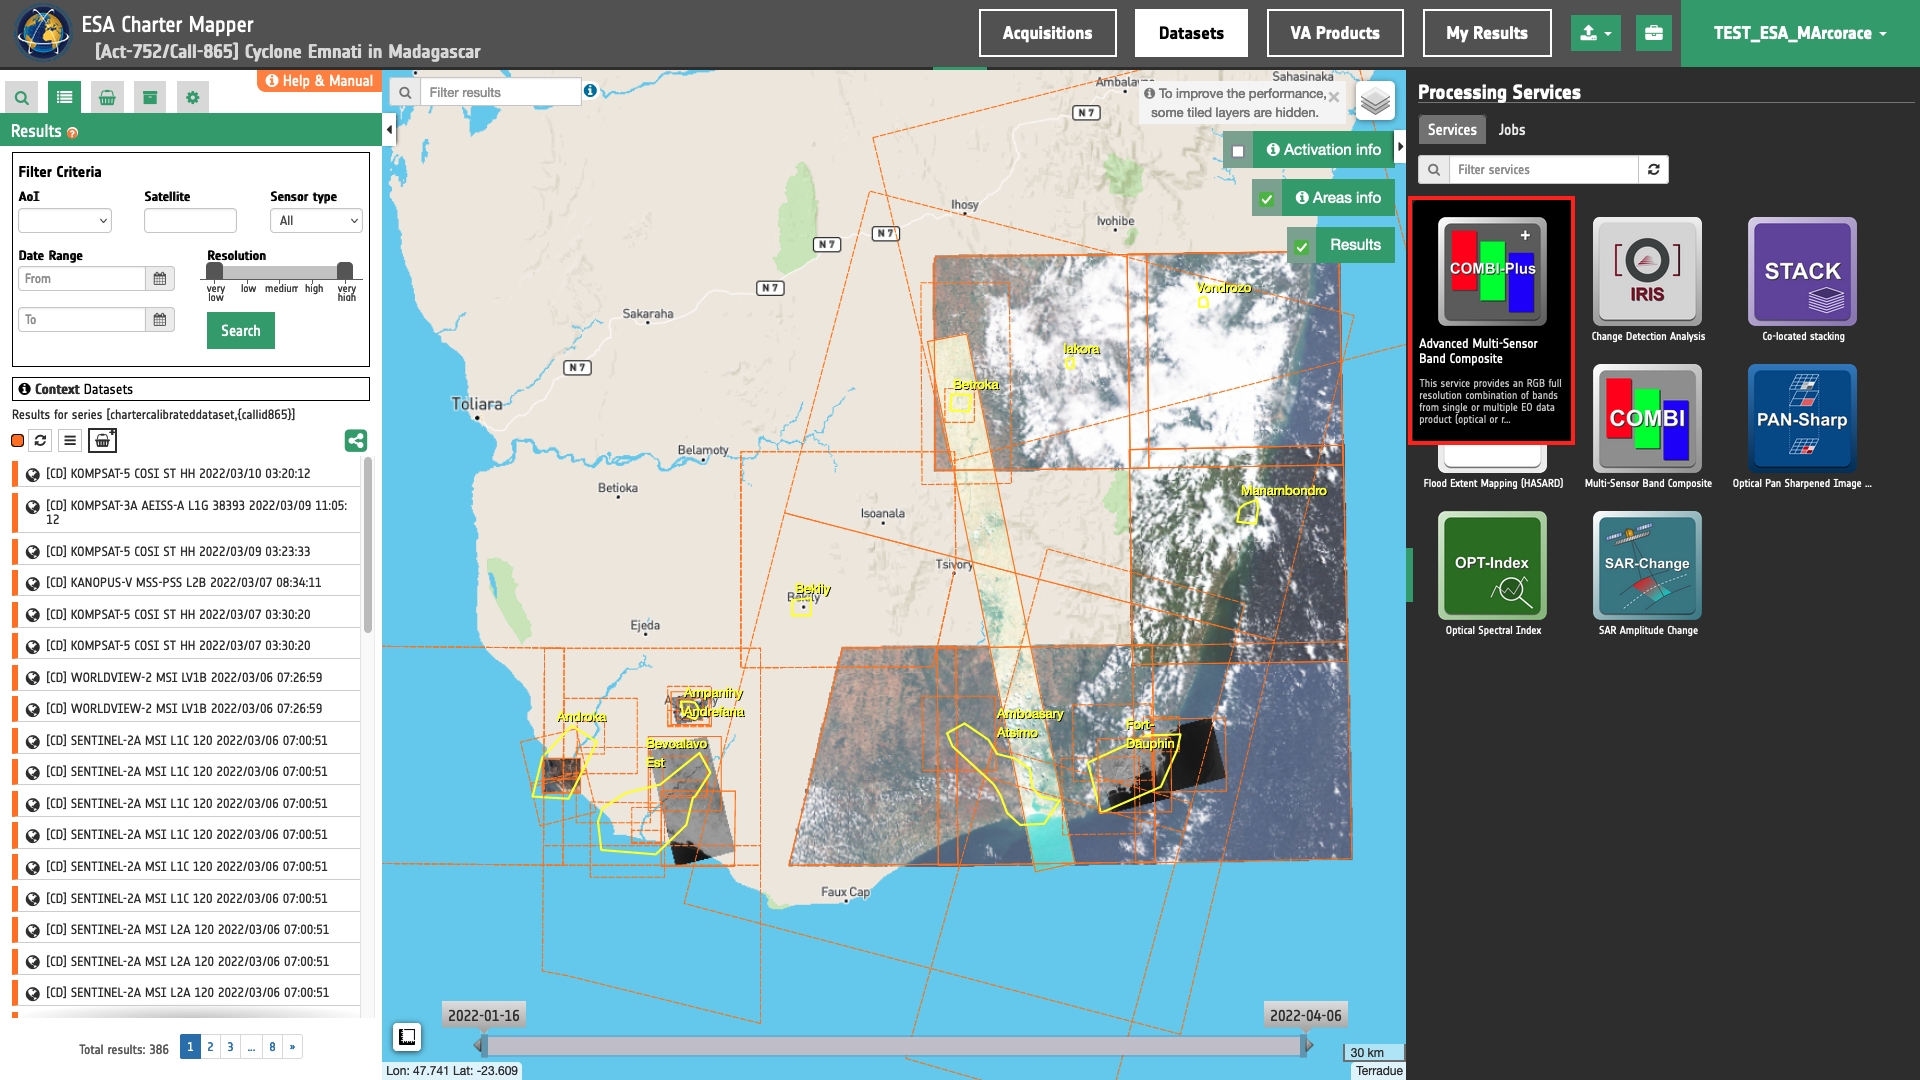
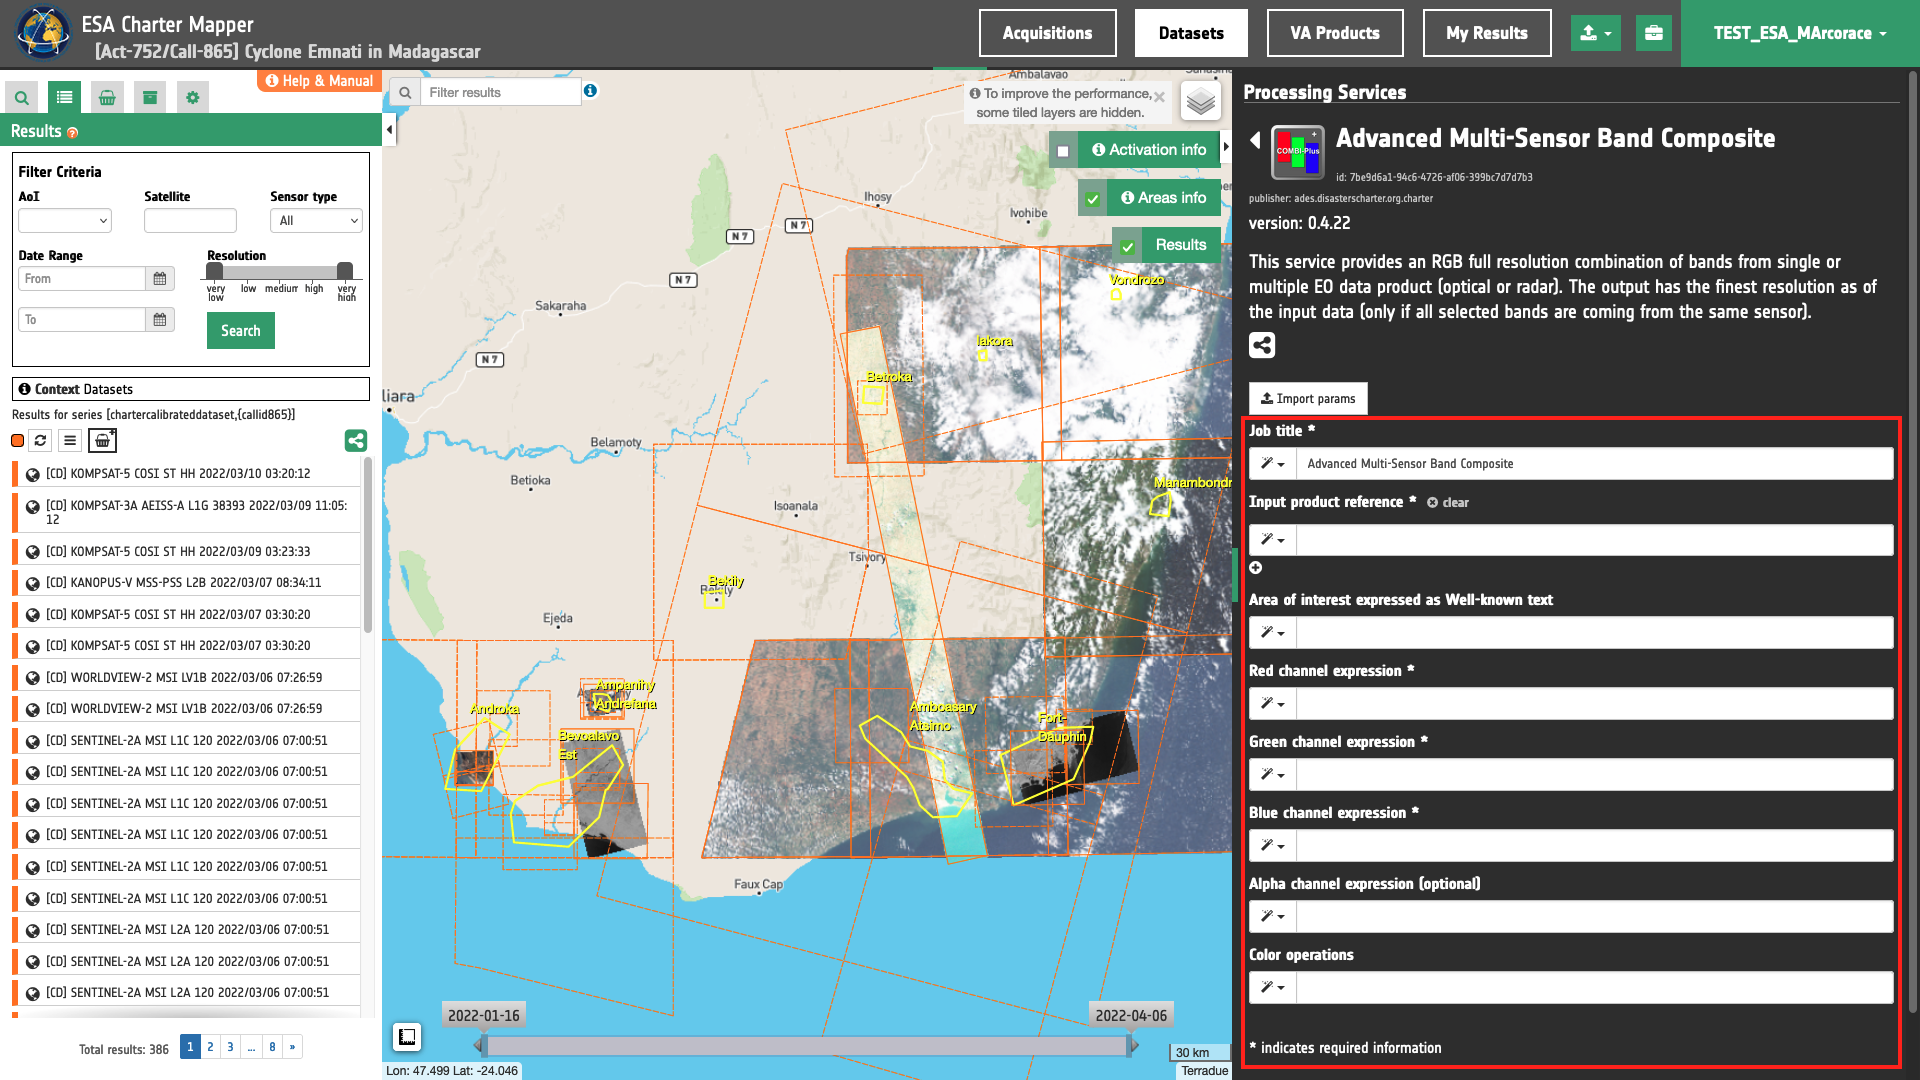
The Advanced Multi-Sensor Band Composite (COMBI-Plus) panel is displayed with a series of parameters values to be filled-in.
Use case 1: visualize green vegetation from Optical EO data
Abstract
This use case explains how to create a binary mask of green vegetation via a binarization of the NDVI (Rouse et al., 1973)1 spectral index from a calibrated Optical EO data and generate a band composite with the binary mask visualized in the green channel.
Find the data using multiple filter criteria
Choose an area in which you want to focus your analysis, e.g near Ampanihy in Madagascar.
From the Navigation and Search toolbar (located in the upper left side of the map), click on Spatial Filter and draw a square in the region around the Ampanihy town. This spatial filter allows you to select only the EO data acquired over this area.
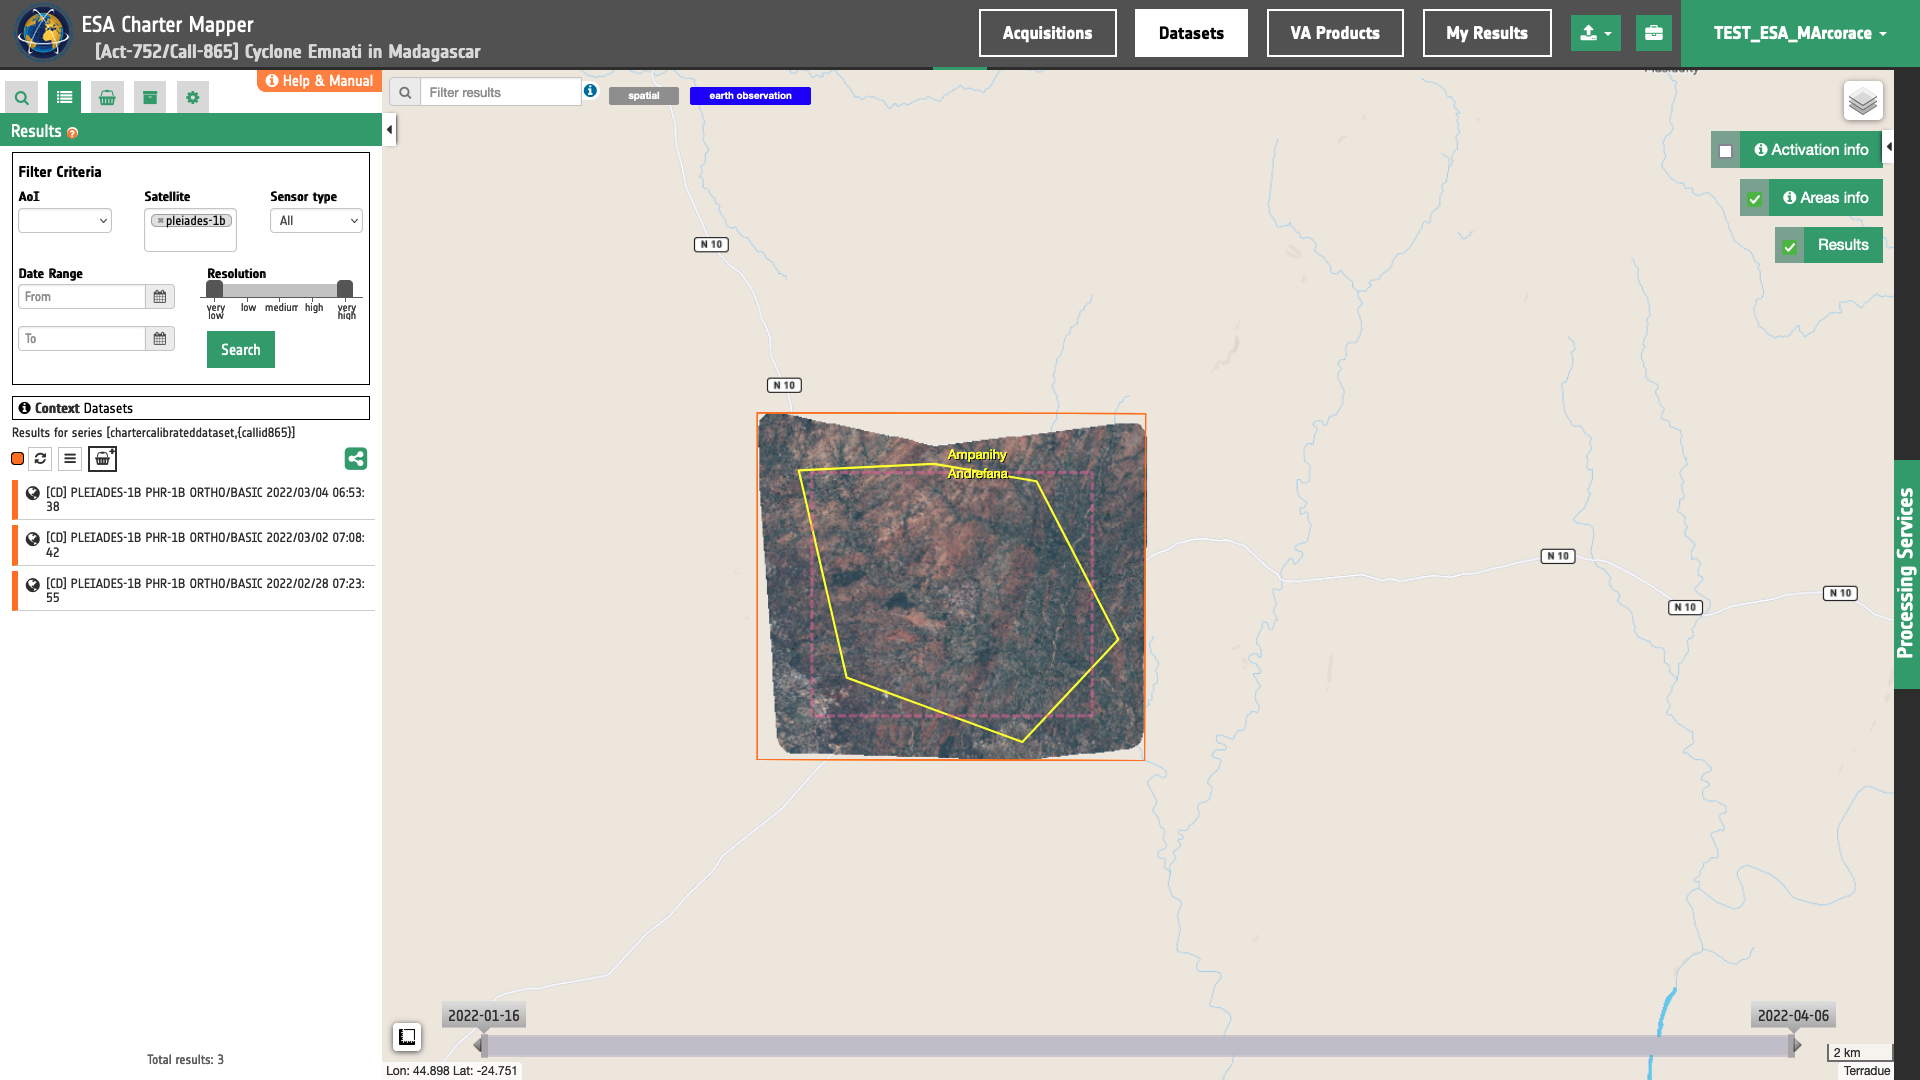
From the top of the left panel, use Filter Criterias to search for Optical and Pleiades-1b data collections from the list.
After this query the list in the Result panel will be updated as the one shown in the image below.
Fill the paramters
After the definition of spatial and time filters, you can employ COMBI-Plus, by combining the two red and nir assets from a Pleiades-1B Calibrated Dataset to generate a false color composite.
To do so you can fill the parameters as described in the following sections.
Job name
Insert as job name:
COMBI-Plus Pleiades-1 Green Vegetation in Madagascar 2022
Reference input
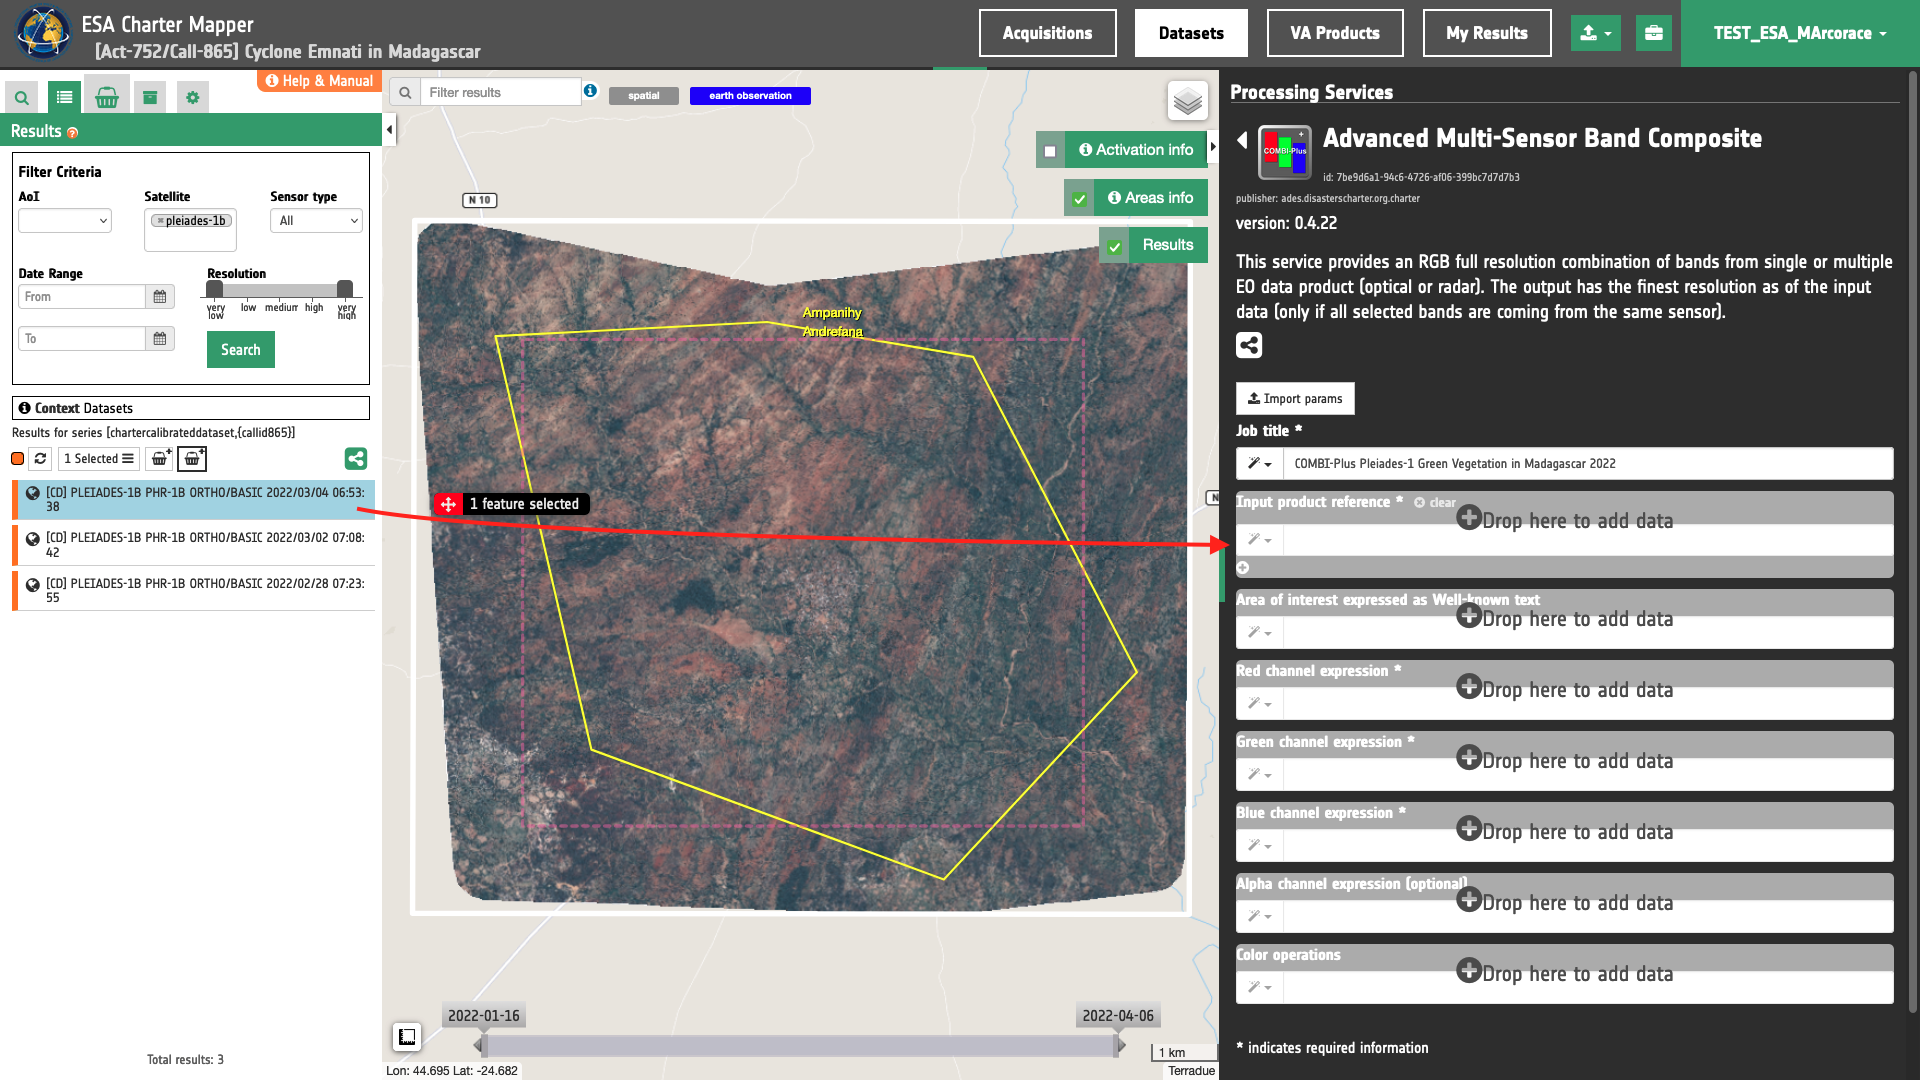
Drag and Drop in the "Input product reference(s)” field the Pleiades-1B calibrated multispectral dataset:
- [CD] PLEIADES-1B PHR-1B ORTHO/BASIC 2022/03/04 06:53:38
Warning
Drag and drop the Dataset (e.g. "[CD] PLEIADES-1B PHR-1B ORTHO/BASIC 2022/03/04 06:53:38") and not the single-band asset (e.g. "red") into the Input product reference(s) field.
Area of interest expressed as Well-known text (optional)
The “Area of interest as Well Known Text” can be defined by using the drawn polygon defined with the area filter.
Tip
In the definition of “Area of interest as Well Known Text” it is possible to apply as AOI the drawn polygon defined with the area filter. To do so, click on the button in the left side of the "Area of interest expressed as Well-known text" box and select the option AOI from the list. The platform will automatically fill the parameter value with the rectangular bounding box which is taken from the current search area in WKT format.
Note
This parameter is optional.
The remaining mandatory parameters to be filled in are four s-expressions, one for each of the RGBA channels.
Red, Green and Blue channel expression
The following three mandatory parameters are dedicate for the definition of s-expressions for the red, green and blue channel.
In this use case we create a binary mask of green vegetation (NDVI>=0.5) and we want to generate a band composite with the binary mask visualized in the green channel.
Thus, insert as red_expression:
(interp 1.nir (asarray 0 10000) (asarray 0 0))
as green_expression:
(where (>= (norm_diff 1.nir 1.red) 0.5) 1 0)
Note
This expression employs the operator where to assign a value=1 to all the pixel of the scene having NDVI >= 0.5. The remaining pixels which do not satisfy this condition are assigned as 0. More information about operators to be used in s-expressions can be found in the COMBI-Plus service specifications.
and as blue_expression:
(interp 1.nir (asarray 0 10000) (asarray 0 0))
Note
S-expressions for Red and Blue channels are just placeholders which returns a binary mask with all values=0.
Warning
S-expressions inserted by the user must be given within brackets. More information about s-expressions syntax can be found in the COMBI-Plus service specifications.
Alpha channel expression (optional)
In this filed insert an s-expression for the alpha channel to set transparency.
To set transparency for pixels having NDVI<0.5, insert as alpha_expression:
(where (>= (norm_diff 1.nir 1.red) 0.5) 1 0)
Tip
When making an RGBA using a binary mask assigned only into one of the RGB channels (e.g. for green), insert the same s-expression also for the alpha expression to have the transparency for all the pixels of the mask having value=0.
Color operations
This is an optional parameter dedicated to the color formula. In this use case this parameter is not used.
Note
This parameter is optional.
Run the job
Click on the button Run Job and see the Running Job. You can monitor job progress through the progress bar.
Results: download and visualization
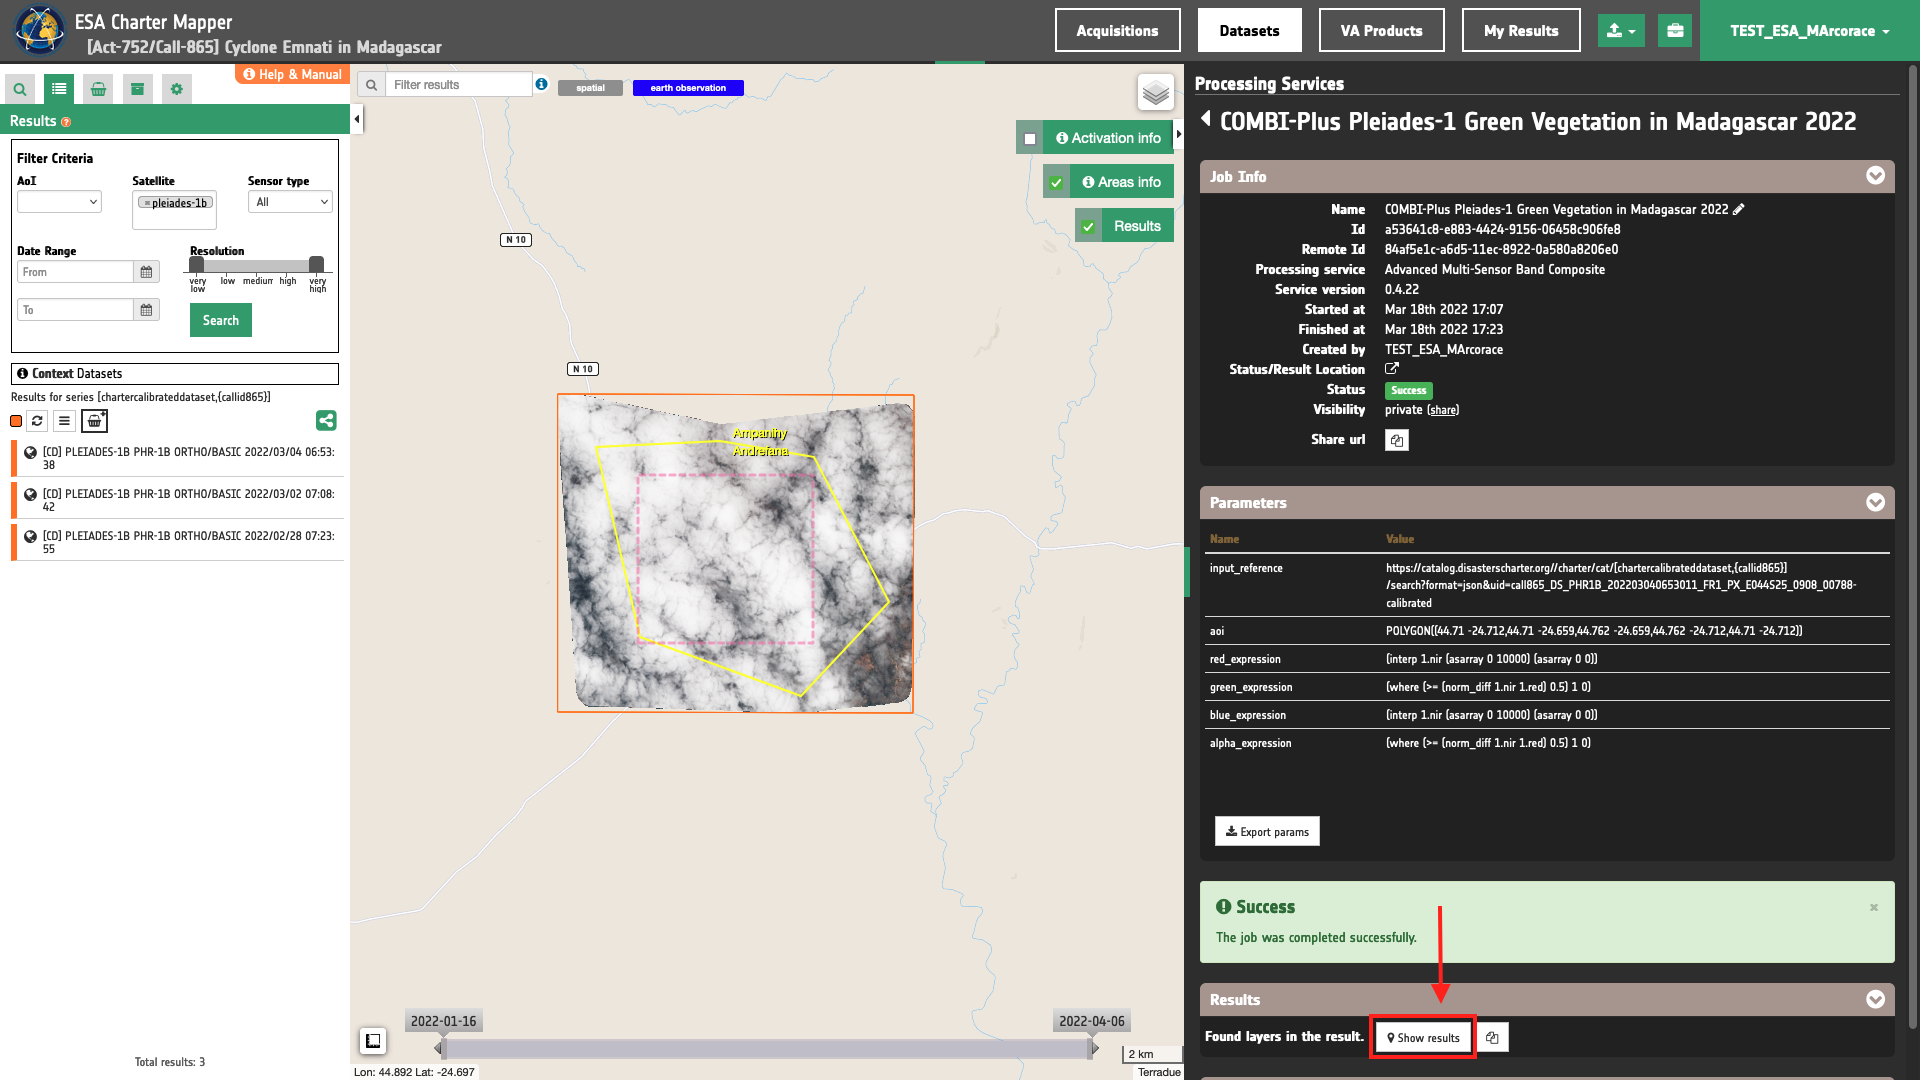
Once the job is completed, click on the button Show results at the bottom of the processing service panel.
Tip
You can also save the parameters employed in this job by clicking on the Export params button in the right panel. This allows you to copy all your entries to the clipboard. This is meant to be used for a quick re-submission of a similar job after a fine tuning of the parameters (e.g. to add a color formula later).
Below is reported the syntax which includes all the parameters employed in this example.
{
   "input_reference": "https://catalog.disasterscharter.org//charter/cat/[chartercalibrateddataset,{callid865}]/search?format=json&uid=call865_DS_PHR1B_202203040653011_FR1_PX_E044S25_0908_00788-calibrated",
   "aoi": "POLYGON((44.71 -24.712,44.71 -24.659,44.762 -24.659,44.762 -24.712,44.71 -24.712))",
   "red_expression": "(interp 1.nir (asarray 0 10000) (asarray 0 0))",
   "green_expression": "(where (>= (norm_diff 1.nir 1.red) 0.5) 1 0)",
   "blue_expression": "(interp 1.nir (asarray 0 10000) (asarray 0 0))",
   "alpha_expression": "(where (>= (norm_diff 1.nir 1.red) 0.5) 1 0)"
}
Visualization
See the result on the map. The preview appears within the area defined in the spatial filter.
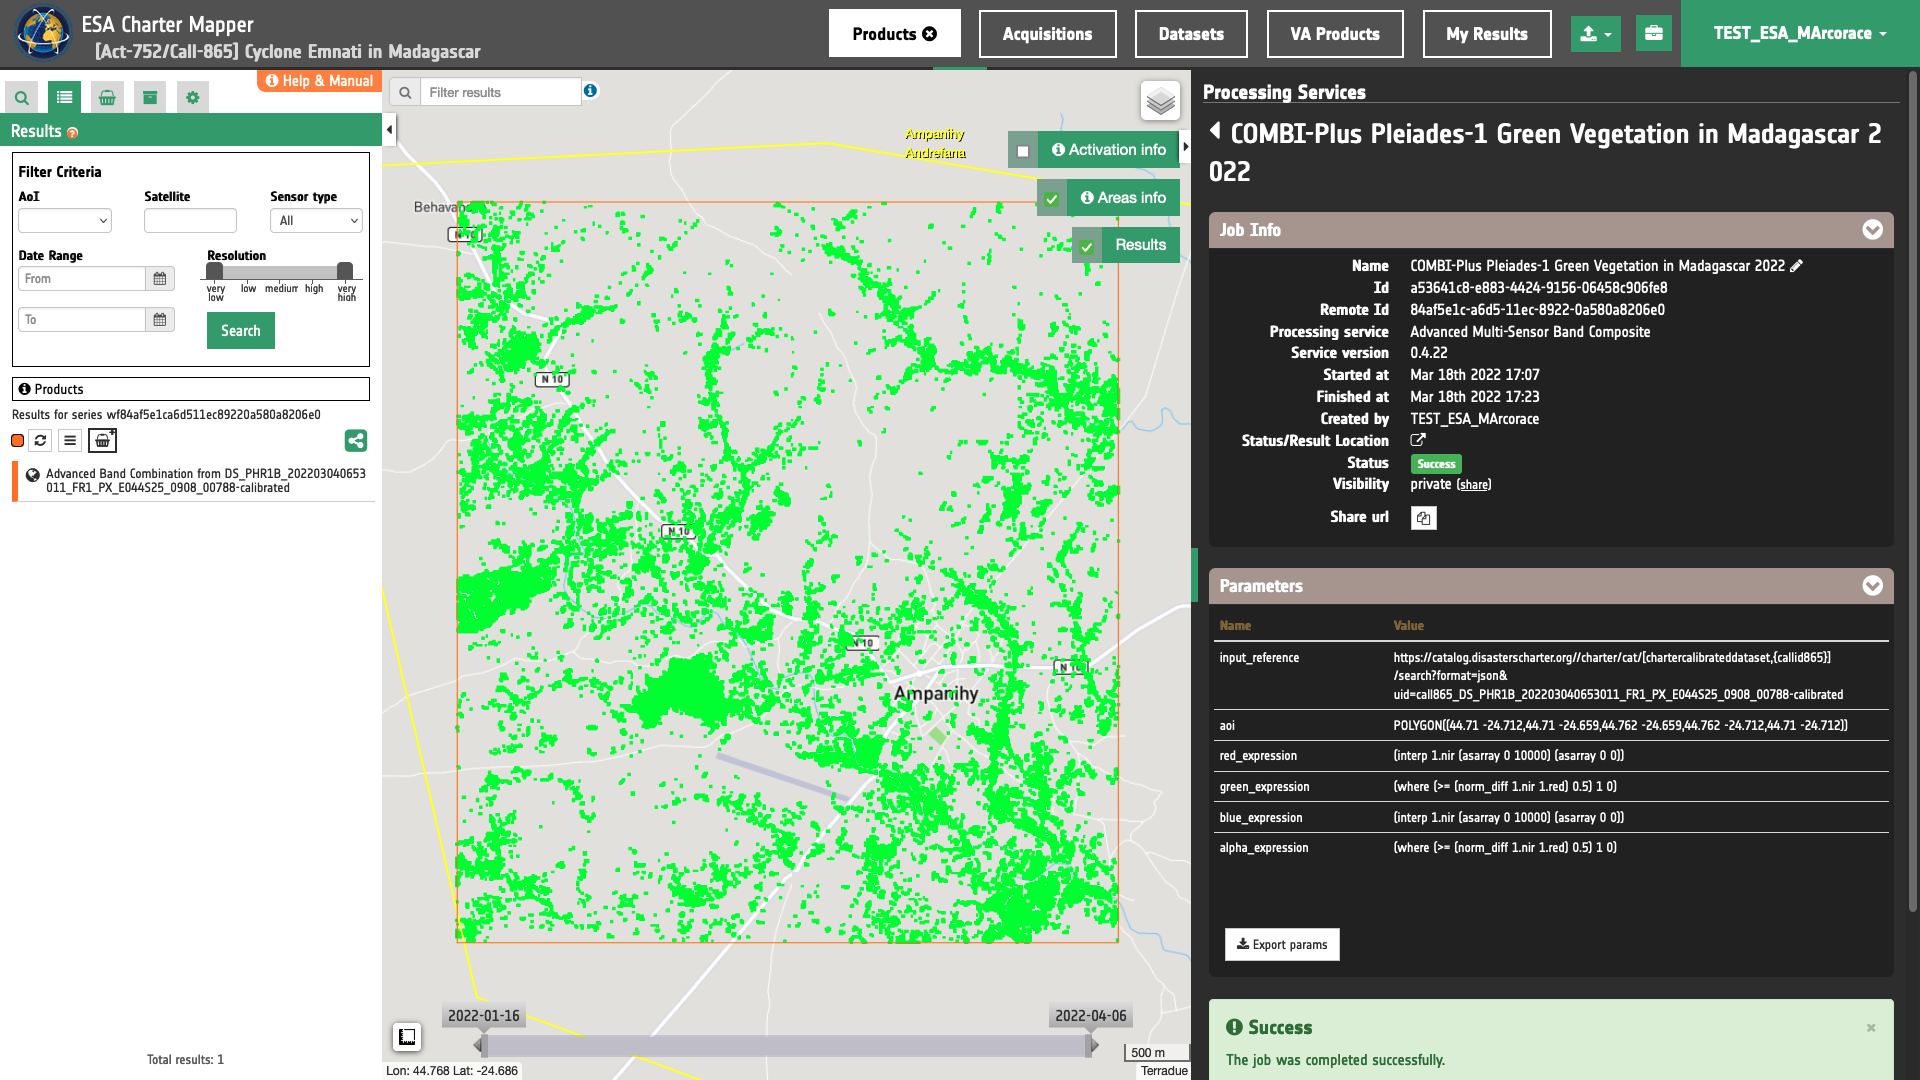
To get more information about the product just click on the preview in the map, a bubble showing the name of the layer “Advanced Band Combination from DS_PHR1B_202203040653011_FR1_PX_E044S25_0908_00788-calibrated" will appear and then click on the Show details button.
Tip
To quickly access Product Details double click on the layer from the Results list.
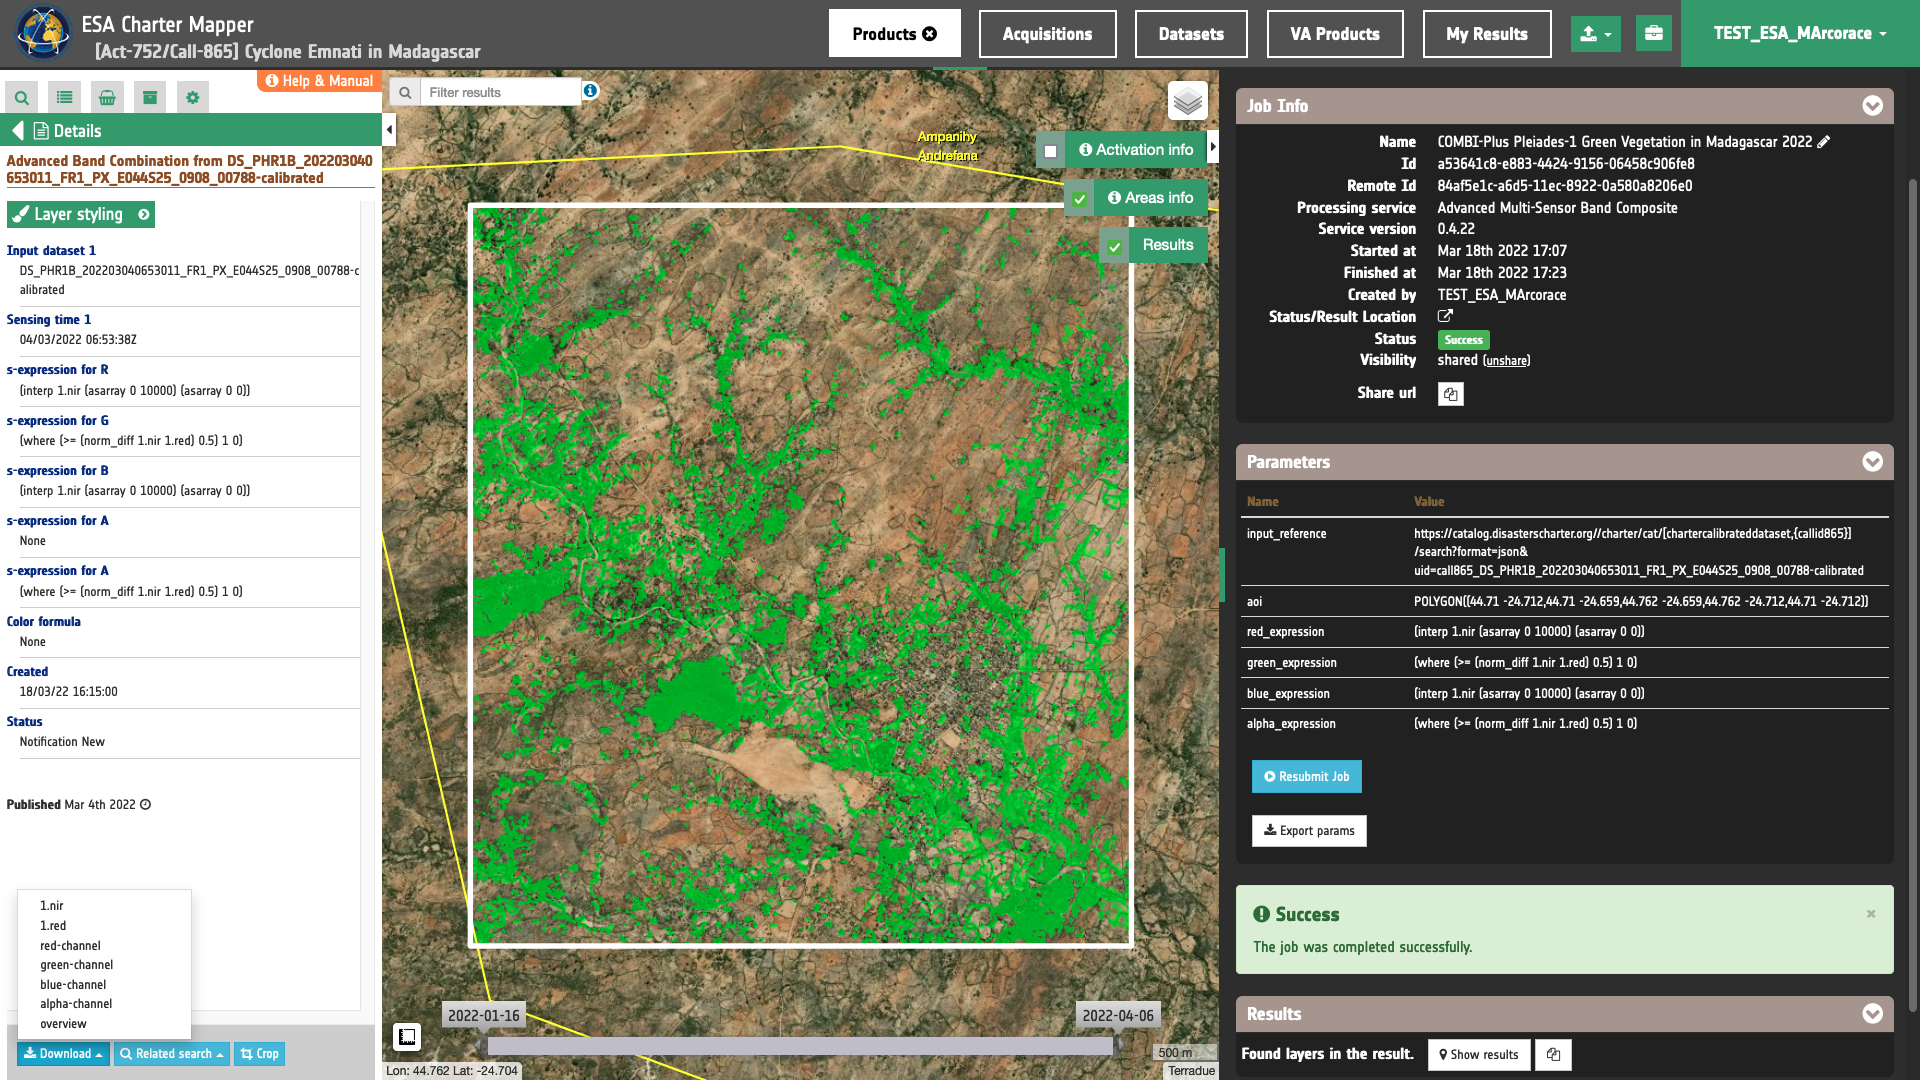
In the left panel of the interface, the details of Job Result will appear with Product metadata. Furthermore, by clicking on Layer styling you can also access to the View options. In here it is possible to see histogram/s of the Product which is visible in the map, set color formula, change Filters (e.g. Brightness, Opacity).
Tip
To visually compare the product overview with the underlying base layer (e.g. e.g. Natural Earth or Dark map) you can set the Opacity filter under View options as 60%.
Note
In the co-location of input Assets, the output overview and the processed Geophysical Assets have GSD equal to the finest resolution of all input Asset. When necessary, Assets are re-projected using the most common EPSG code of the input Assets.
Download
In this first use case the Advanced Multi-Sensor Band Composite (COMBI-Plus) service returned as output the following products:
- 1.nir: single band asset
nirproduct from reference optical calibrated dataset no. 1, as single band GeoTIFF in COG format, - 1.red: single band asset
redproduct from reference optical calibrated dataset no. 1, as single band GeoTIFF in COG format, - overview: output multi-sensor-composite product given as 4 bands RGBA 8-bit GeoTIFF in COG format
- red-channel: R-channel product from Multi-sensor-composite RGBA given as single band 8-bit GeoTIFF in COG format,
- green-channel: G-channel product from Multi-sensor-composite RGBA given as single band 8-bit GeoTIFF in COG format,
- blue-channel: B-channel product from Multi-sensor-composite RGBA given as single band 8-bit GeoTIFF in COG format,
- alpha-channel: A-channel product from Multi-sensor-composite RGBA given as single band 8-bit GeoTIFF in COG format.
These products can be downloaded by clicking on the Download button located at the bottom of the Product Details tab in the left panel.
Use case 2: visualize satellite-detected waters from SAR EO data
Abstract
This use case explains how to create a satellite-detected water binary mask via the binarization of radar backscatter from a calibrated SAR EO data and generate a band composite with the binary mask visualized in the blue channel.
Find the data using multiple filter criteria
Choose an area in which you want to focus your analysis, e.g near Sukhothai, Sawankhalok in Thailand.
From the Navigation and Search toolbar (located in the upper left side of the map), click on Spatial Filter and draw a square in the region around the Sukhothai town. This spatial filter allows you to select only the EO data acquired over this area.
From the top of the left panel, use Filter Criterias to search for Radar and rcm data collections from the list.
After this query the list in the Result panel will be updated as the one shown in the image below.
Fill the paramters
After the definition of spatial and time filters, you can employ COMBI-Plus, by combining the s0_db_c_hh asset from a RCM-2 Calibrated Dataset to generate a false color composite.
To do so you can fill the parameters as described in the following sections.
Job name
Insert as job name:
COMBI-Plus RCM-2 Satellite Detected Waters Flood in Thailand 29/09/2021
Reference input
Drag and Drop in the "Input product reference(s)” field the RCM calibrated dataset:
- [CD] RCM-2 GRD 5M HH/HV 2021/09/29 11:36:39
Warning
Drag and drop the Dataset (e.g. "[CD] RCM-2 GRD 5M HH/HV 2021/09/29 11:36:39") and not the single-band asset (e.g. "s0_db_c_hh") into the Input product reference(s) field.
Area of interest expressed as Well-known text (optional)
The “Area of interest as Well Known Text” can be defined by using the drawn polygon defined with the area filter.
Tip
In the definition of “Area of interest as Well Known Text” it is possible to apply as AOI the drawn polygon defined with the area filter. To do so, click on the button in the left side of the "Area of interest expressed as Well-known text" box and select the option AOI from the list. The platform will automatically fill the parameter value with the rectangular bounding box which is taken from the current search area in WKT format.
Note
This parameter is optional.
The remaining mandatory parameters to be filled in are four s-expressions, one for each of the RGBA channels.
Red, Green and Blue channel expression
The following three mandatory parameters are dedicate for the definition of s-expressions for the red, green and blue channel.
In this use case we create a binary mask of satellite deteceted waters from binarization (Sigma Nought<=23dB) and we want to generate a band composite with the binary mask visualized in the blue channel.
Thus, insert as red_expression and green_expression the following s-expression
(interp 1.s0_db_c_hh (asarray -20 5) (asarray 0 0))
Note
This s-expression applyed for Red and Greeb channels is just a placeholders which returns a binary mask with all values=0.
and as blue_expression:
(where (<= 1.s0_db_c_hh -23) 1 0)
Note
This expression employs the operator where to assign a value=1 to all the pixel of the scene having Sigma0 <= -23 dB. The remaining pixels which do not satisfy this condition are assigned as 0. More information about operators to be used in s-expressions can be found in the COMBI-Plus service specifications.
Warning
S-expressions inserted by the user must be given within brackets. More information about s-expressions syntax can be found in the COMBI-Plus service specifications.
Alpha channel expression (optional)
In this filed insert an s-expression for the alpha channel to set transparency.
To set transparency for pixels having Sigma0 > -23dB, insert as alpha_expression:
(where (<= 1.s0_db_c_hh -23) 1 0)
Tip
When making an RGBA using a binary mask assigned only into one of the RGB channels (e.g. for blue), insert the same s-expression also for the alpha expression to have the transparency for all the pixels of the mask having value=0.
Color operations
This is an optional parameter dedicated to the color formula. In this use case this parameter is not used.
Note
This parameter is optional.
Run the job
Click on the button Run Job and see the Running Job. You can monitor job progress through the progress bar.
Results: download and visualization
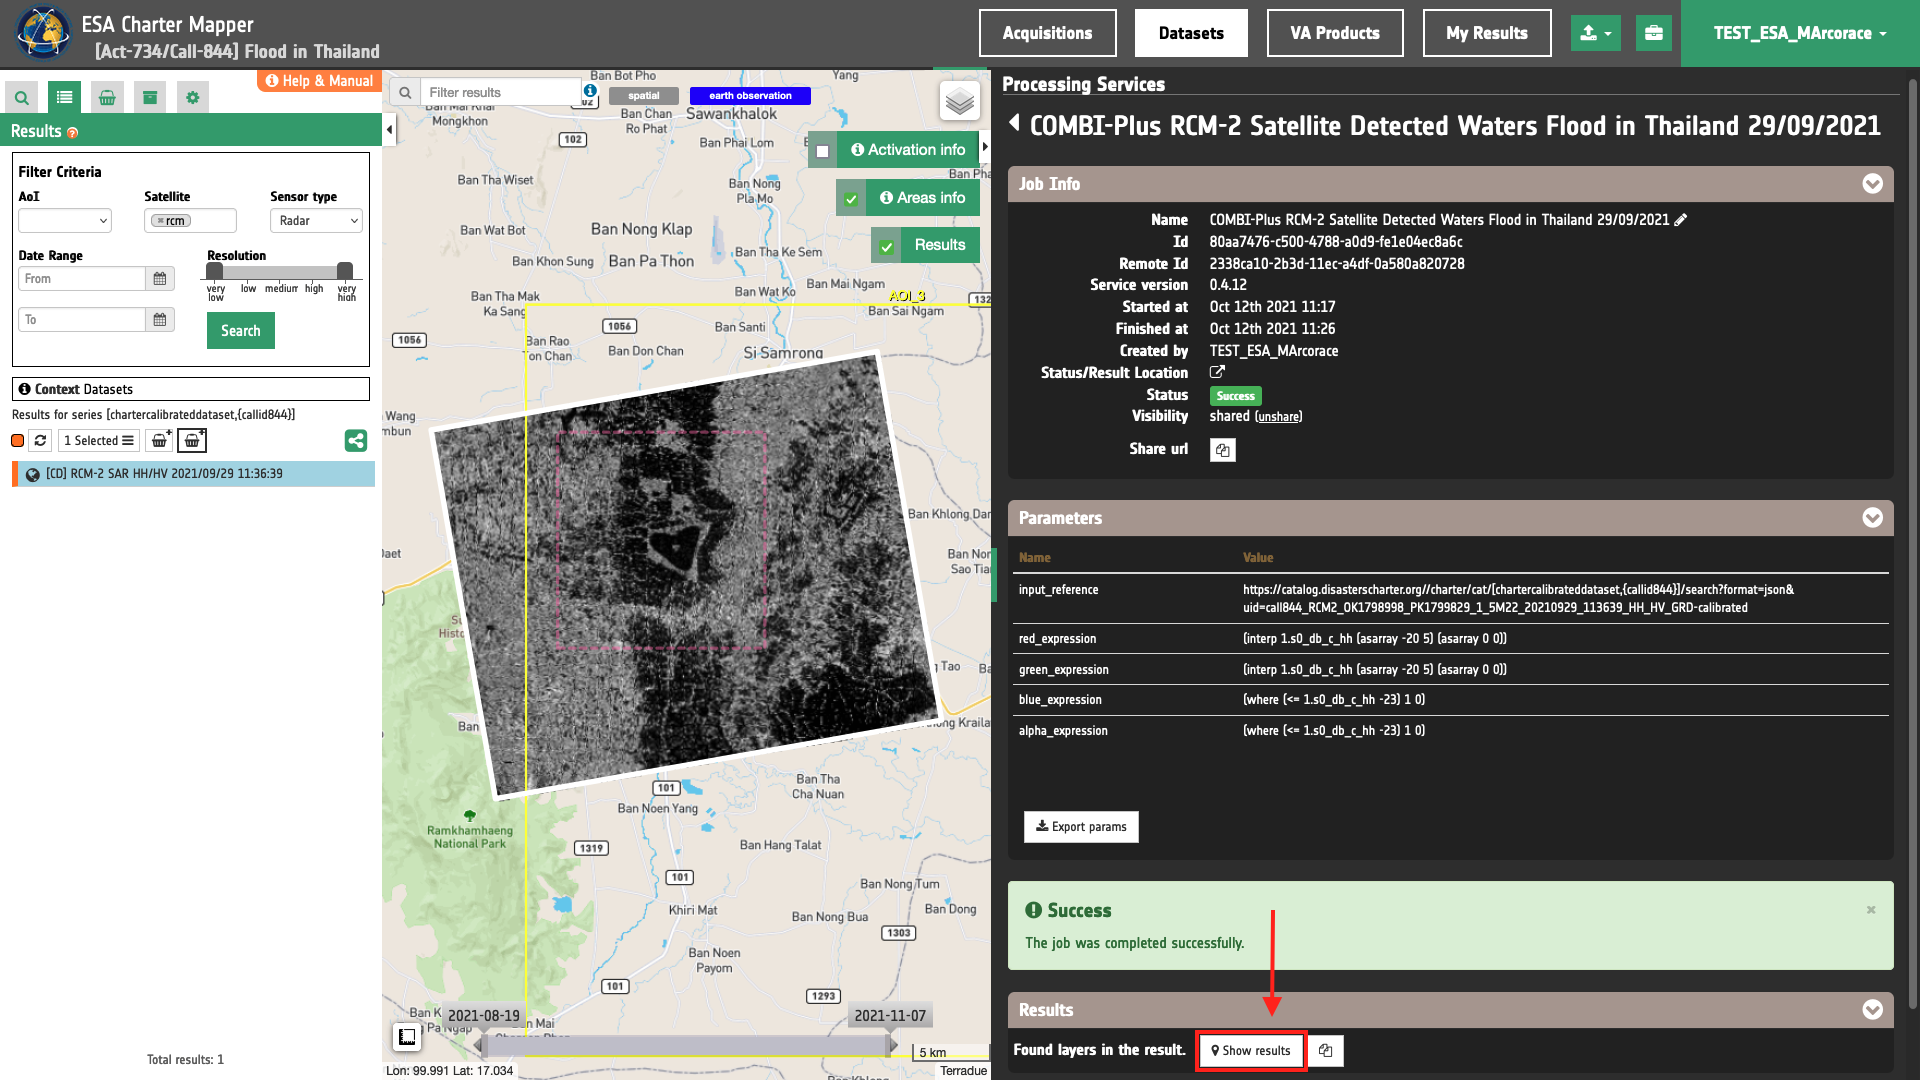
Once the job is completed, click on the button Show results at the bottom of the processing service panel.
Tip
You can also save the parameters employed in this job by clicking on the Export params button in the right panel. This allows you to copy all your entries to the clipboard. This is meant to be used for a quick re-submission of a similar job after a fine tuning of the parameters (e.g. to add a color formula later).
Below is reported the syntax which includes all the parameters employed in this example.
{
   "input_reference": "https://catalog.disasterscharter.org//charter/cat/[chartercalibrateddataset,{callid844}]/search?format=json&uid=call844_RCM2_OK1798998_PK1799829_1_5M22_20210929_113639_HH_HV_GRD-calibrated",
   "red_expression": "(interp 1.s0_db_c_hh (asarray -20 5) (asarray 0 0))",
   "green_expression": "(interp 1.s0_db_c_hh (asarray -20 5) (asarray 0 0))",
   "blue_expression": "(where (<=  1.s0_db_c_hh -23) 1 0)",
   "alpha_expression": "(where (<=  1.s0_db_c_hh -23) 1 0)"
}
Visualization
See the result on the map. The preview appears within the area defined in the spatial filter.
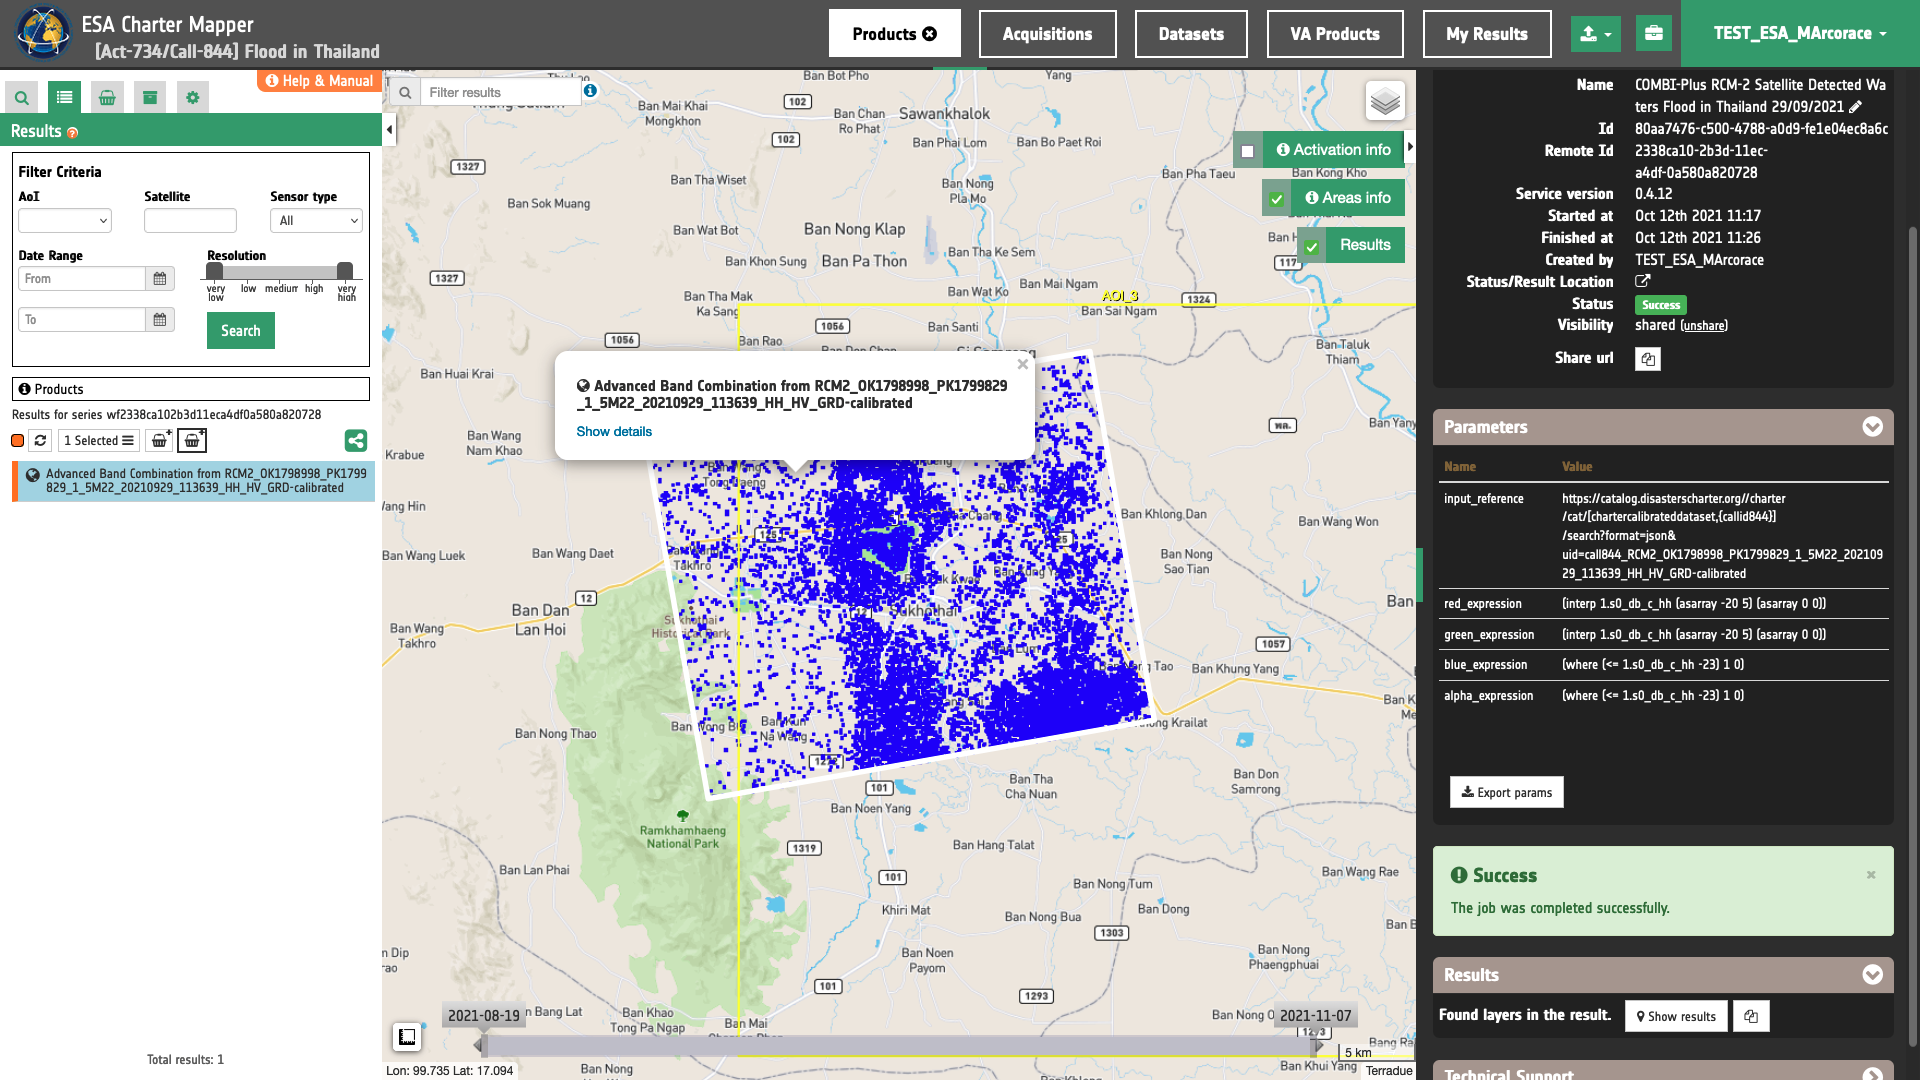
To get more information about the product just click on the preview in the map, a bubble showing the name of the layer “ " will appear and then click on the Show details button.
Tip
To quickly access Product Details double click on the layer from the Results list.
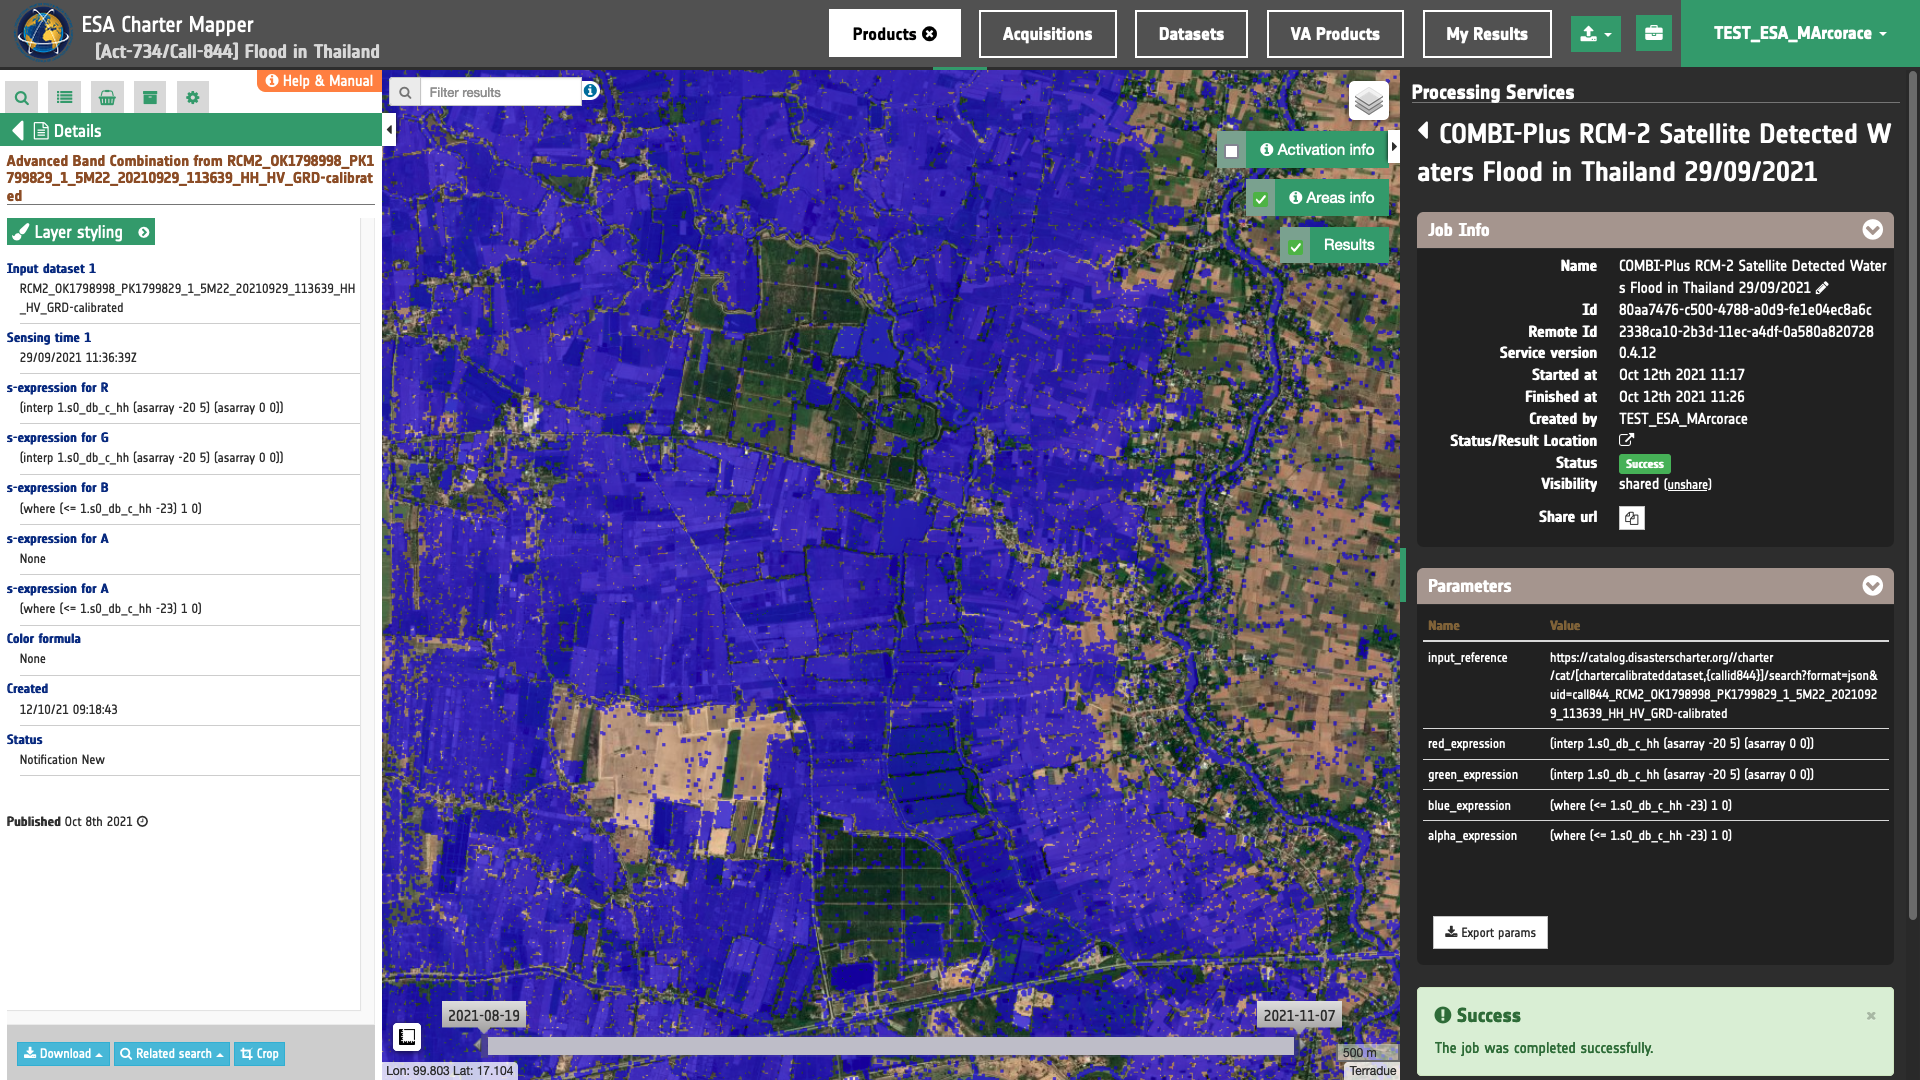
In the left panel of the interface, the details of Job Result will appear with Product metadata. Furthermore, by clicking on Layer styling you can also access to the View options. In here it is possible to see histogram/s of the Product which is visible in the map, set color formula, change Filters (e.g. Brightness, Opacity).
Tip
To visually compare the product overview with the underlying base layer (e.g. e.g. Natural Earth or Dark map) you can set the Opacity filter under View options as 60%.
Note
In the co-location of input Assets, the output overview and the processed Geophysical Assets have GSD equal to the finest resolution of all input Asset. When necessary, Assets are re-projected using the most common EPSG code of the input Assets.
Download
In this first use case the Advanced Multi-Sensor Band Composite (COMBI-Plus) service returned as output the following products:
- 1.s0_db_c_hh: single band asset
s0_db_c_hhproduct from reference SAR calibrated dataset no. 1, as single band GeoTIFF in COG format, - overview: output multi-sensor-composite product given as 4 bands RGBA 8-bit GeoTIFF in COG format
- red-channel: R-channel product from Multi-sensor-composite RGBA given as single band 8-bit GeoTIFF in COG format,
- green-channel: G-channel product from Multi-sensor-composite RGBA given as single band 8-bit GeoTIFF in COG format,
- blue-channel: B-channel product from Multi-sensor-composite RGBA given as single band 8-bit GeoTIFF in COG format,
- alpha-channel: A-channel product from Multi-sensor-composite RGBA given as single band 8-bit GeoTIFF in COG format.
These products can be downloaded by clicking on the Download button located at the bottom of the Product Details tab in the left panel.
-
Rouse J., Haas R. H., Schell J. A., Deering D. (1973), “Monitoring vegetation systems in the great plains with ERTS”, NASA. Goddard Space Flight Center 3d ERTS-1 Symp., Vol. 1, Sect. A. Available at: ntrs.nasa.gov ↩