EO data visualization
Full resolution browse (Overviews)
To support the Charter Project Manager (PM) and the Value Adders (VA) in the context of activations, the COS-2 system is being augmented with a capability to access EO data on-line and conduct visual analysis. The ESA Charter Mapper allows the users to visualize EO data imported, pre-processed and available in the workspace.
In the workspace provided by the ESA Charter Mapper the PM/VA is able to visualize the EO data of a Charter activation at the highest possible resolution. Thus in the Activation Workspace, PM/VA can display EO data at full resolution directly with one click in the map.
The visualization of the data at full resolution for most of the commercial EO data supported by the ESA Charter Mapper is ruled by terms and conditions of the license agreement of the product delivered by an agency in the framework of the International Charter "Space and Major Disasters". Only authorized users after the sign-in of the EULA can visualize the EO data at full resolution and use it for processing in the ESA Charter Mapper. Without signing the license the users can only visualize in the ESA Charter Mapper overviews at low resolution. More information about how to sign the license for a commercial EO data product in the ESA Charter mapper can be found here
The background pre-processing services provide the user with directly usable geospatial information with basic services to support image analysis. In Datasets, the ESA Charter Mapper extracts intra-product components within an EO data product, single bands or three bands grouped in the form of a Red, Green and Blue (RGB) composite.
To ease visualization and analysis, the ESA Charter Mapper can also provide custom composites representing parameters obtained by computation using single bands. Single bands and groups of bands are referred to as assets. Several assets can be derived from a single EO data product.
They are pre-defined in the Charter Mapper implemented by ESA and can be used directly (Select Asset) or combined ad-hoc by the user (Combine Assets) within the Titiler widget. More details about TiTiler are available here.
Pre-defined RGB composites using Select Asset
Intra-sensor single-band and overview products available for a Dataset can be visualized in the map by selecting a desired product under Details > View Options > Select Asset from the left panel of the interface (See Figure 1). The pre-defined Overview products are derived as a full resolution RGBA georeferenced image obtained with different pre-defined band combinations by combining the single-band assets included in the Dataset. Overviews products at full resolution are available in the ESA Charter Mapper for both optical and SAR data.
Multiple types of pre-defined overviews products are available in the ESA Charter Mapper for optical data. In Figure 1 is shown an example of overview product which can be immediately displayed in the map from a calibrated multispectral Pleiades-1A Dataset: the True Color RGB composite (overview-trc).
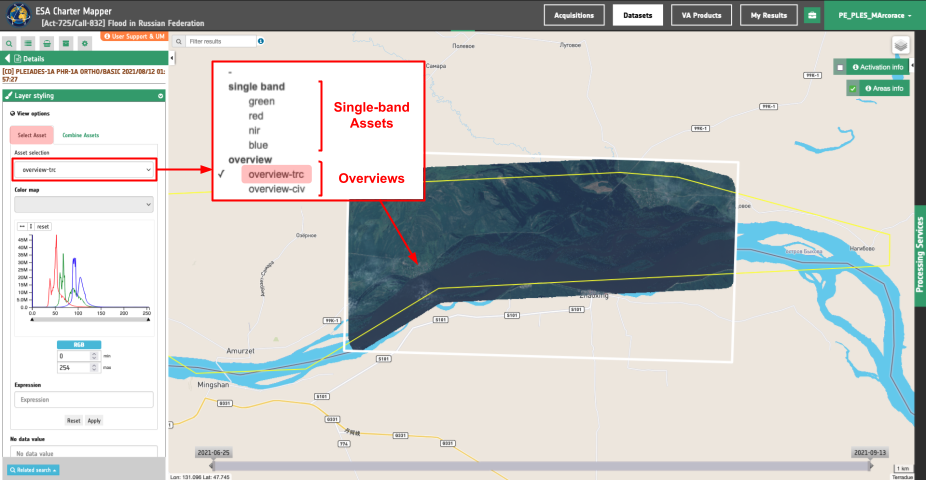
Figure 1 - A sample usage of the Select Asset function available under View Options from the Details of a Pleiades-1A Dataset calibrated by the ESA Charter Mapper over the Russian Federation (Image credit: AIRBUS, CNES).
Also, in the below Figures 2, 3, 4, and 5 are shown examples of overview products that the ESA Charter Mapper systematically derives from a calibrated Landsat-8 Dataset.
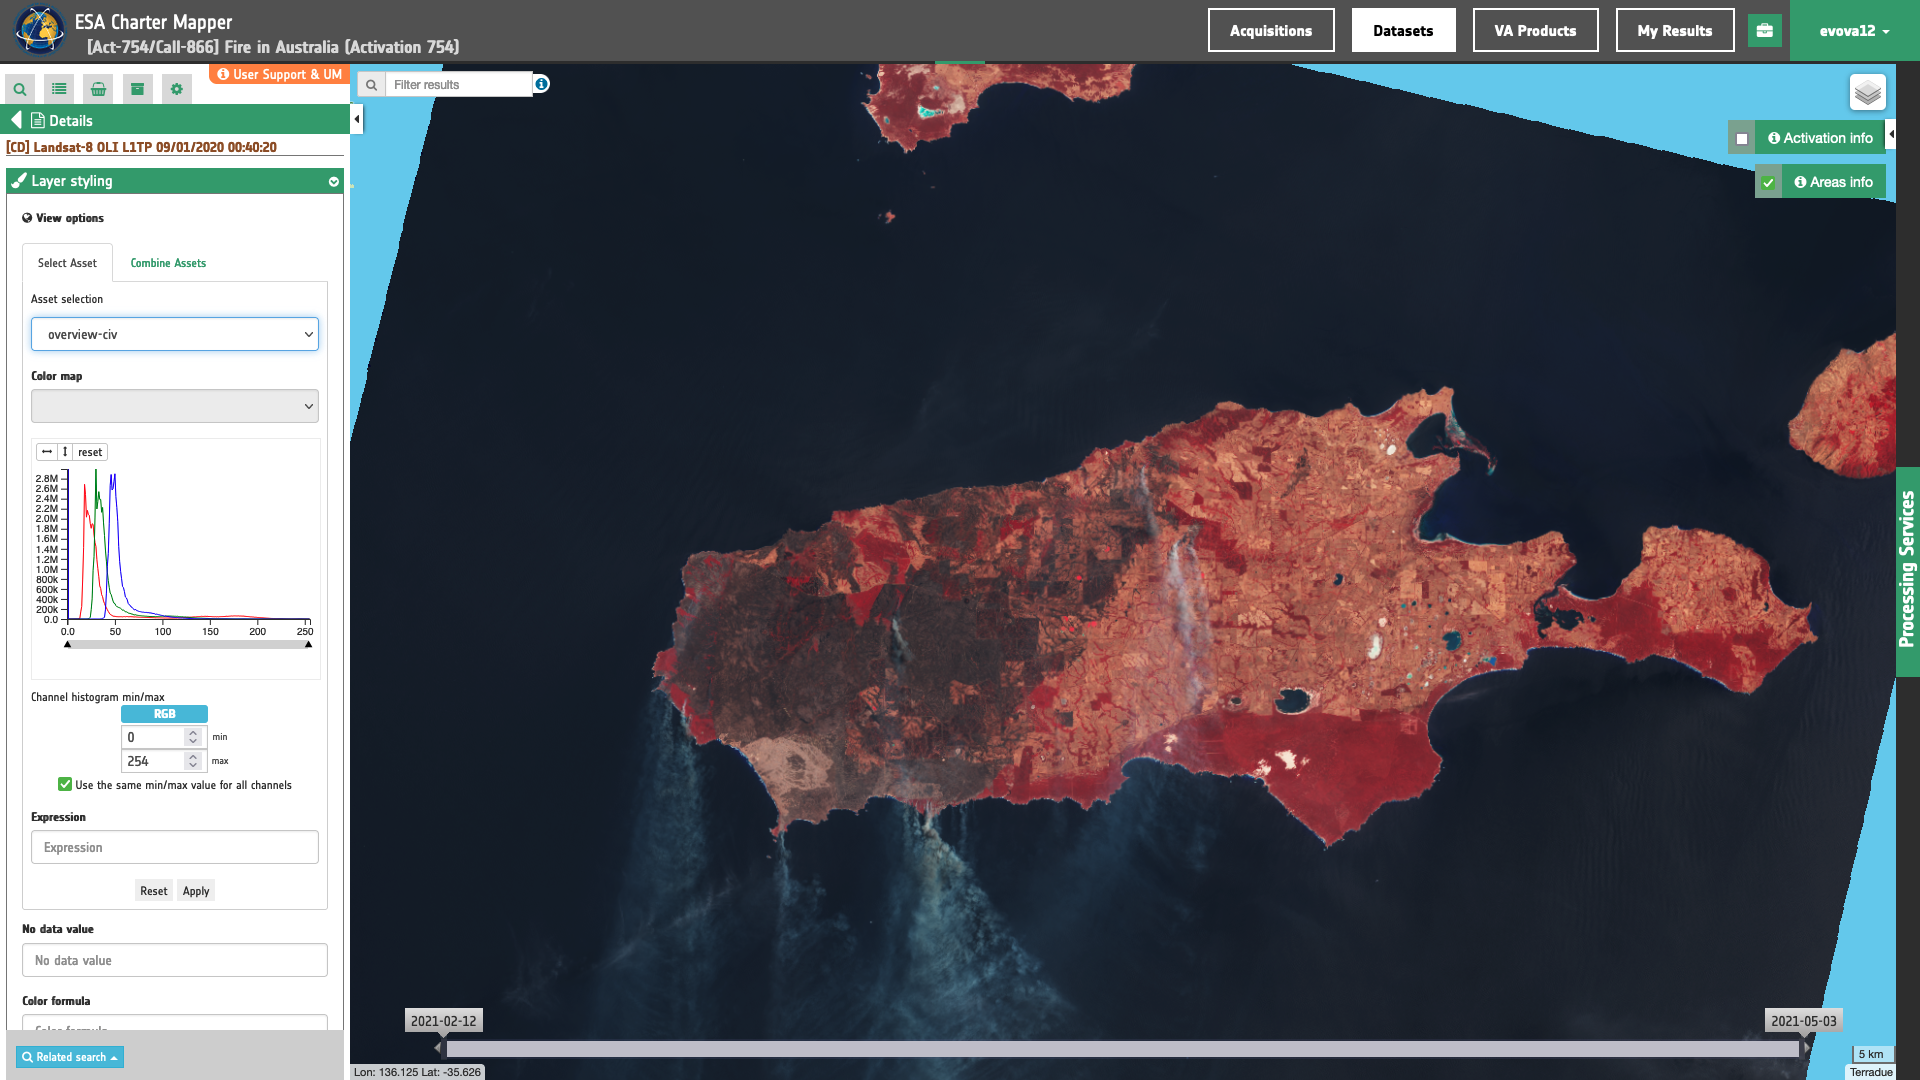
Figure 2 - Color Infrared Vegetation (CIV) RGB composite from Landsat-8 data acquired over the Kangaroo island in Australia (Image credit: USGS).
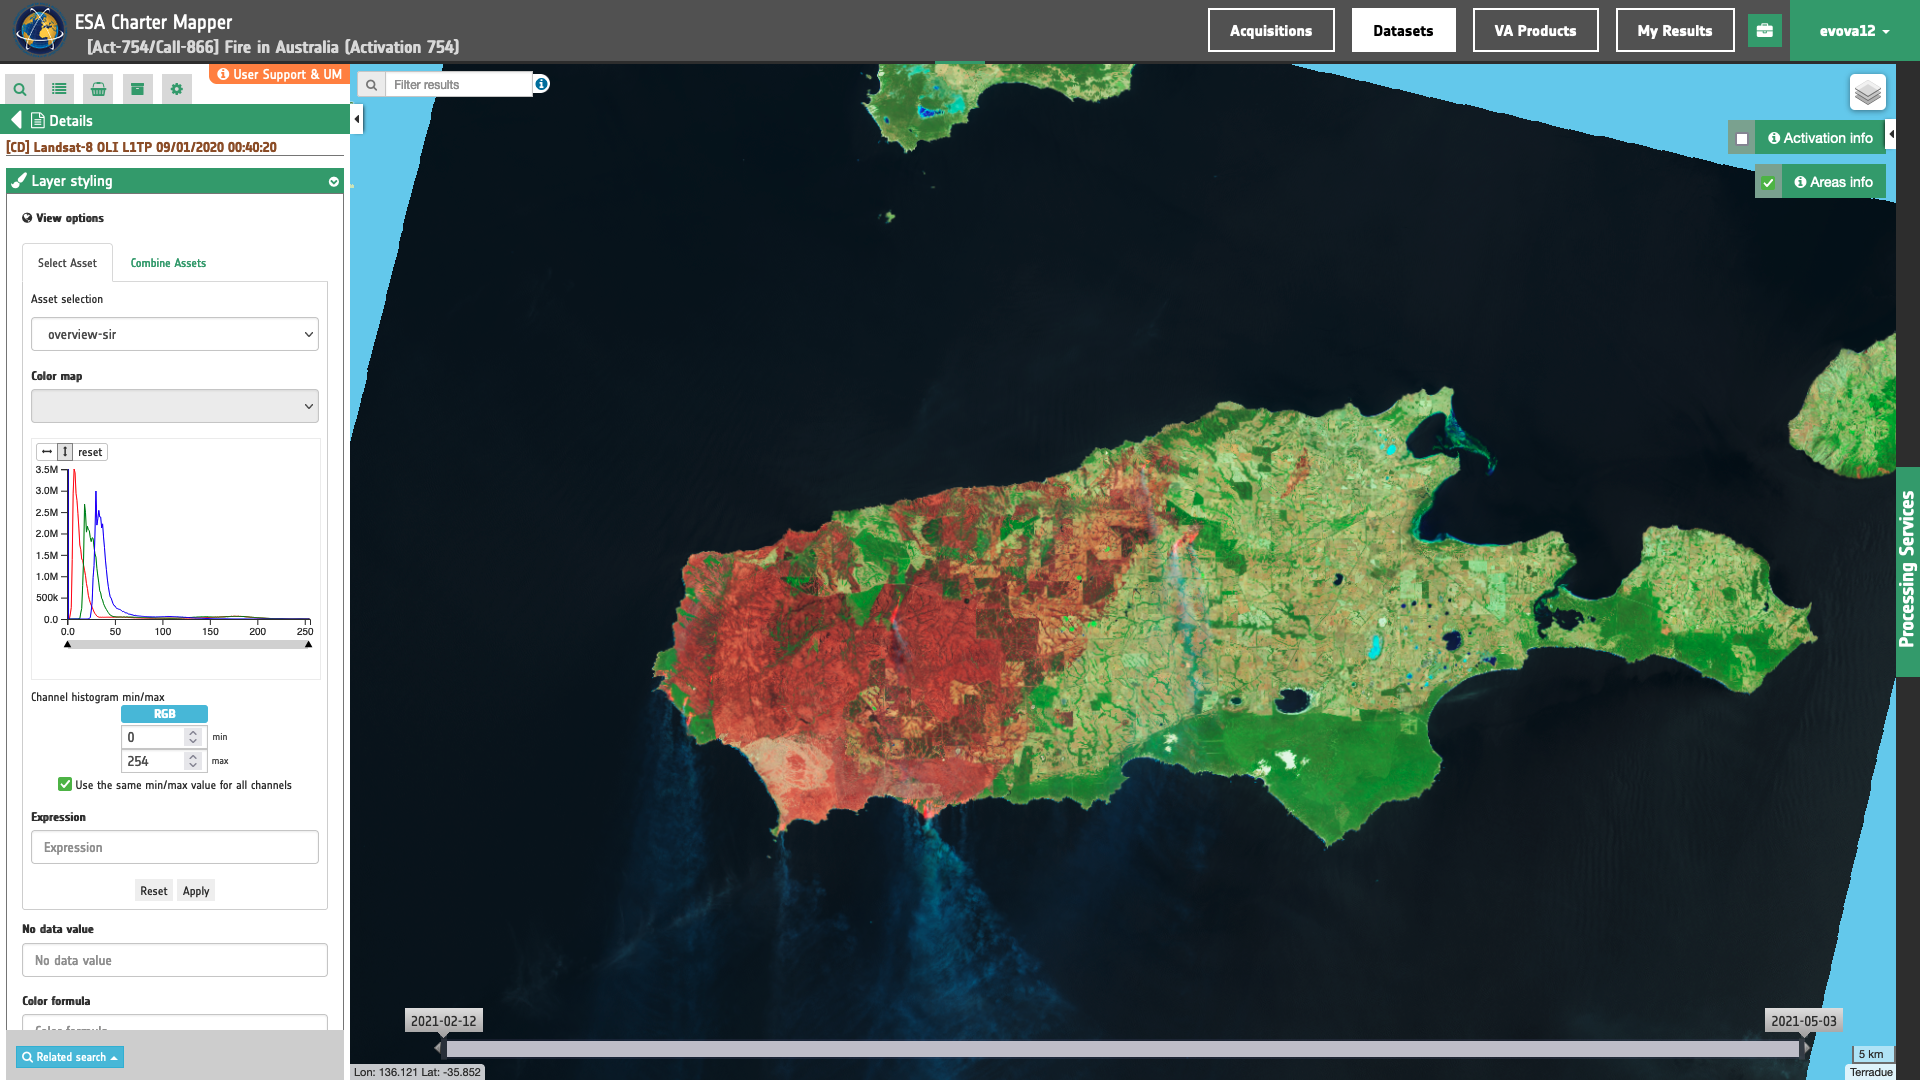
Figure 3 - Shortwave Infrared (SIR) RGB composite from Landsat-8 data acquired over the Kangaroo island in Australia (Image credit: USGS).
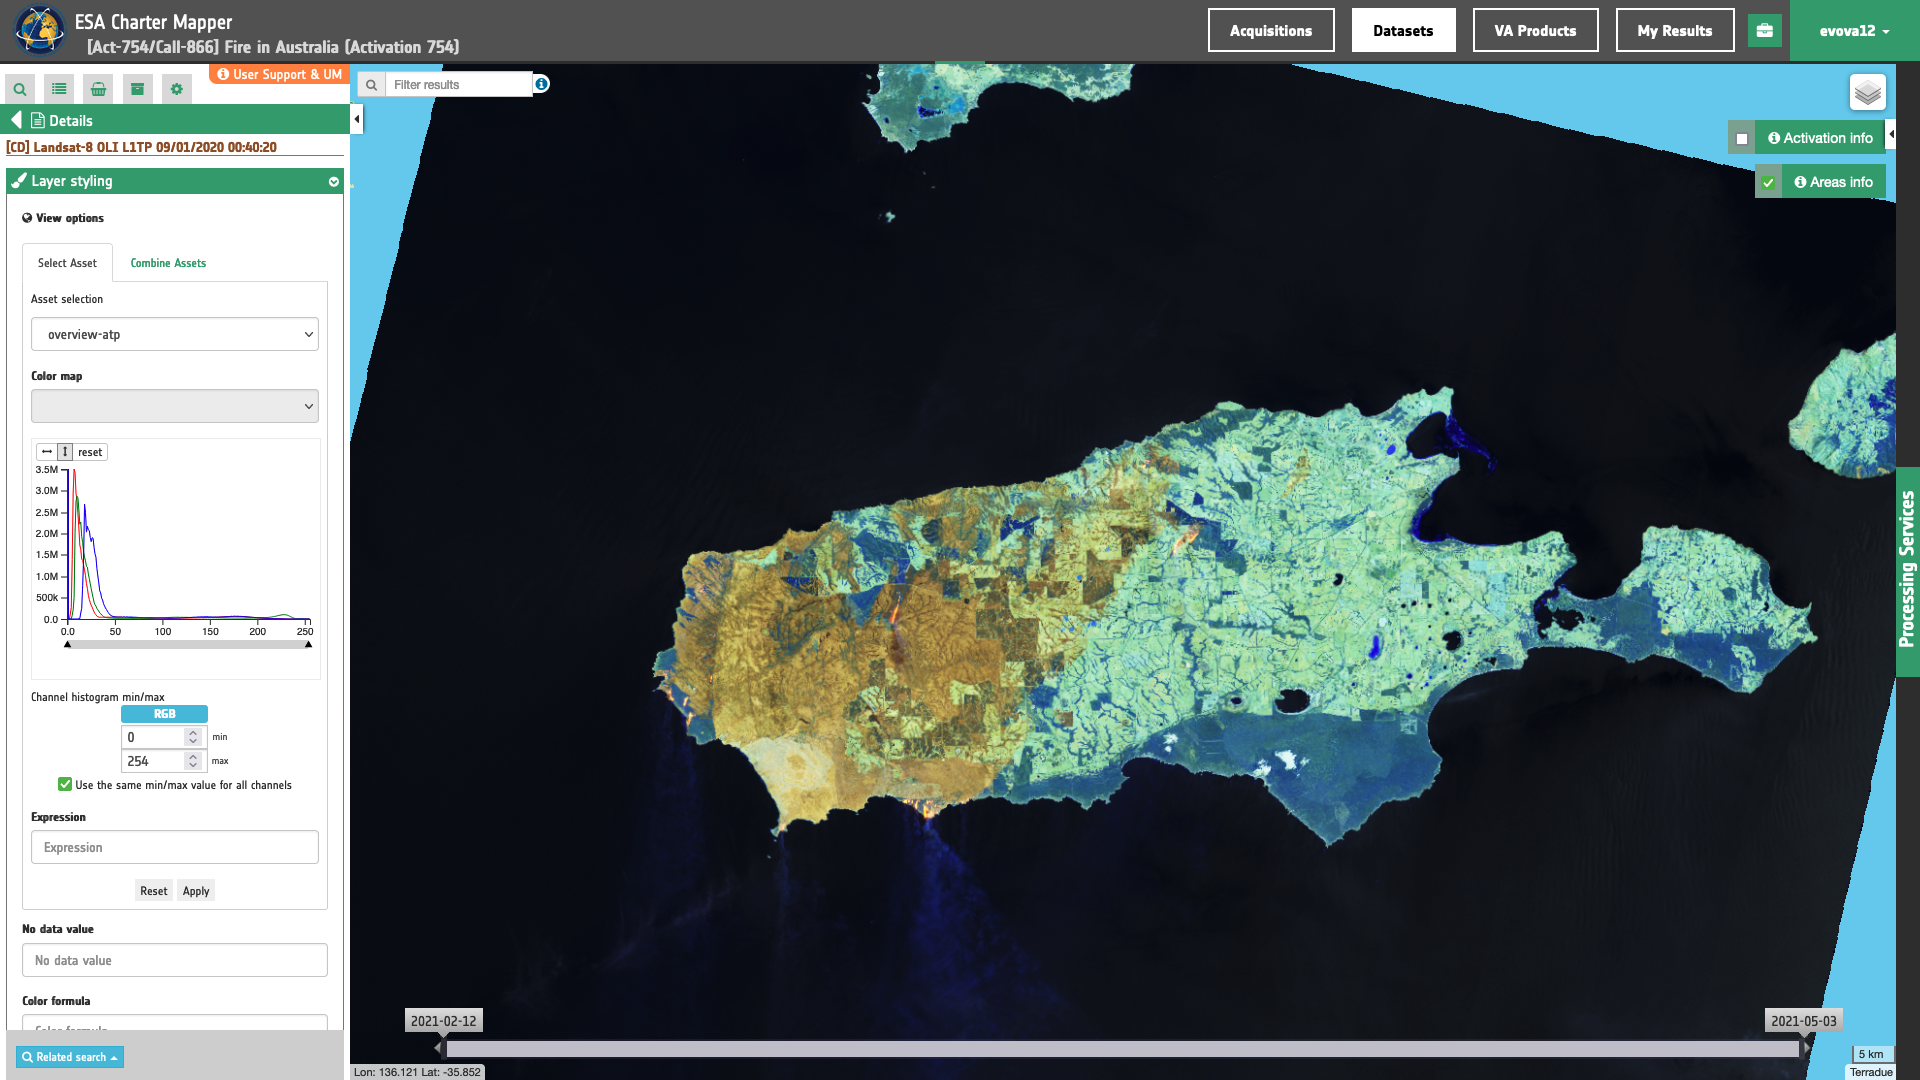
Figure 3 - Atmospheric Penetration (ATP) RGB composite from Landsat-8 data acquired over the Kangaroo island in Australia (Image credit: USGS).
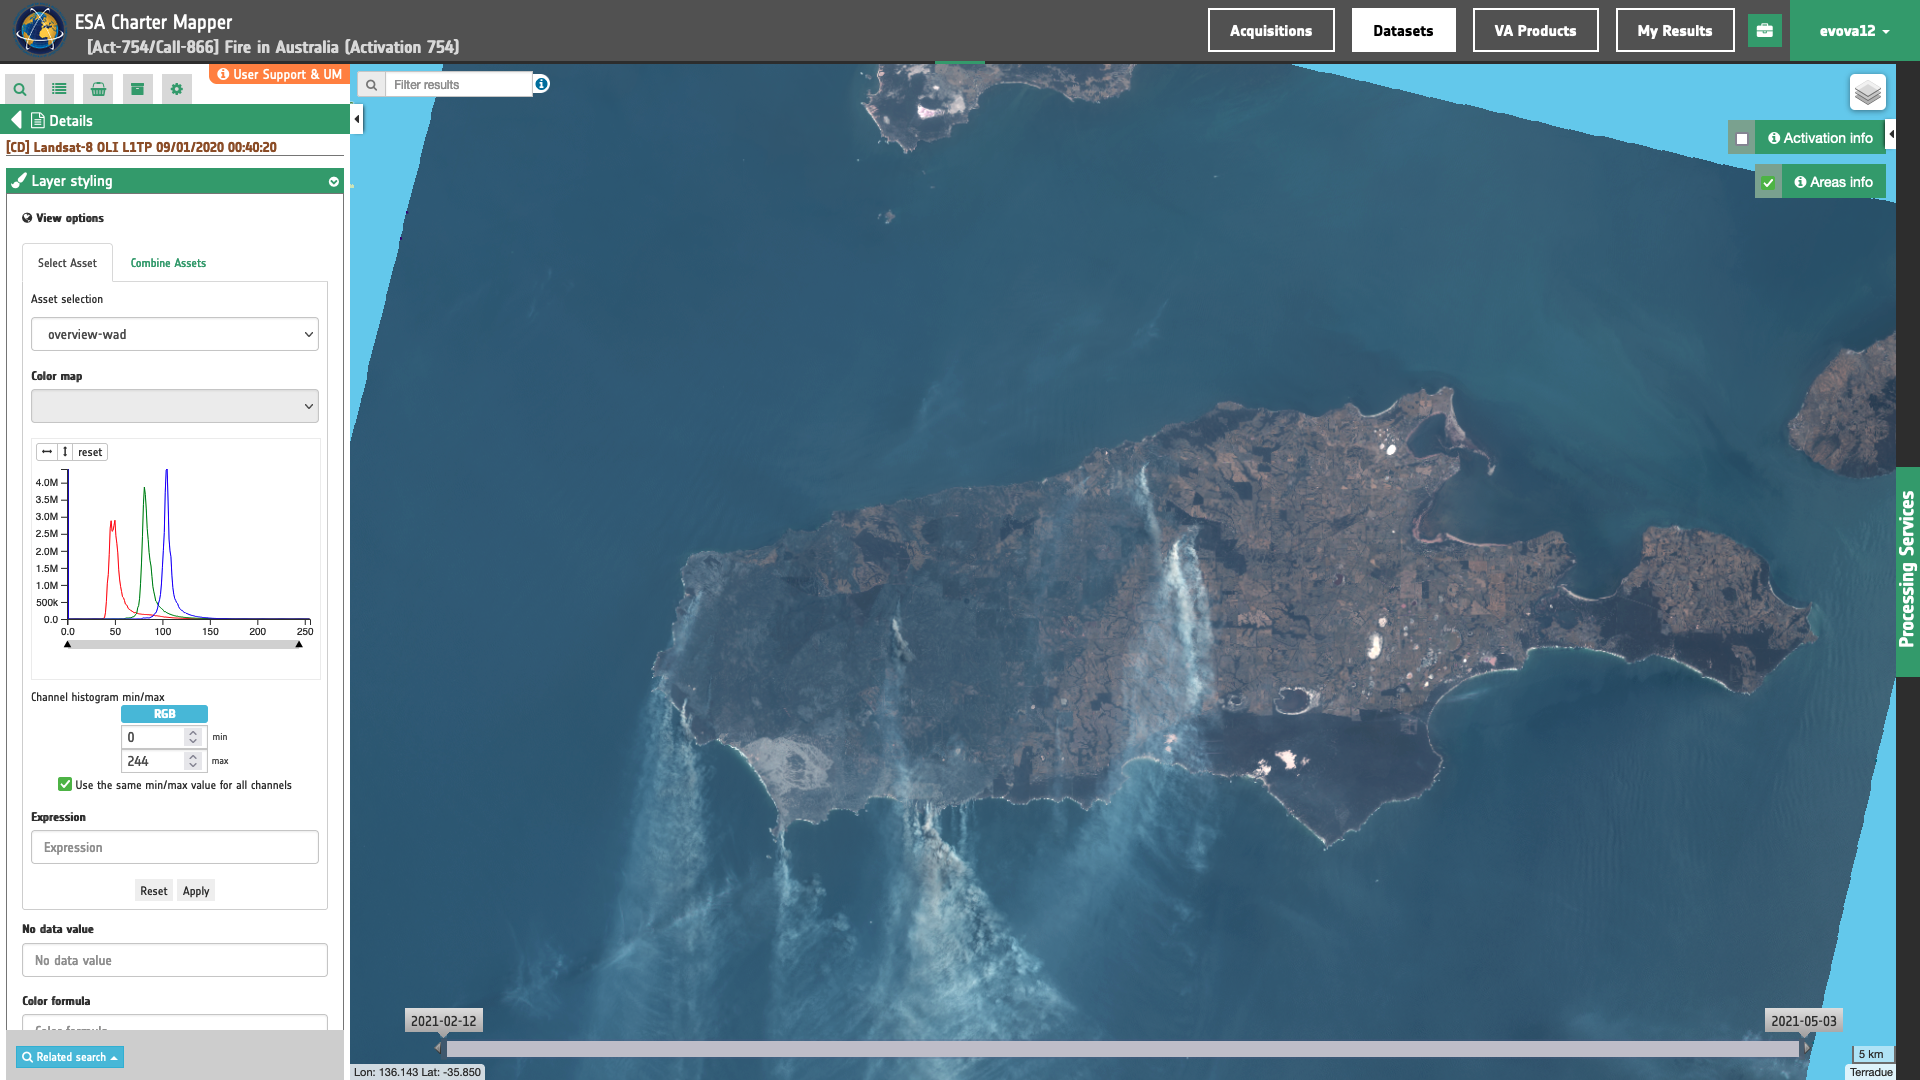
Figure 5 - Water Depth (WAD) RGB composite from Landsat-8 data acquired over the Kangaroo island in Australia (Image credit: USGS).
More information about the possible RGB composite options for Optical data available in the ESA Charter Mapper can be found here.
The same applies for SAR data where the single-band assets are the Sigma Nought in dB images for all the polarization included into the Dataset (e.g. s0_db_L_VV for L-band SAR data in VV polarization). Figure 6 shows the number of single-band and overview products that the ESA Charter Mapper systematically derives from a full-pol SAOCOM-1A Calibrated Dataset.
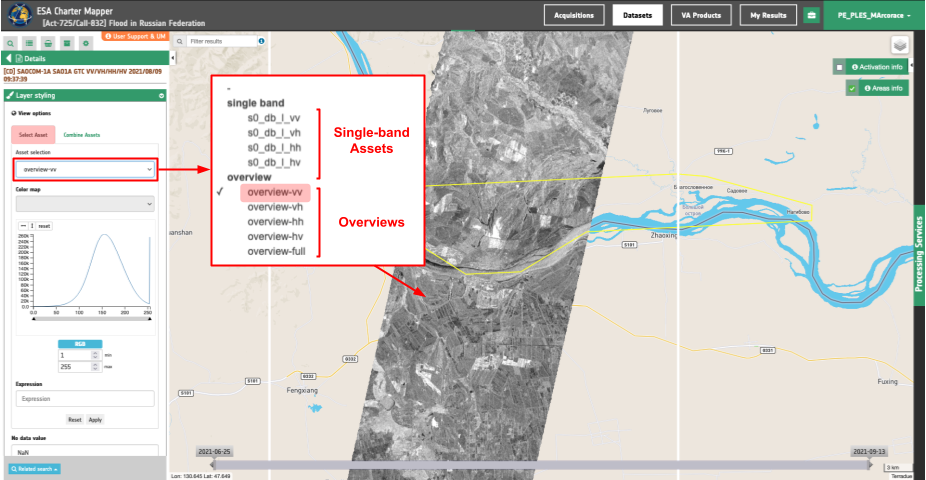
Figure 6 - A sample usage of the Select Asset function available under View Options from the Details of a SAOCOM-1A Dataset calibrated by the ESA Charter Mapper over the Russian Federation (Image credit: AIRBUS, CNES).
In Figures 7, 8 and 5 are shown examples of overviews (RGBA) that the ESA Charter Mapper systematically produces from the single-band assets of a Calibrated Dataset derived from a dual- or full-pol SAR data.
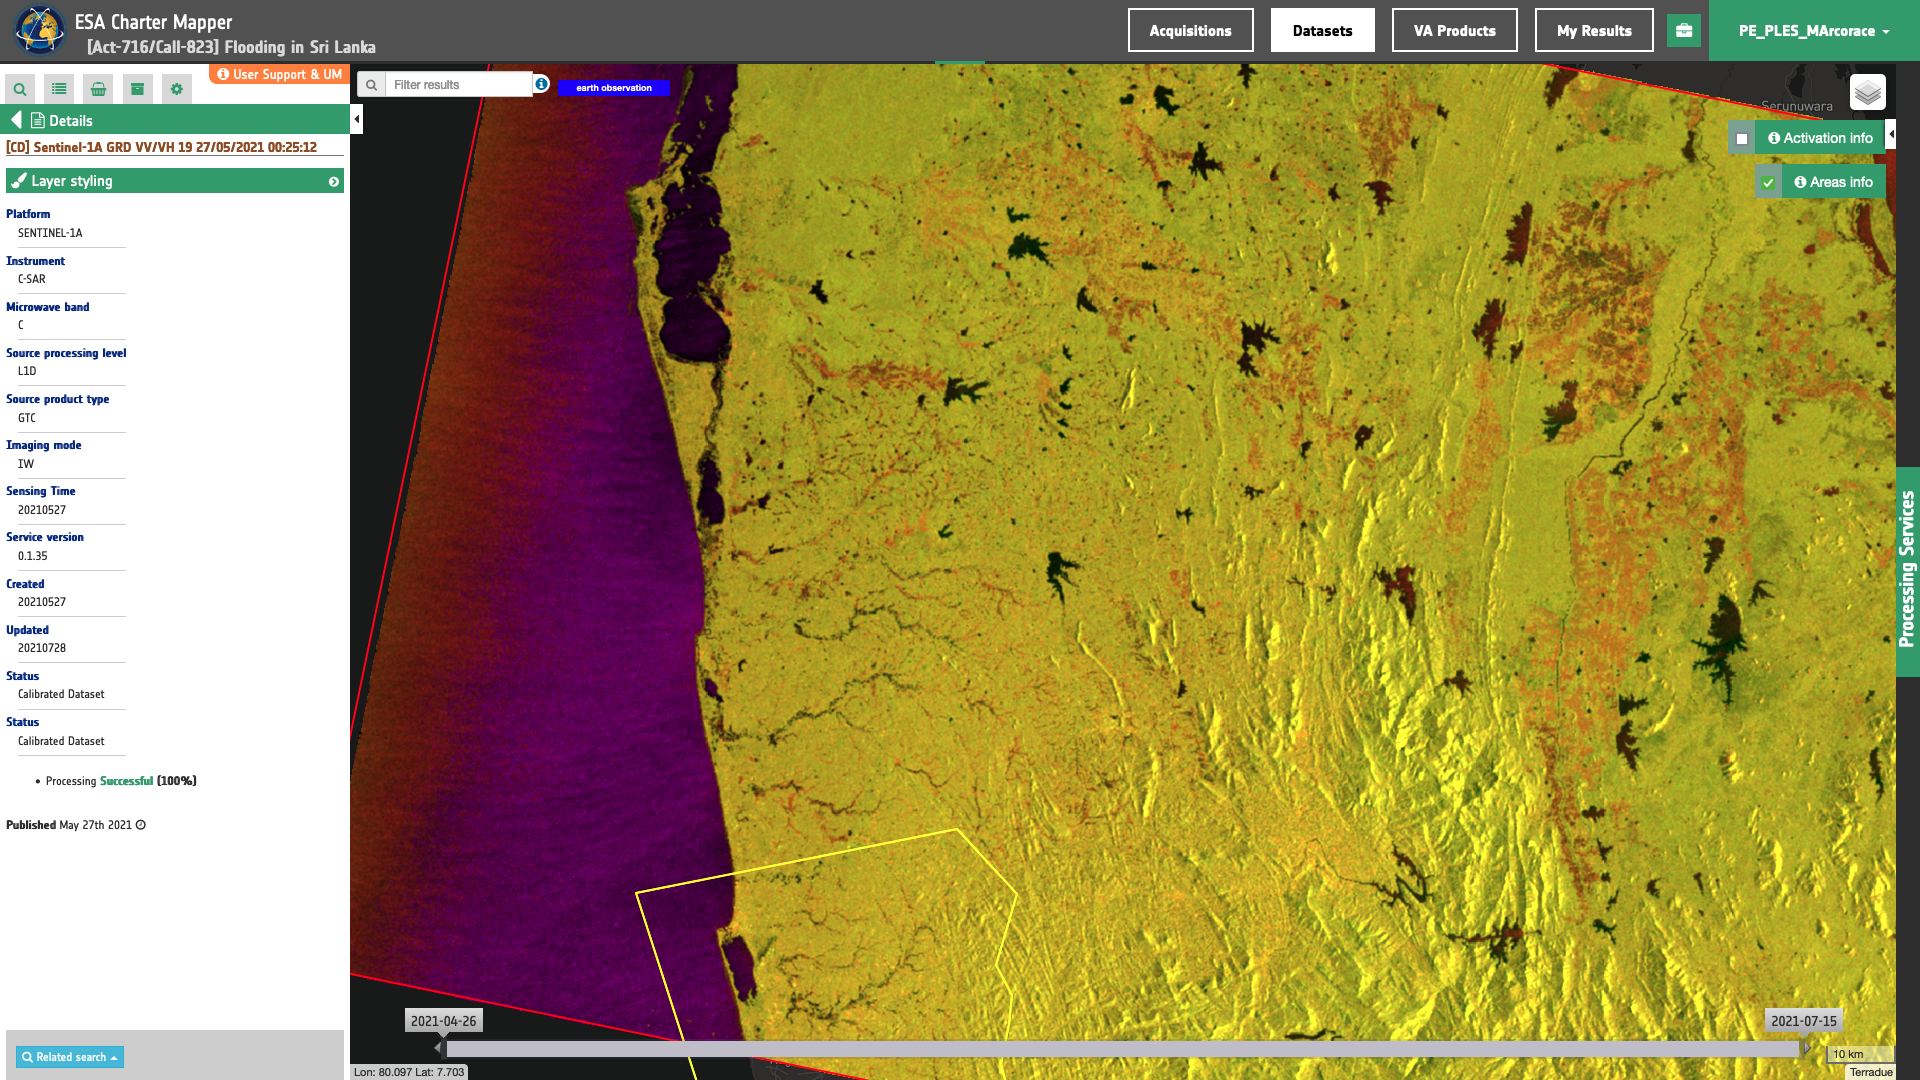
Figure 7 - Dual-pol overview RGB composite from Sentinel-1 data acquired over the Sri Lanka (Image credit: Copernicus, ESA).
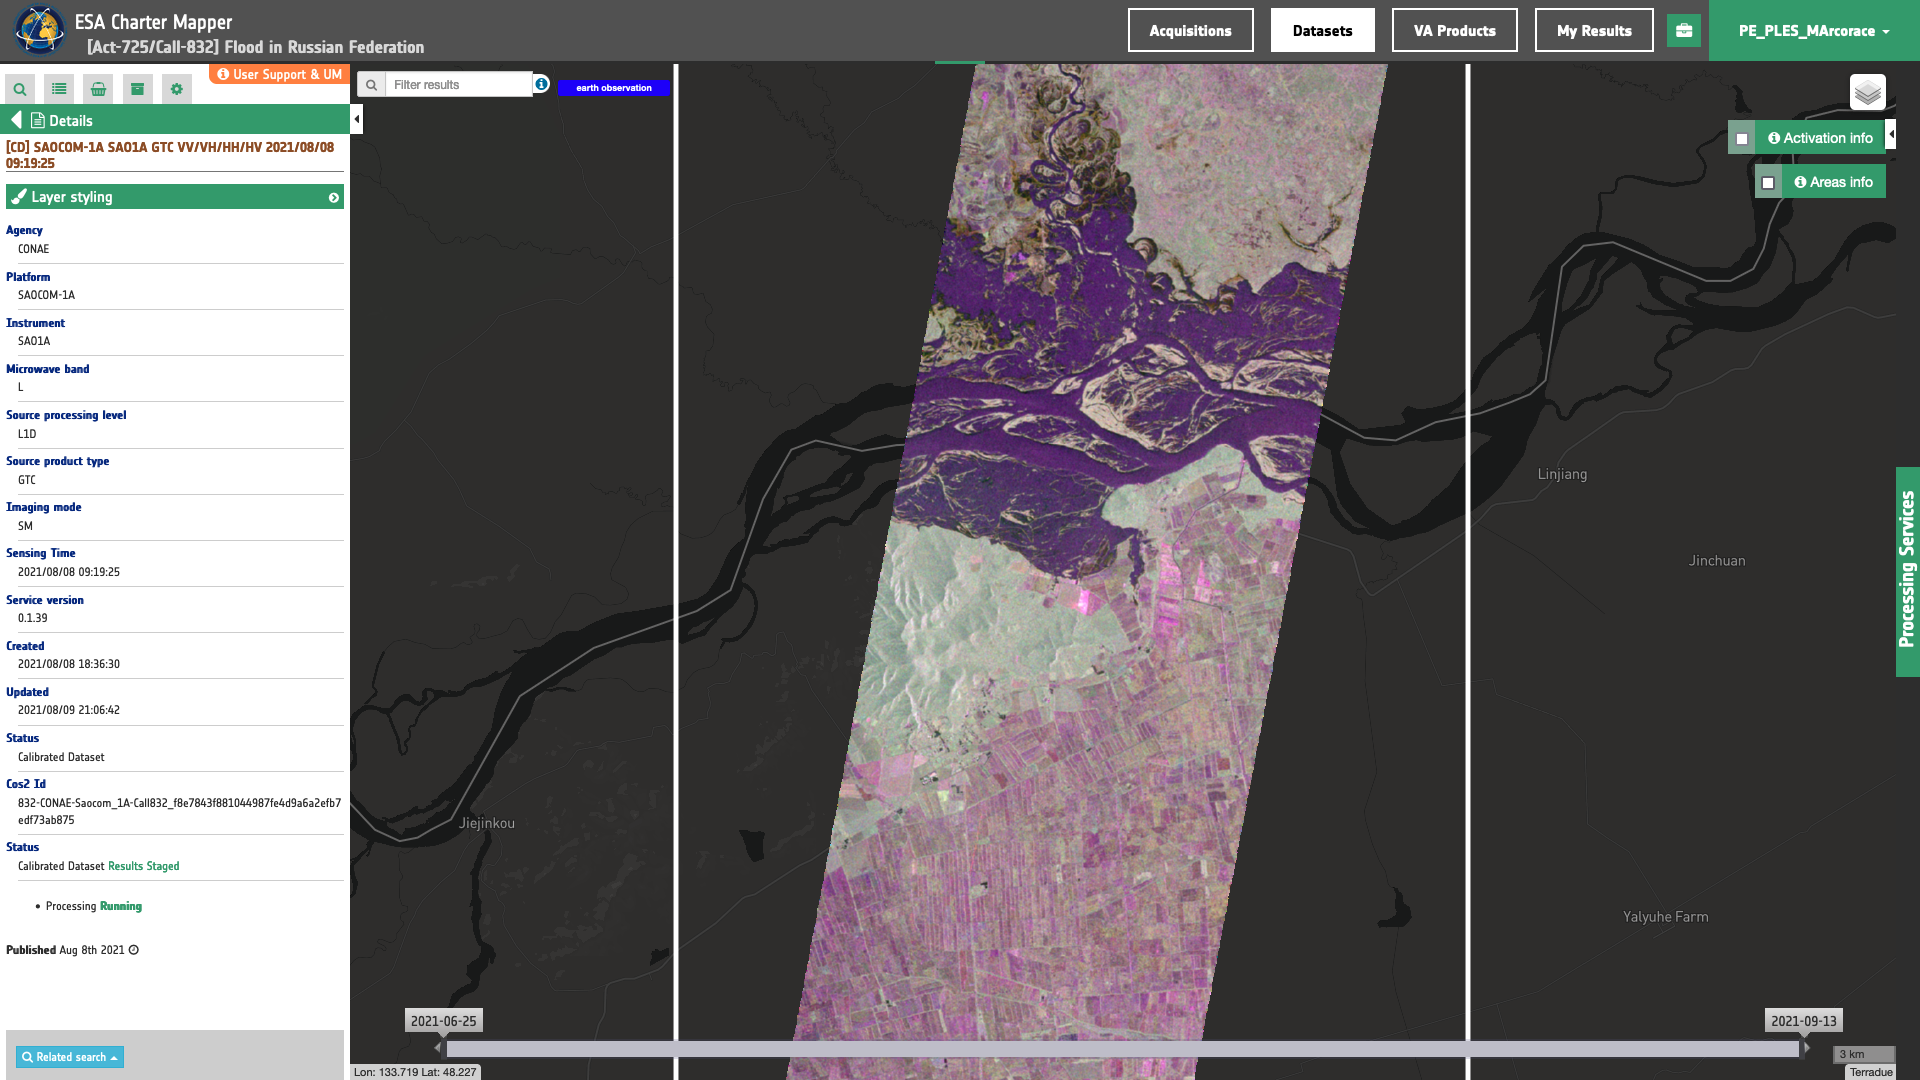
Figure 8 - Full-pol overview RGB composite from SAOCOM-1A data acquired over the Russian Federation (Image credit: CONAE).
More information about the RGB composites systematically derived in the ESA Charter Mapper from SAR data can be found here.
Finally, product specifications about the Overviews derived from the ESA Charter Mapper can be found here.
Histogram visualization
Once a layer of interest is selected by the user the PE offers the possibility to visualize the histogram for each of the assets of the Dataset (e.g. frequency distribution function of pixel values for the nir band of a Landsat-8 calibrated dataset) in a tab within the left panel.
Having the histogram of an element of an Asset (TOA reflectance for a spectral band, sigma nought in VV) is important to evaluate the signal which has been recorded by the sensor over the entire scene (e.g. to assess TOA reflectance in each spectral bands, or to recognize a two lobes histogram of a SAR intensity image having water/non-water surfaces).
In the PE, histograms appear next to the geobrowser map in the left panel of the interface (see Figure 7) to let the user evaluate simultaneously the changes in the image visualization on the map.
The platform lets the user set min/max of the histogram (e.g. of TOA reflectance or sigma nought in dB) to apply the desired image stretching. This is made possible by moving from the full range to a desired one.
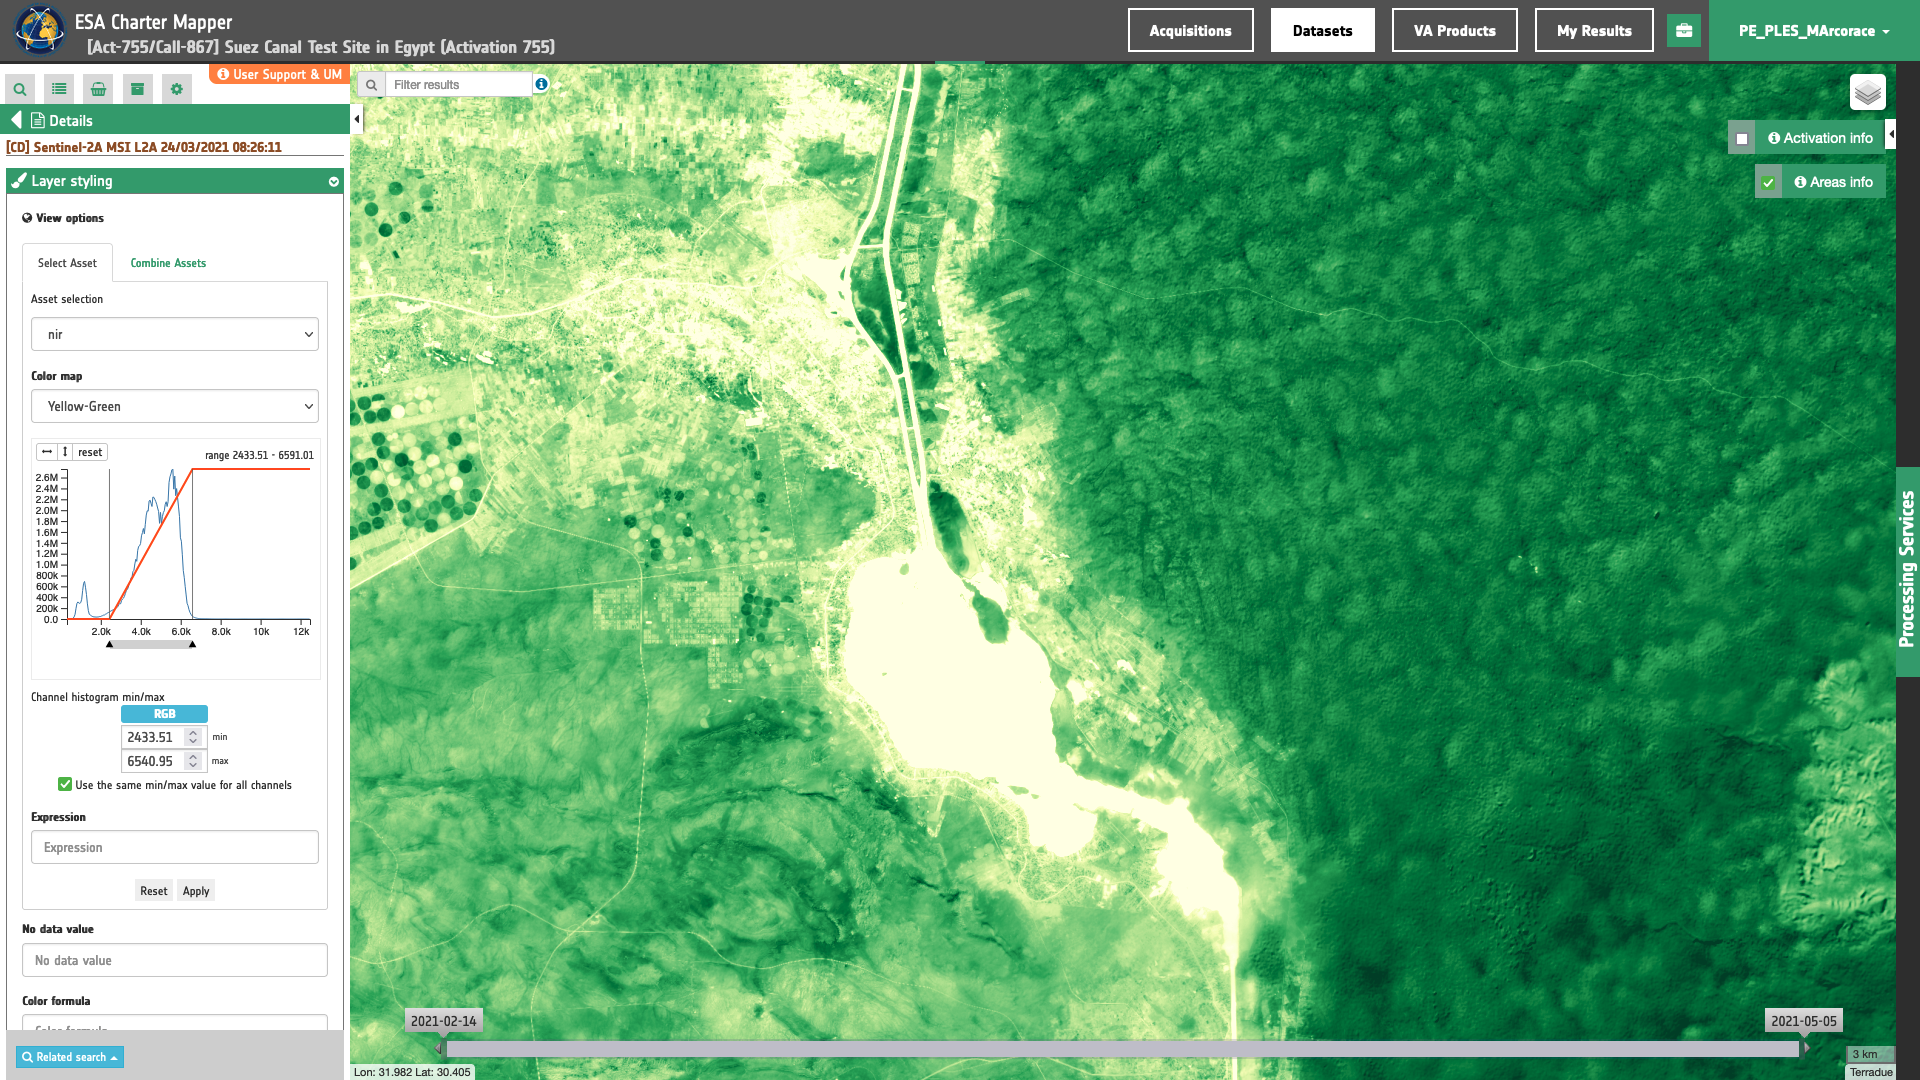
Figure 7 - Visualization of histogram for a single-band product into the ESA Charter Mapper. The image shows the histogram of the nir asset as TOA reflectances derived from a Sentinel-2 MSI calibrated dataset over the Suez canal (image credit: ESA, Copernicus).
The manual definition of min and max values can be done separately for each of the assets of the Dataset (see Figure 8). This is important, for example, while visualizing full-pol SAR data since valid ranges can be different for co-pol and cross-pol polarization given the different nature of the signal.
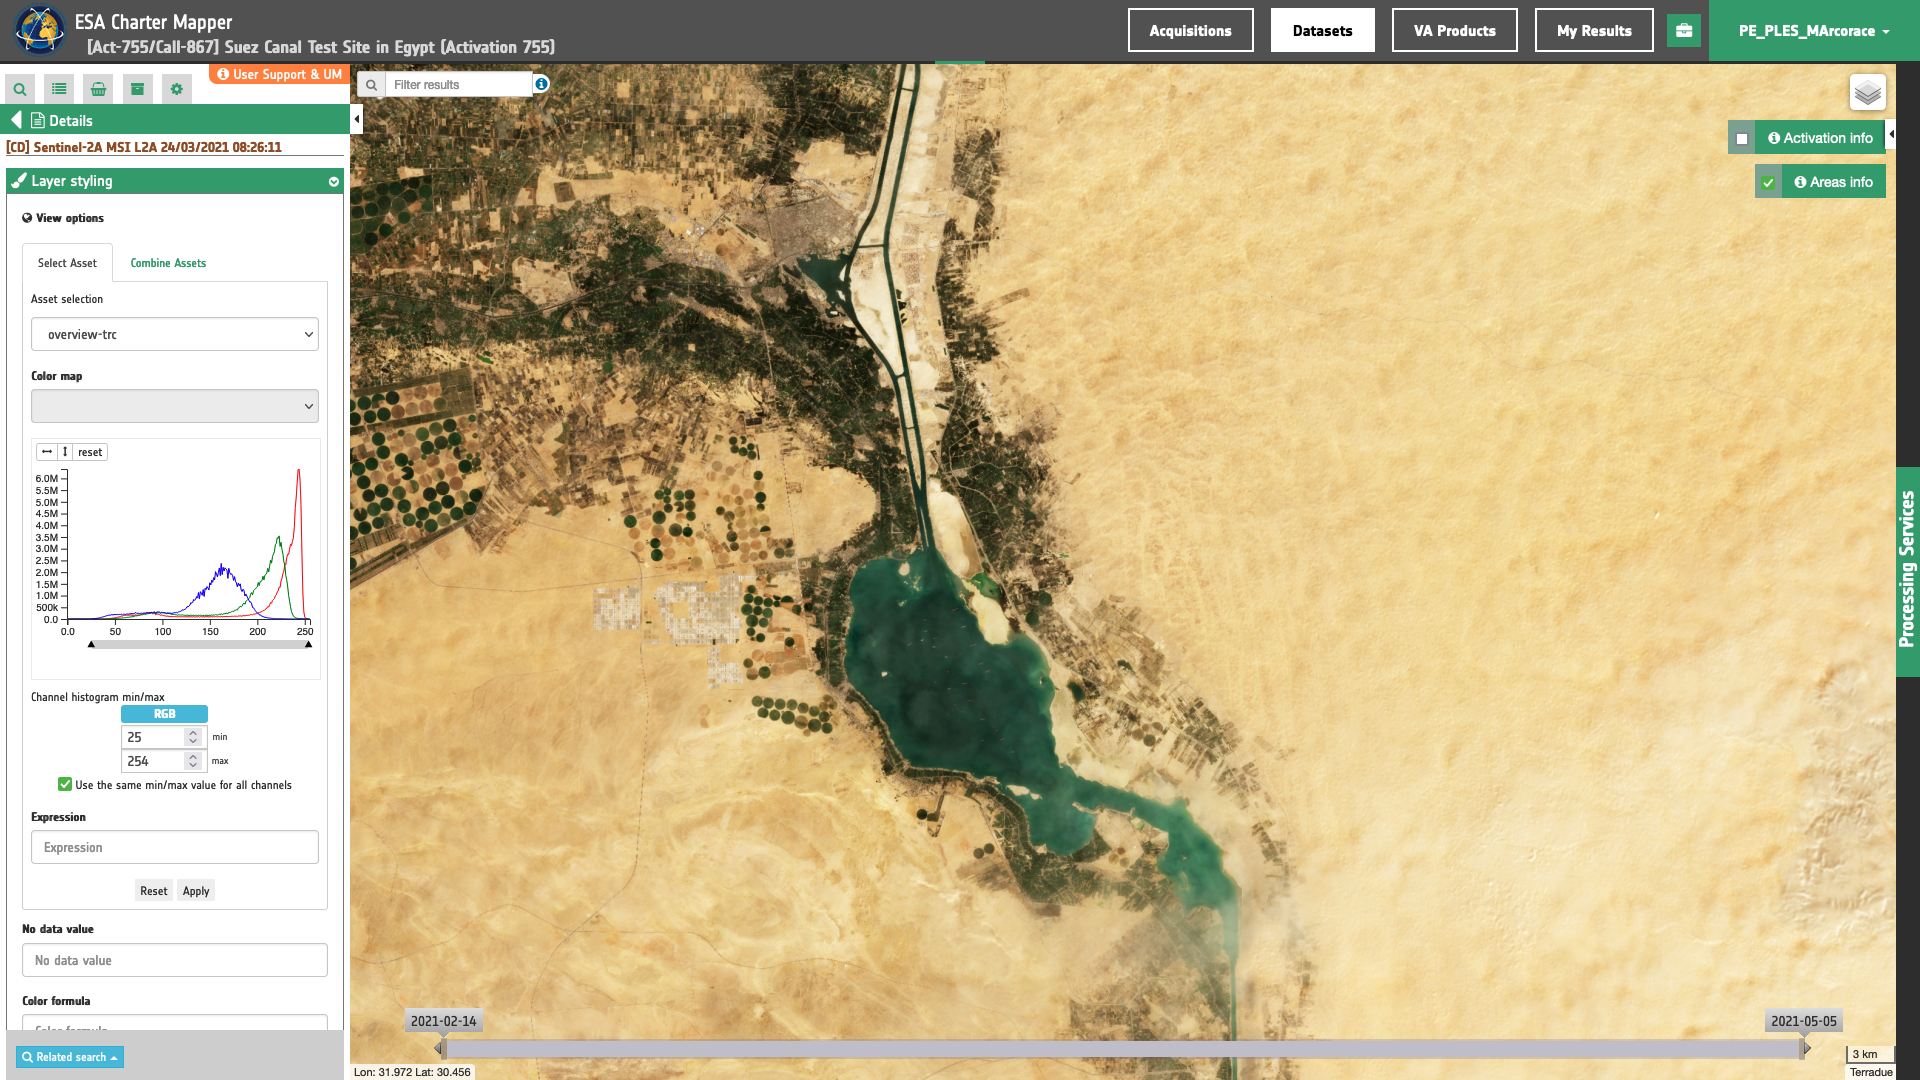
Figure 8 - Visualization of histograms for an overview product into the ESA Charter Mapper. The image shows histograms for RGB channels of the TRC overview from the same Sentinel-2 MSI data over the Suez canal (image credit: ESA, Copernicus).
Under the Select Asset the ESA Charter Mapper offer the possibility automatically perform a 2% cumulative count cut of the histogram (see Figures 9 and 10).
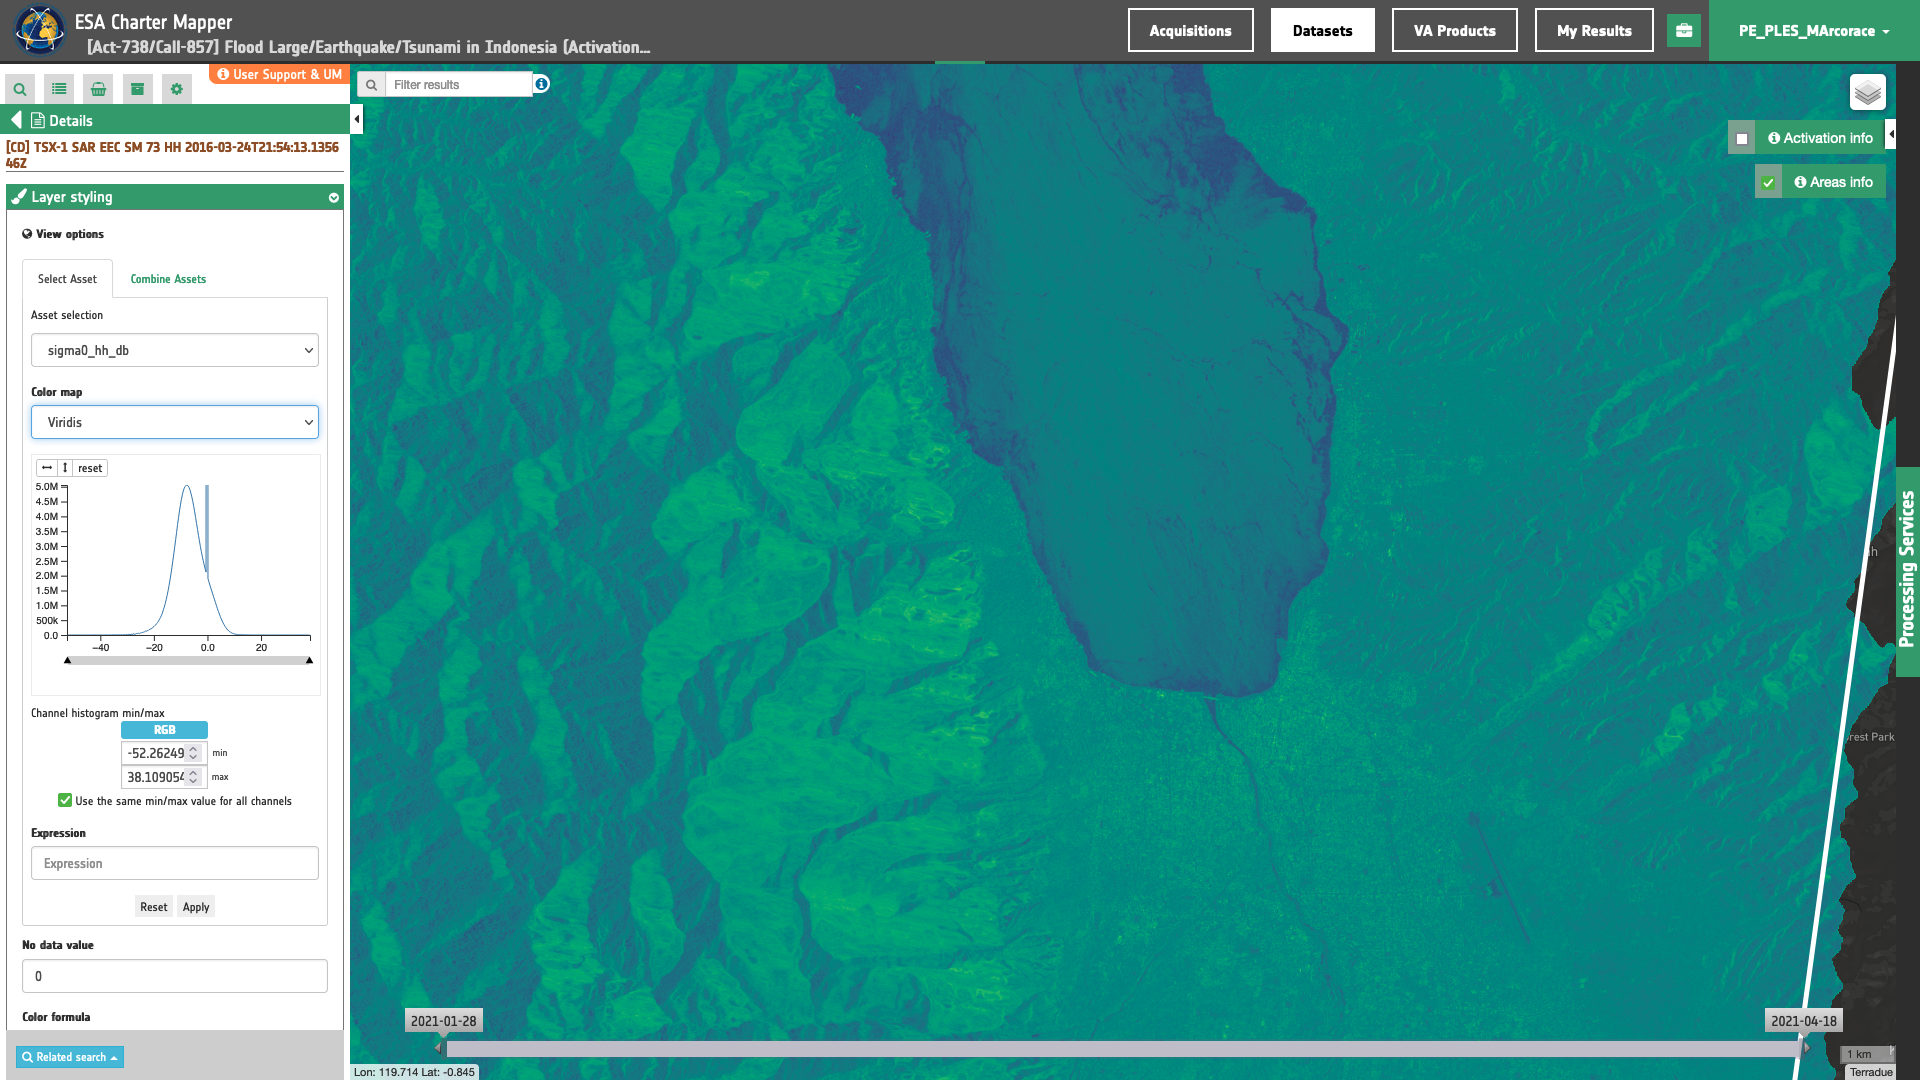
Figure 9 - Visualization of Single band asset for Sigma Nought of TerraSAR-X data and associated histogram into the ESA Charter Mapper with no image stretching (image credit: DLR).
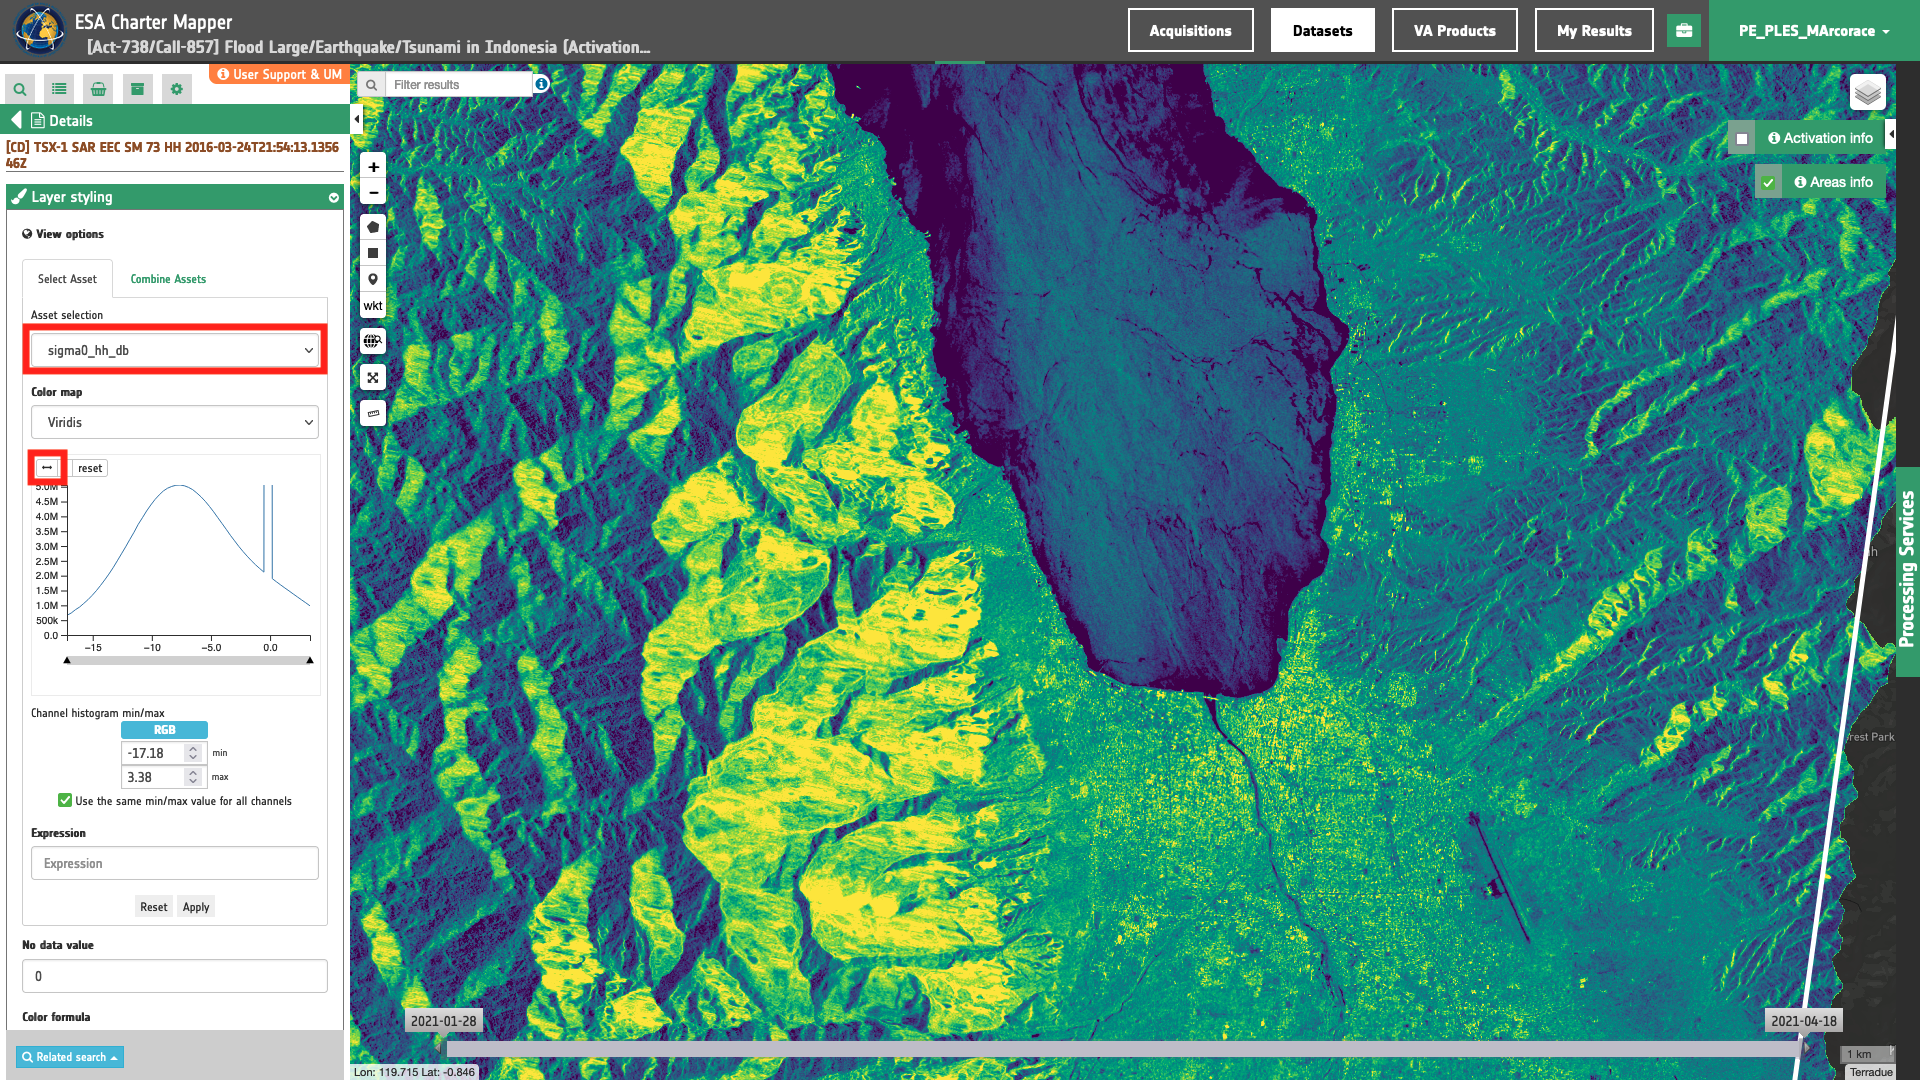
Figure 10 - Visualization of Single band asset for Sigma Nought of TerraSAR-X data and associated histogram into the ESA Charter Mapper after a 2% cumulative count cut (image credit: DLR).
More details about the default Min Max values for the multiple physical meaning quantities can be found here.