COMBI tutorial
![]()
This service takes 3 single band assets (e.g. bands that may come from different sensors) to generate a full resolution RGB composite. The output has the finest resolution as of the input data (only if all selected bands are coming from the same sensor). It also provides co-located single band assets (reflectance or Sigma0 in dB) after reprojection and resampling on the same grid.
 COMBI service description and specifications are available in this section.
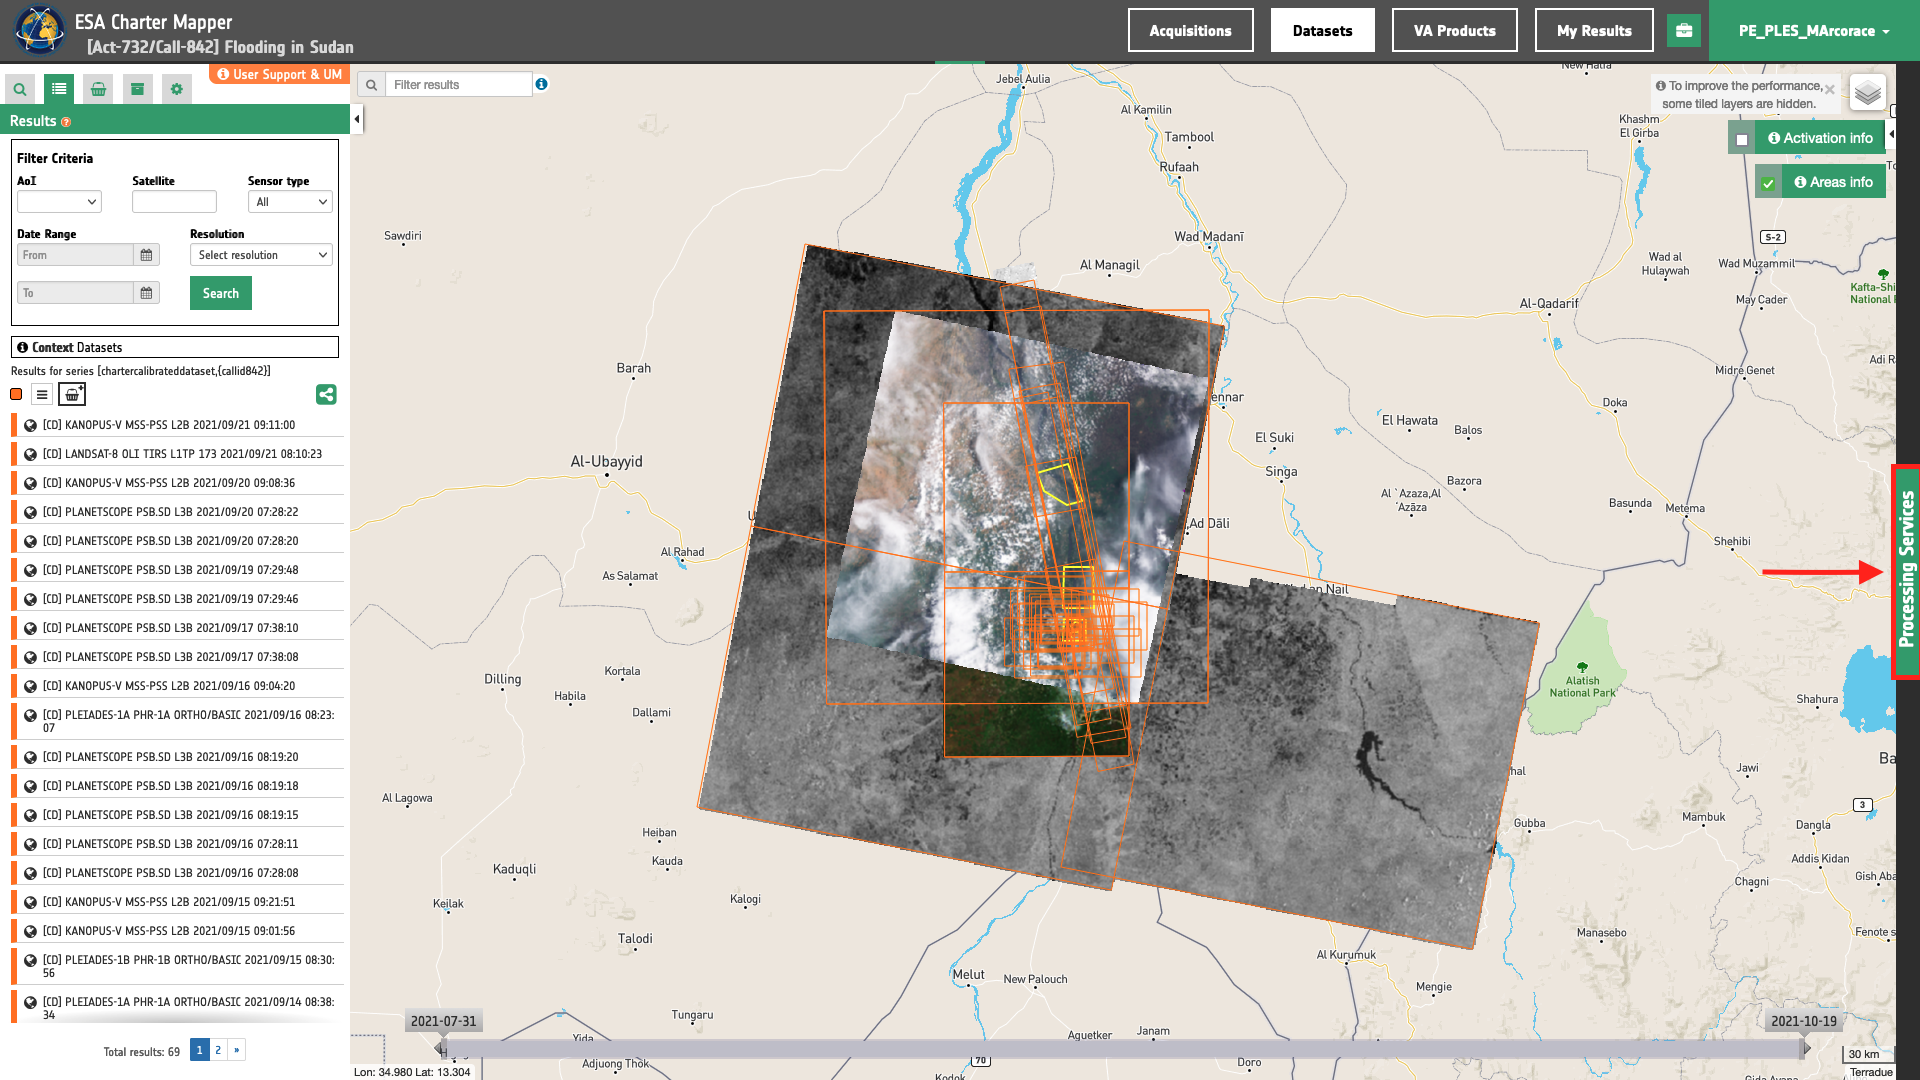
Select the processing service
After the opening of the activation workspace, in the right panel of the interface, open the Processing Services tab.
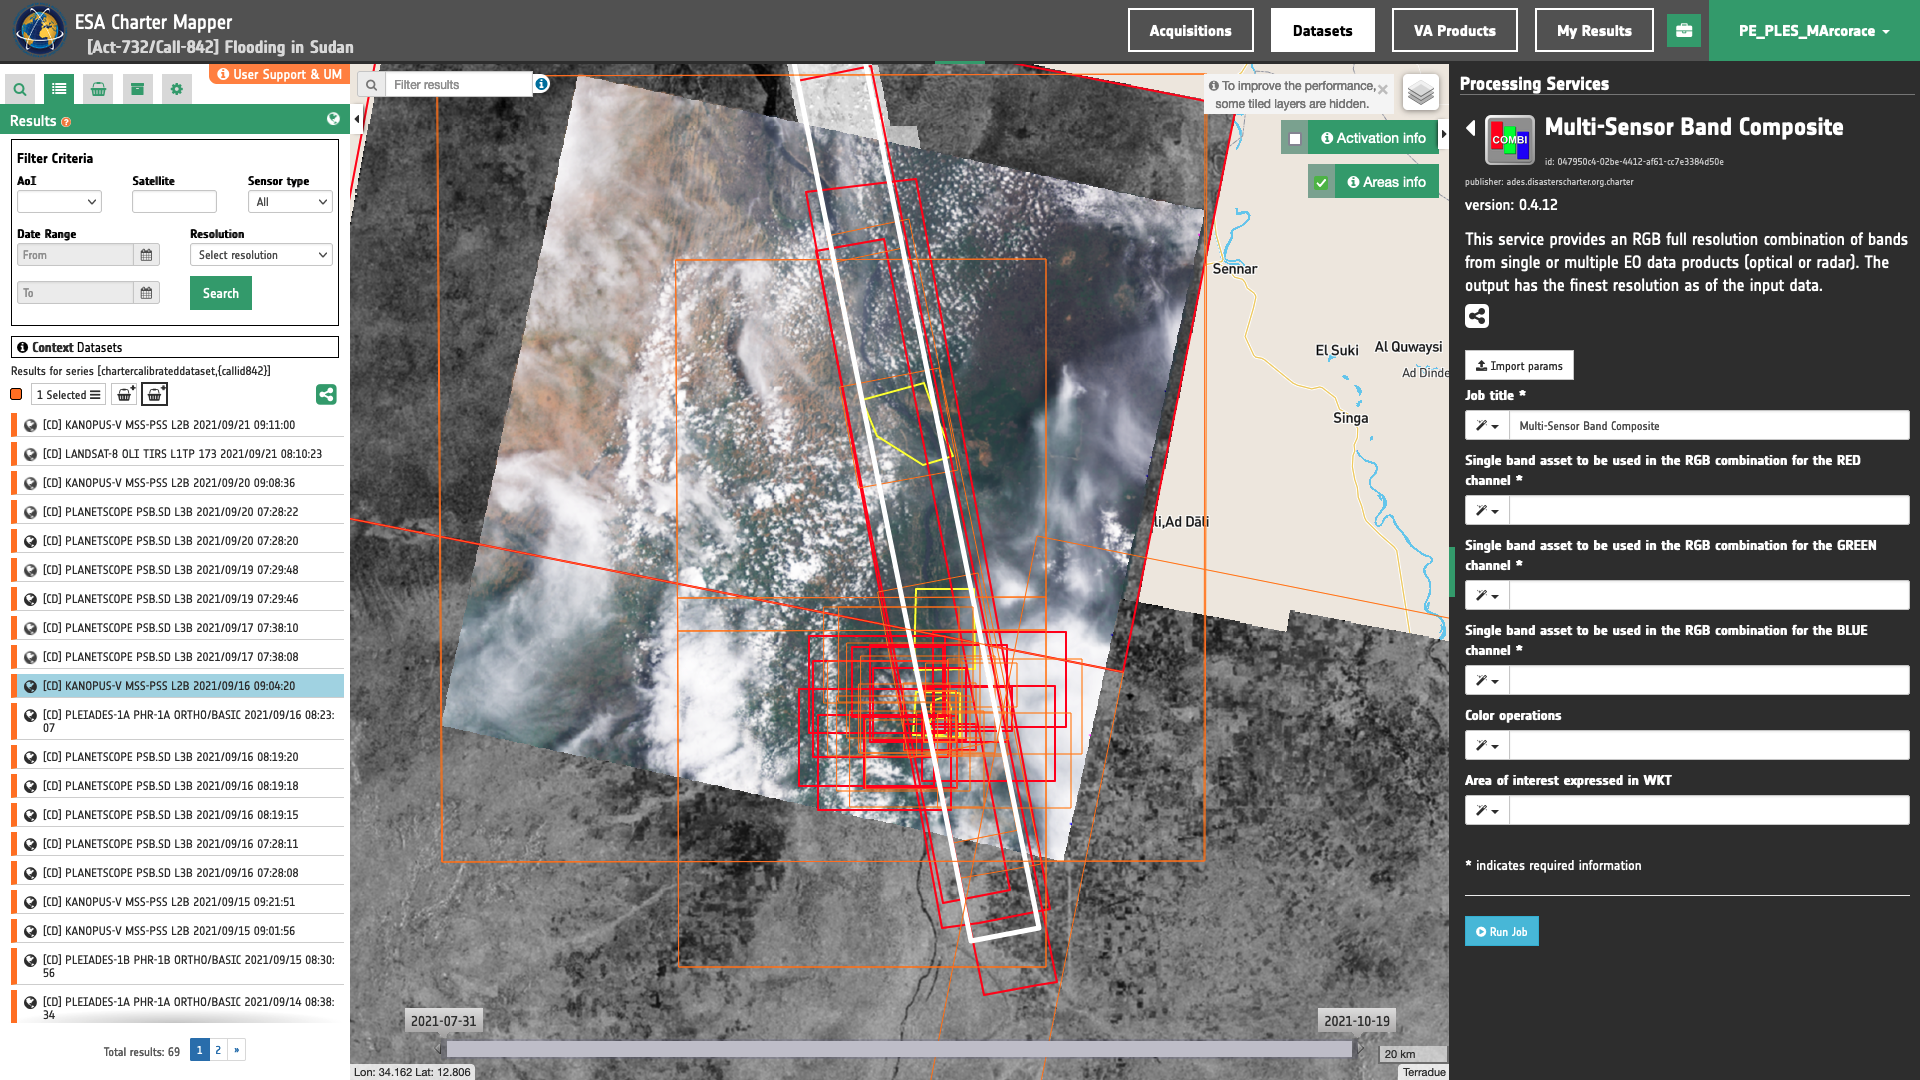
Select the processing service Multi-Sensor Band Composite.
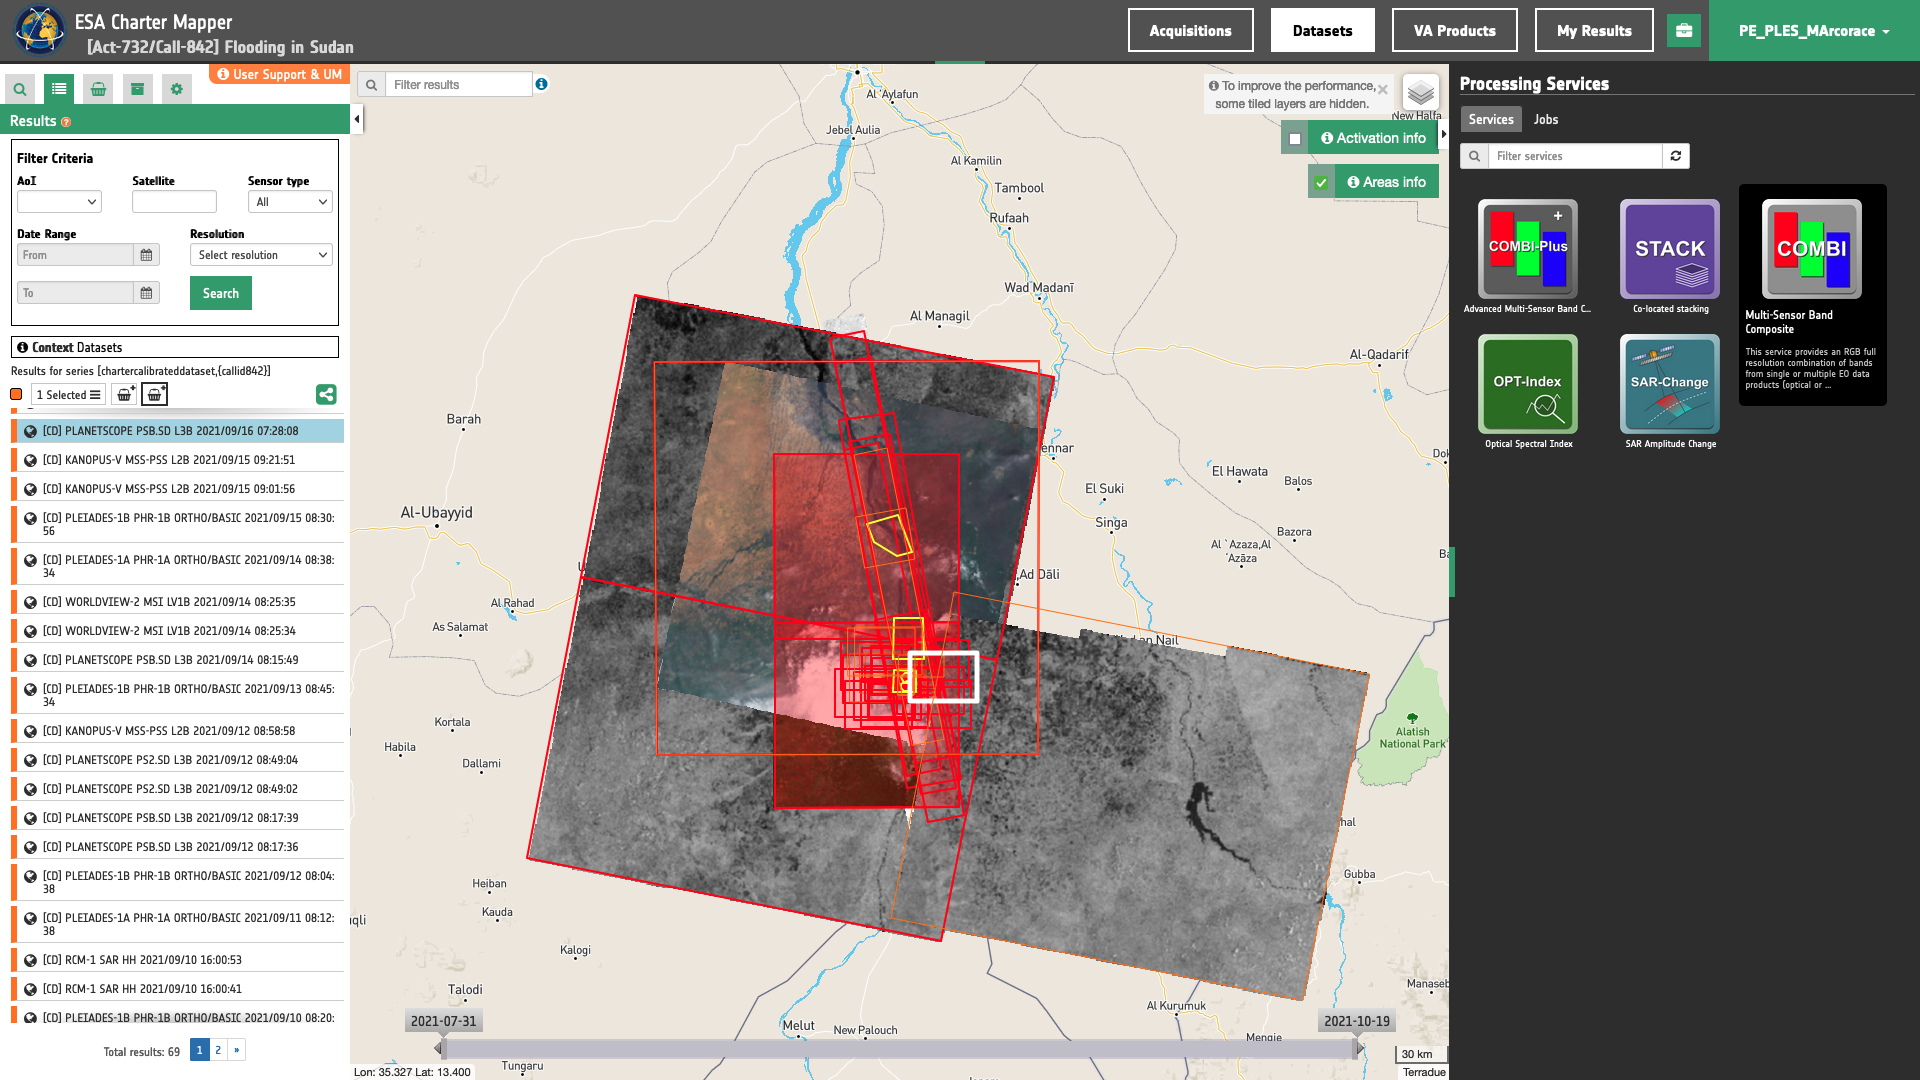
The Multi-Sensor Band Composite (COMBI) panel is displayed with a series of parameters values to be filled-in.
Multi-temporal Band Composite with Optical EO data
Abstract
This use case explains how to create a multi-temporal RGB composite from three single band assets acquired from the same optical sensor under different dates.
Find the data using multiple filter criteria
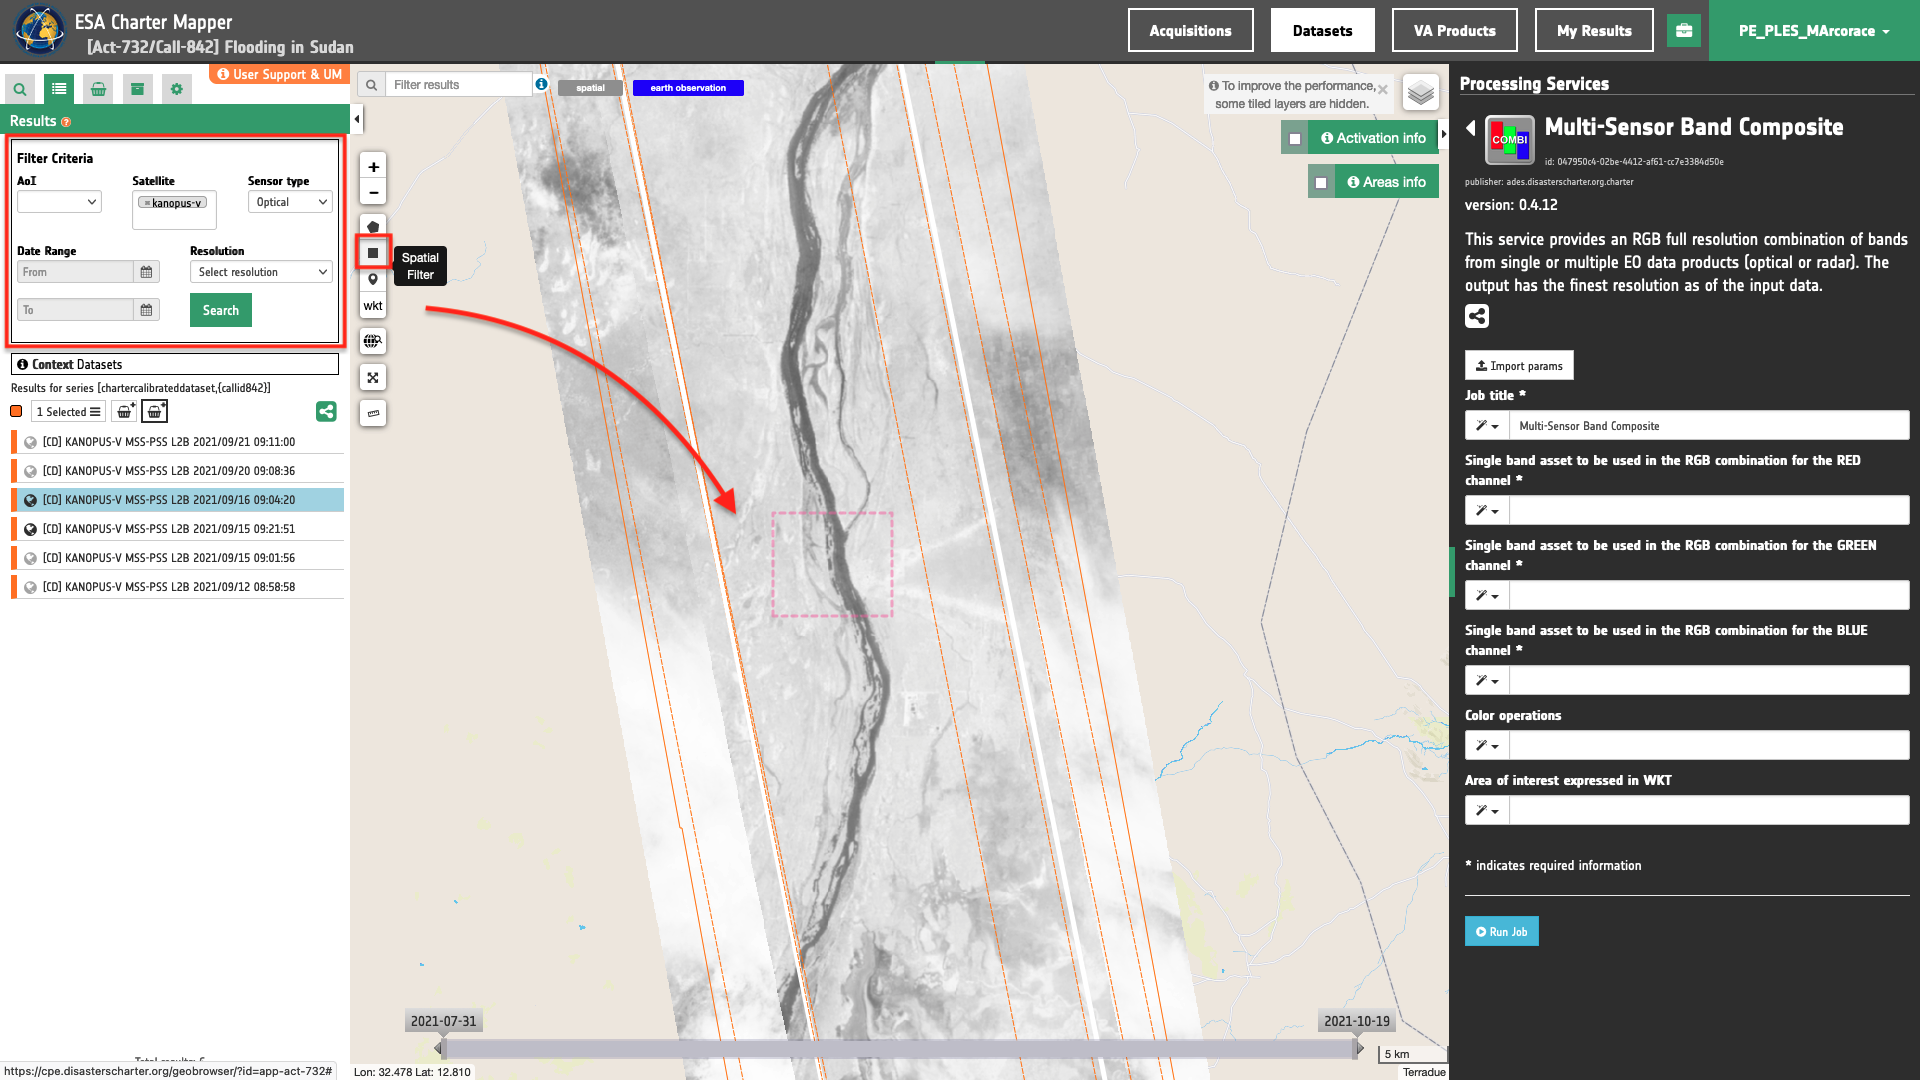
Choose an area in which you want to focus your analysis, e.g over Jibal aj Jabalen in Sudan.
From the Navigation and Search toolbar (located in the upper left side of the map), click on Spatial Filter and draw a square near the city of Jibal aj Jabalen around the White Nile river. This spatial filter allows you to select only the EO data acquired over this area.
From the top of the left panel, use Filter Criterias to search for “Optical” and "Kanopus-V" data collections from the list.
After this query the list in the Result panel will be updated as the one shown in the image below.
Fill the paramters
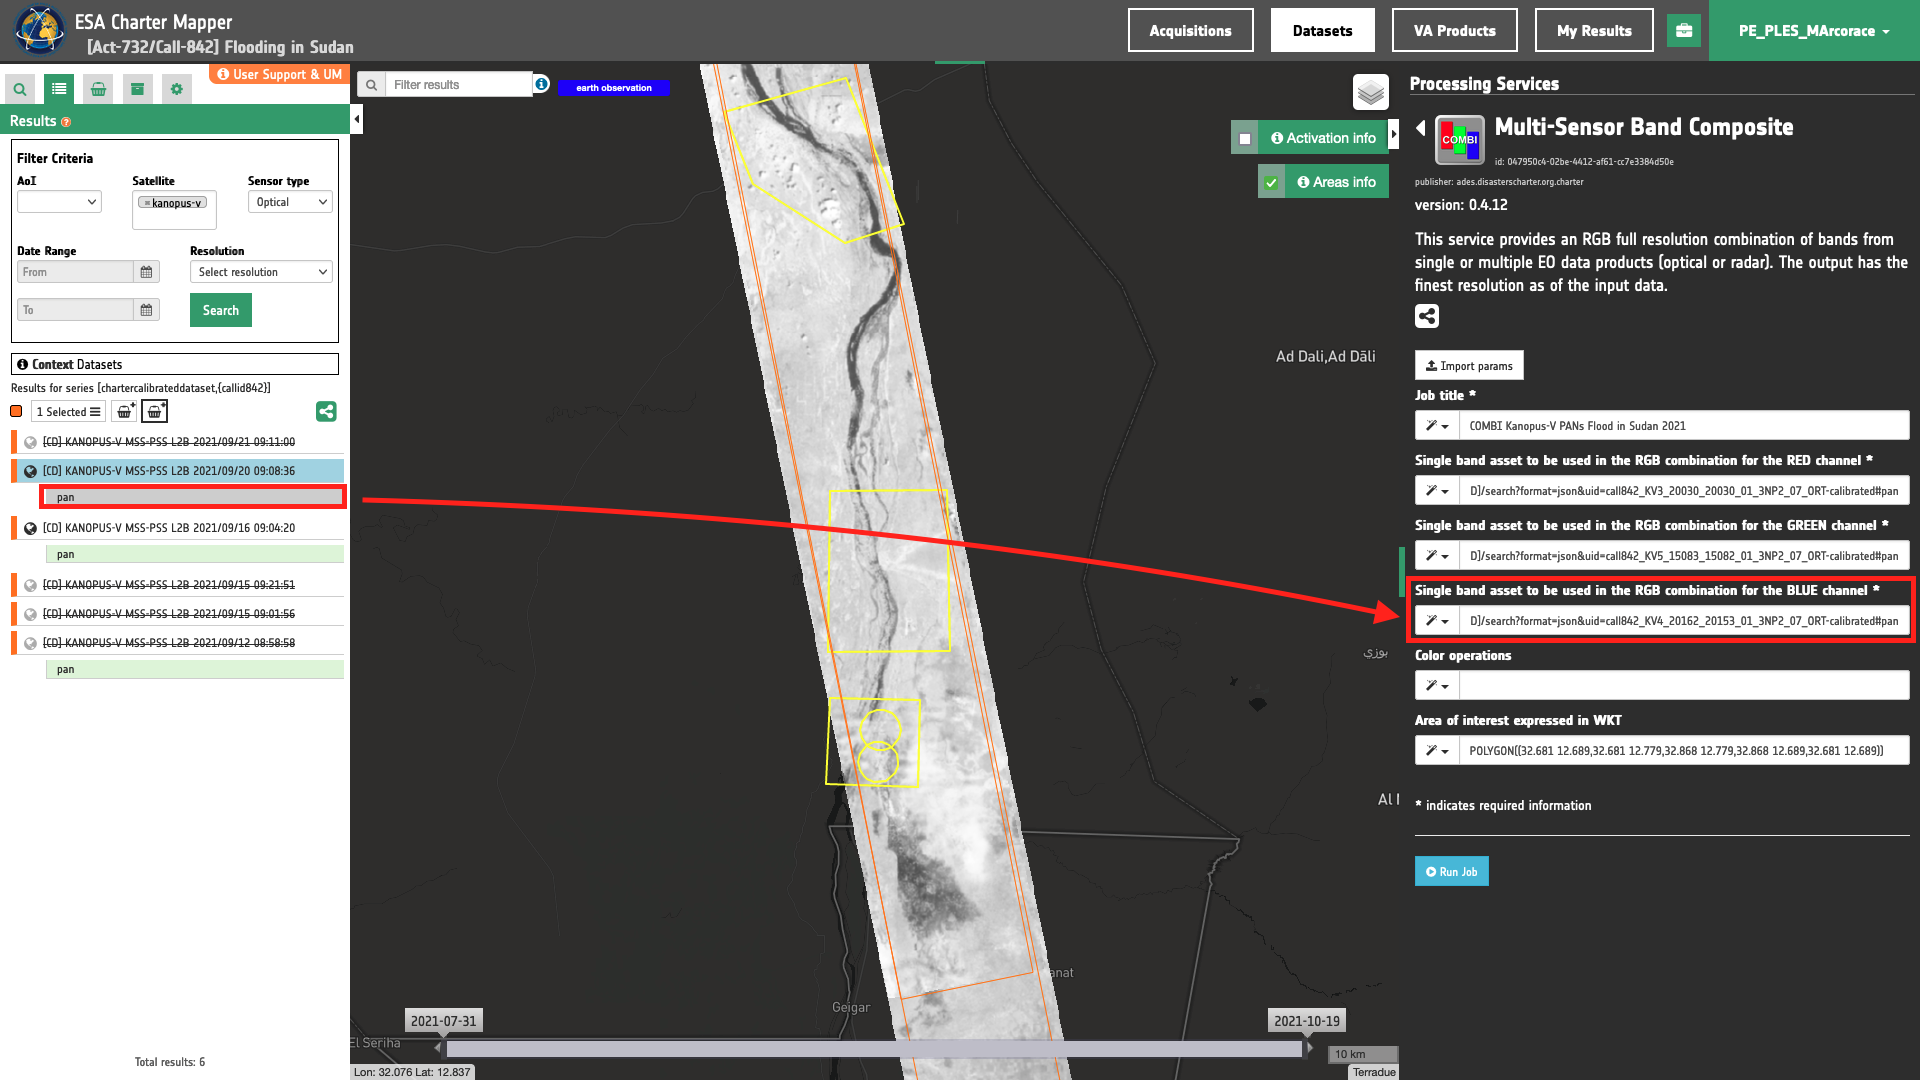
After the definition of spatial and time filters, you can employ COMBI, by combining, for example, three pan assets from a set of three Panchromatic images from Kanopus-V data to generate a multitemporal RGB composite.
The first one can be the Kanopus-V No.3 PAN image acquired on 2021/09/12 at 08:58:58, the second one can be the Kanopus-V No.5 PAN image acquired on 2021/09/16 at 09:04:20, and the third one the Kanopus-V No.4 PAN image acquired on 2021/09/20 at 09:08:36.
To do so you can fill the parameters as described in the following sections.
Job name
Insert as job name:
COMBI Kanopus-V PANs Flood in Sudan 2021
Reference input
-
Drag and Drop the band
panfrom the assets of the Kanopus-V Calibrated Dataset no.1 in theRED channelfield. -
Drag and Drop the band
panfrom the assets of the Kanopus-V Calibrated Dataset no.2 in theGREEN channelfield. -
Drag and Drop the band
panfrom the assets of the Kanopus-V Calibrated Dataset no.3 in theBLUE channelfield.
Warning
Drag and drop the single-band asset (e.g. "pan") and not the Dataset (e.g. "[CD] KANOPUS-V MSS-PSS L2B 2021/09/16 09:04:20") into the R- G-, B-channel fields.
Color operations
This is an optional parameter dedicated to the color formula. If needed, the following color formula can be inserted: “Gamma RGB 1.5 Sigmoidal RGB 10 0.3 Saturation 1”.
Note
This parameter is optional.
Area of interest expressed in WKT
The “Area of interest as Well Known Text” can be defined by using the drawn polygon defined with the area filter.
Tip
To automatically define the WKT values click on the Magic tool wizard button in the left side of the "Area of interest expressed as Well-known text" box and select the option AOI from the list. The platform will automatically fill the parameter value with the rectangular bounding box taken from current search area in WKT format.
Note
This parameter is optional.
Run the job
Click on the button Run Job and see the Running Job
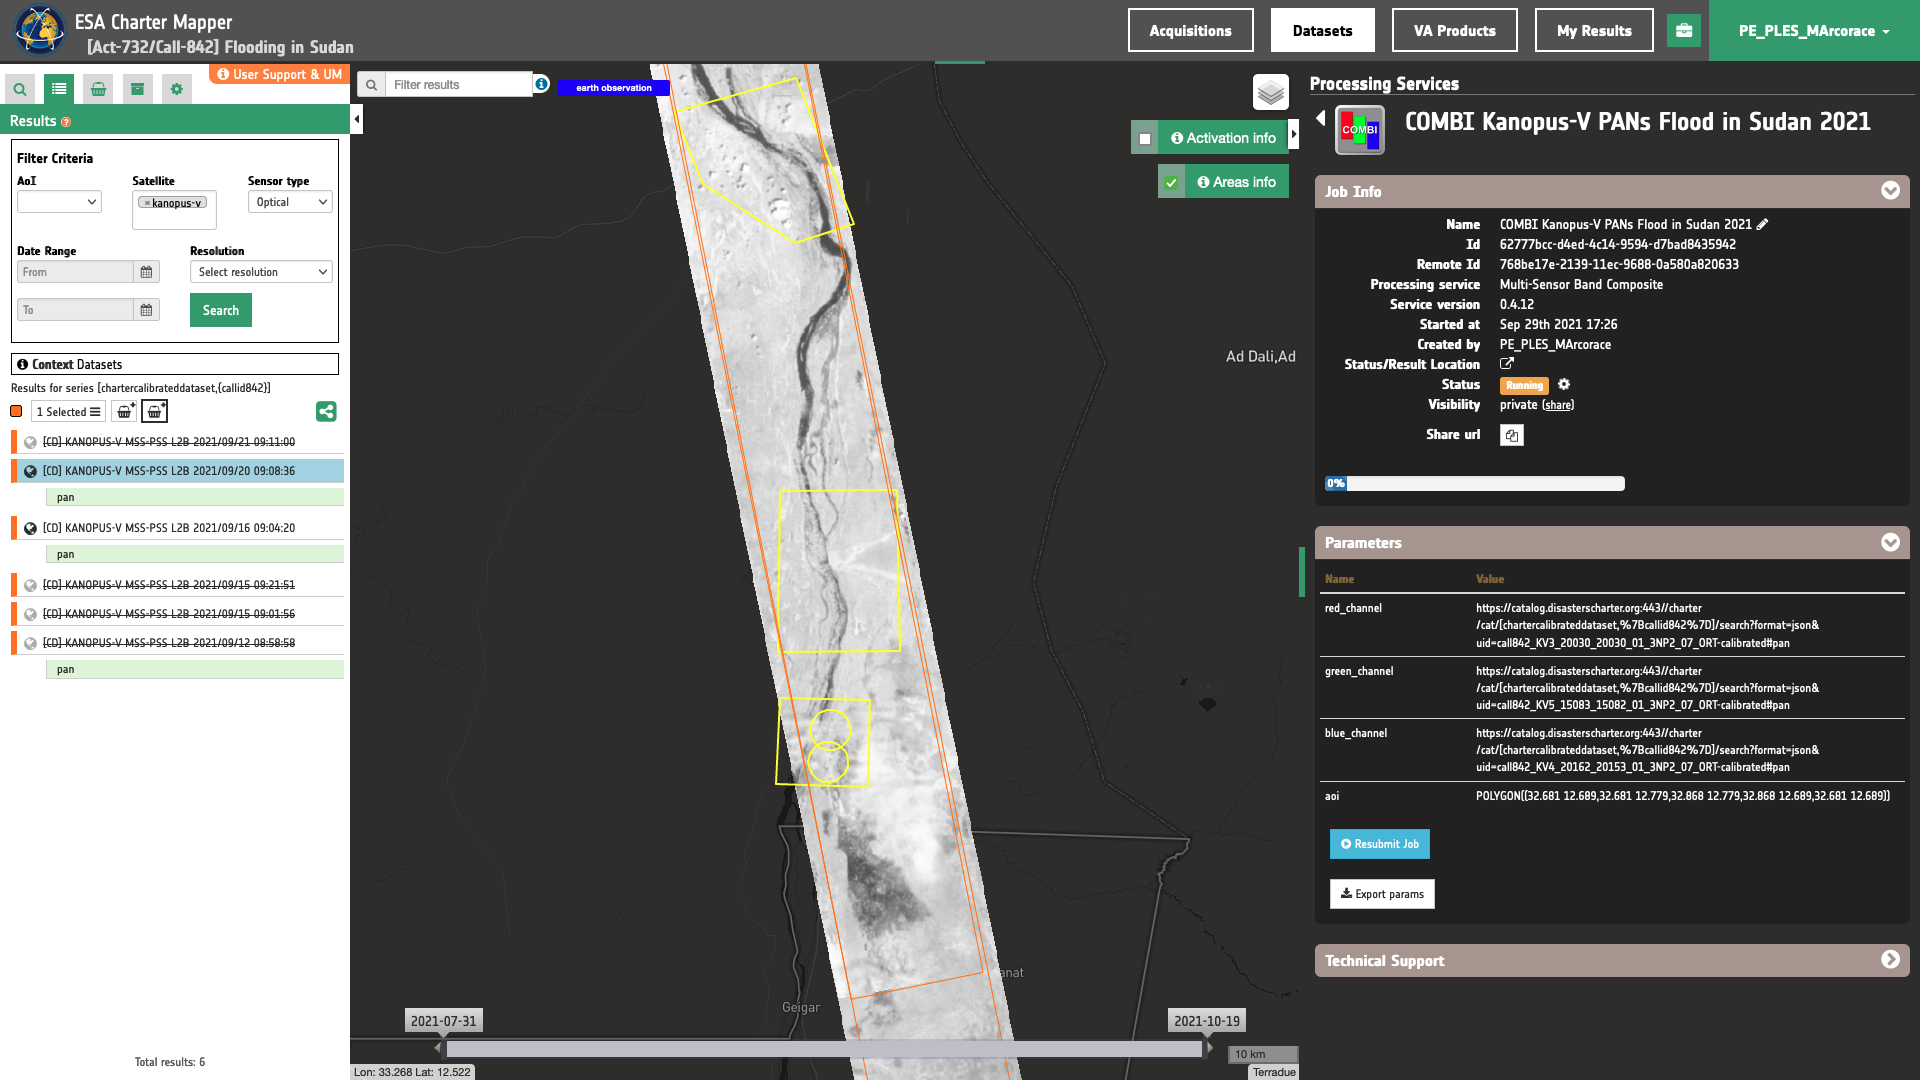
You can monitor job progress through the progress bar.
Results
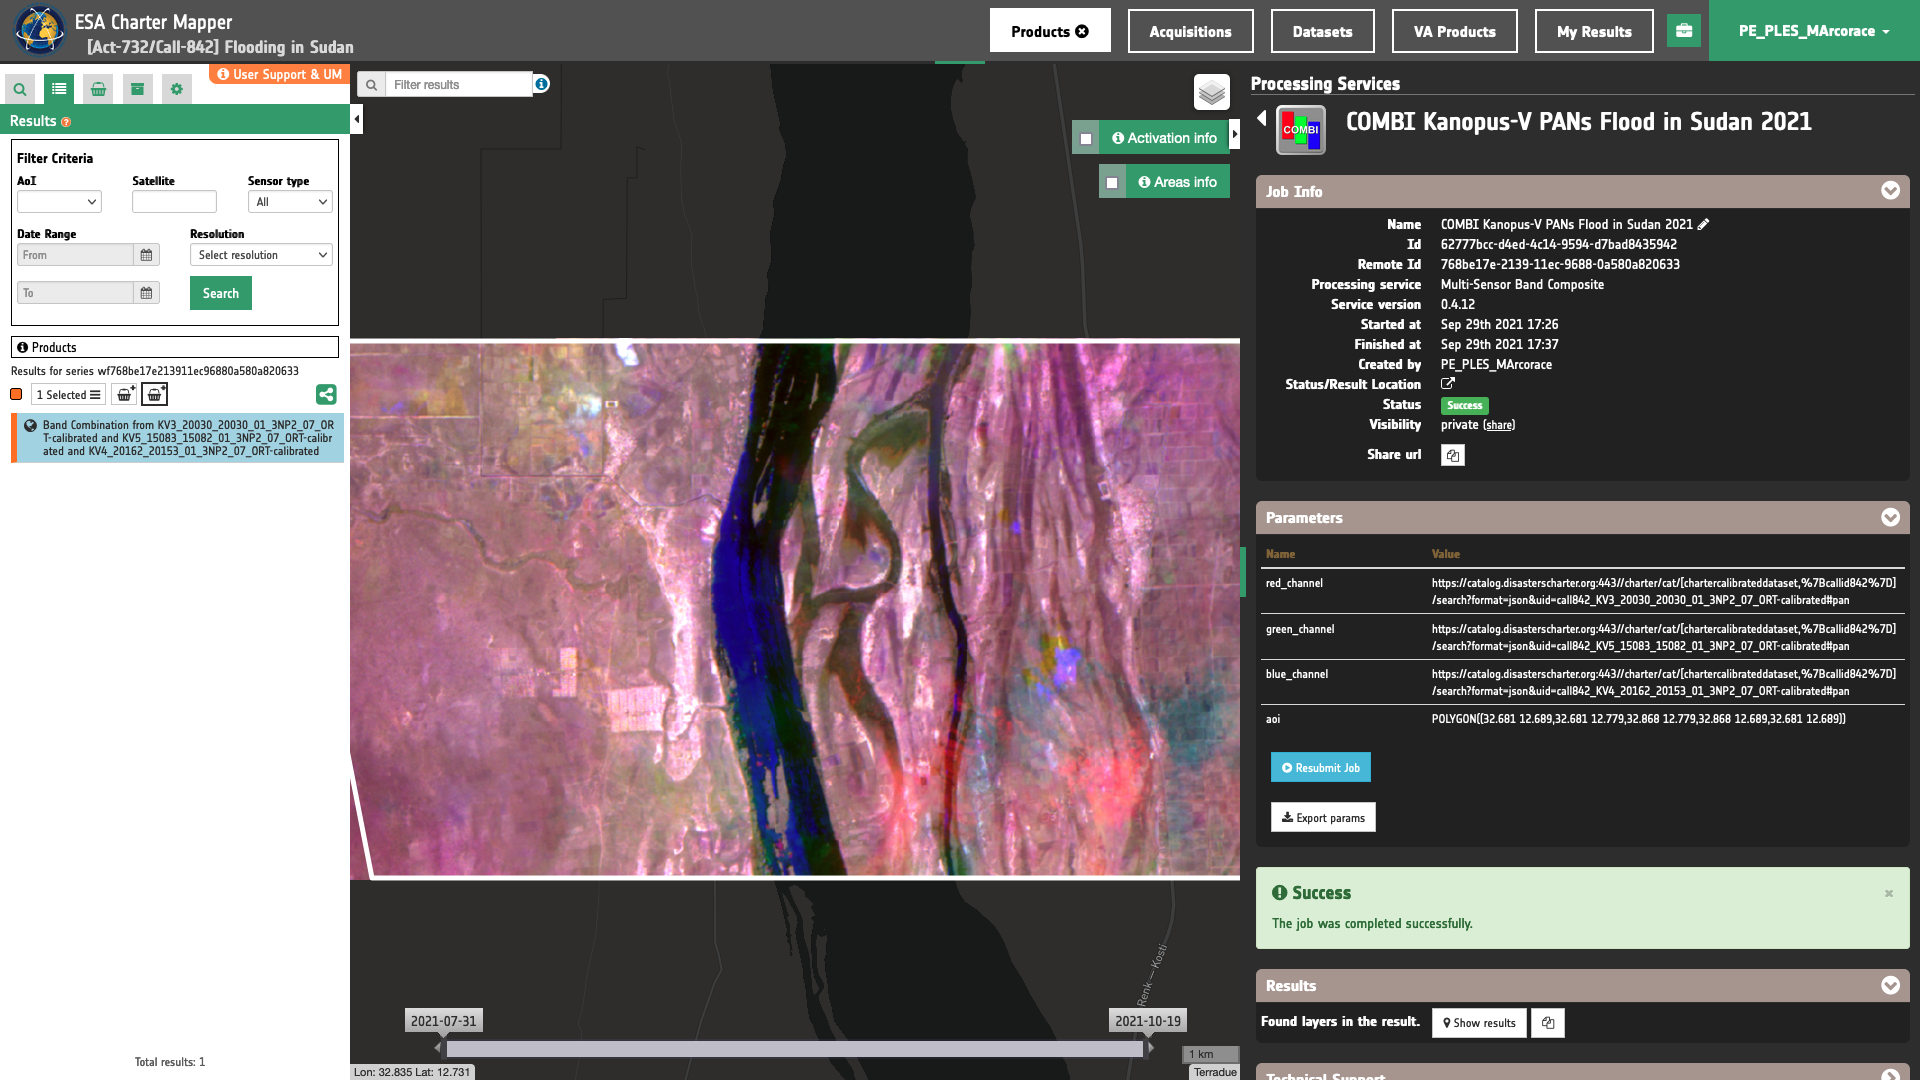
Once the job is completed, click on the button Show results in the processing service tab.
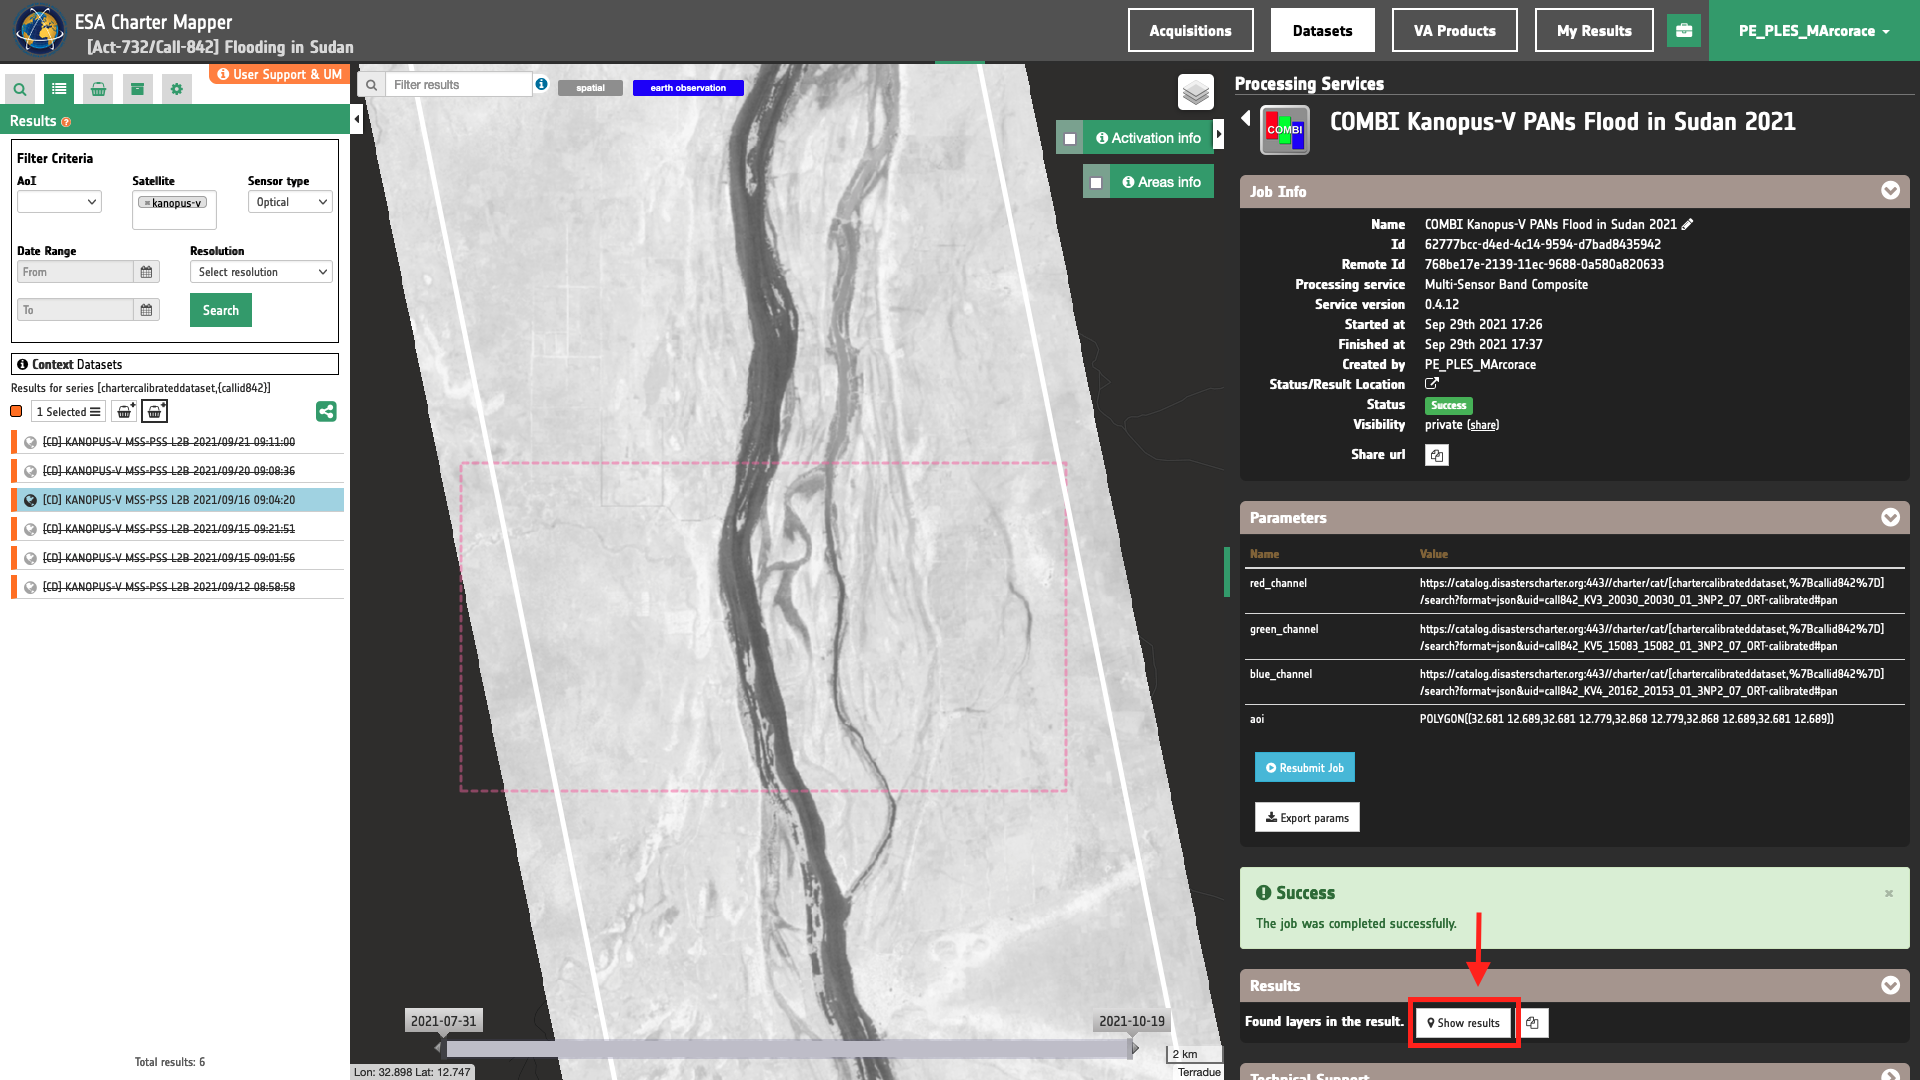
See the result on the map, the preview appears within the area defined in the spatial filter.
Tip
You can also save the parameters employed in this job by clicking on the Export params button in the right panel. This allows you to copy all your entries to the clipboard. This is meant to be used for a quick re-submission of a similar job after a fine tuning of the parameters (e.g. to add a color formula later).
Below is reported the syntax which includes all the parameters employed in this example.
{
   "red_channel": "https://catalog.disasterscharter.org:443//charter/cat/[chartercalibrateddataset,%7Bcallid842%7D]/search?format=json&uid=call842_KV3_20030_20030_01_3NP2_07_ORT-calibrated#pan",
   "green_channel": "https://catalog.disasterscharter.org:443//charter/cat/[chartercalibrateddataset,%7Bcallid842%7D]/search?format=json&uid=call842_KV5_15083_15082_01_3NP2_07_ORT-calibrated#pan",
   "blue_channel": "https://catalog.disasterscharter.org:443//charter/cat/[chartercalibrateddataset,%7Bcallid842%7D]/search?format=json&uid=call842_KV4_20162_20153_01_3NP2_07_ORT-calibrated#pan",
   "aoi": "POLYGON((32.681 12.689,32.681 12.779,32.868 12.779,32.868 12.689,32.681 12.689))"
}
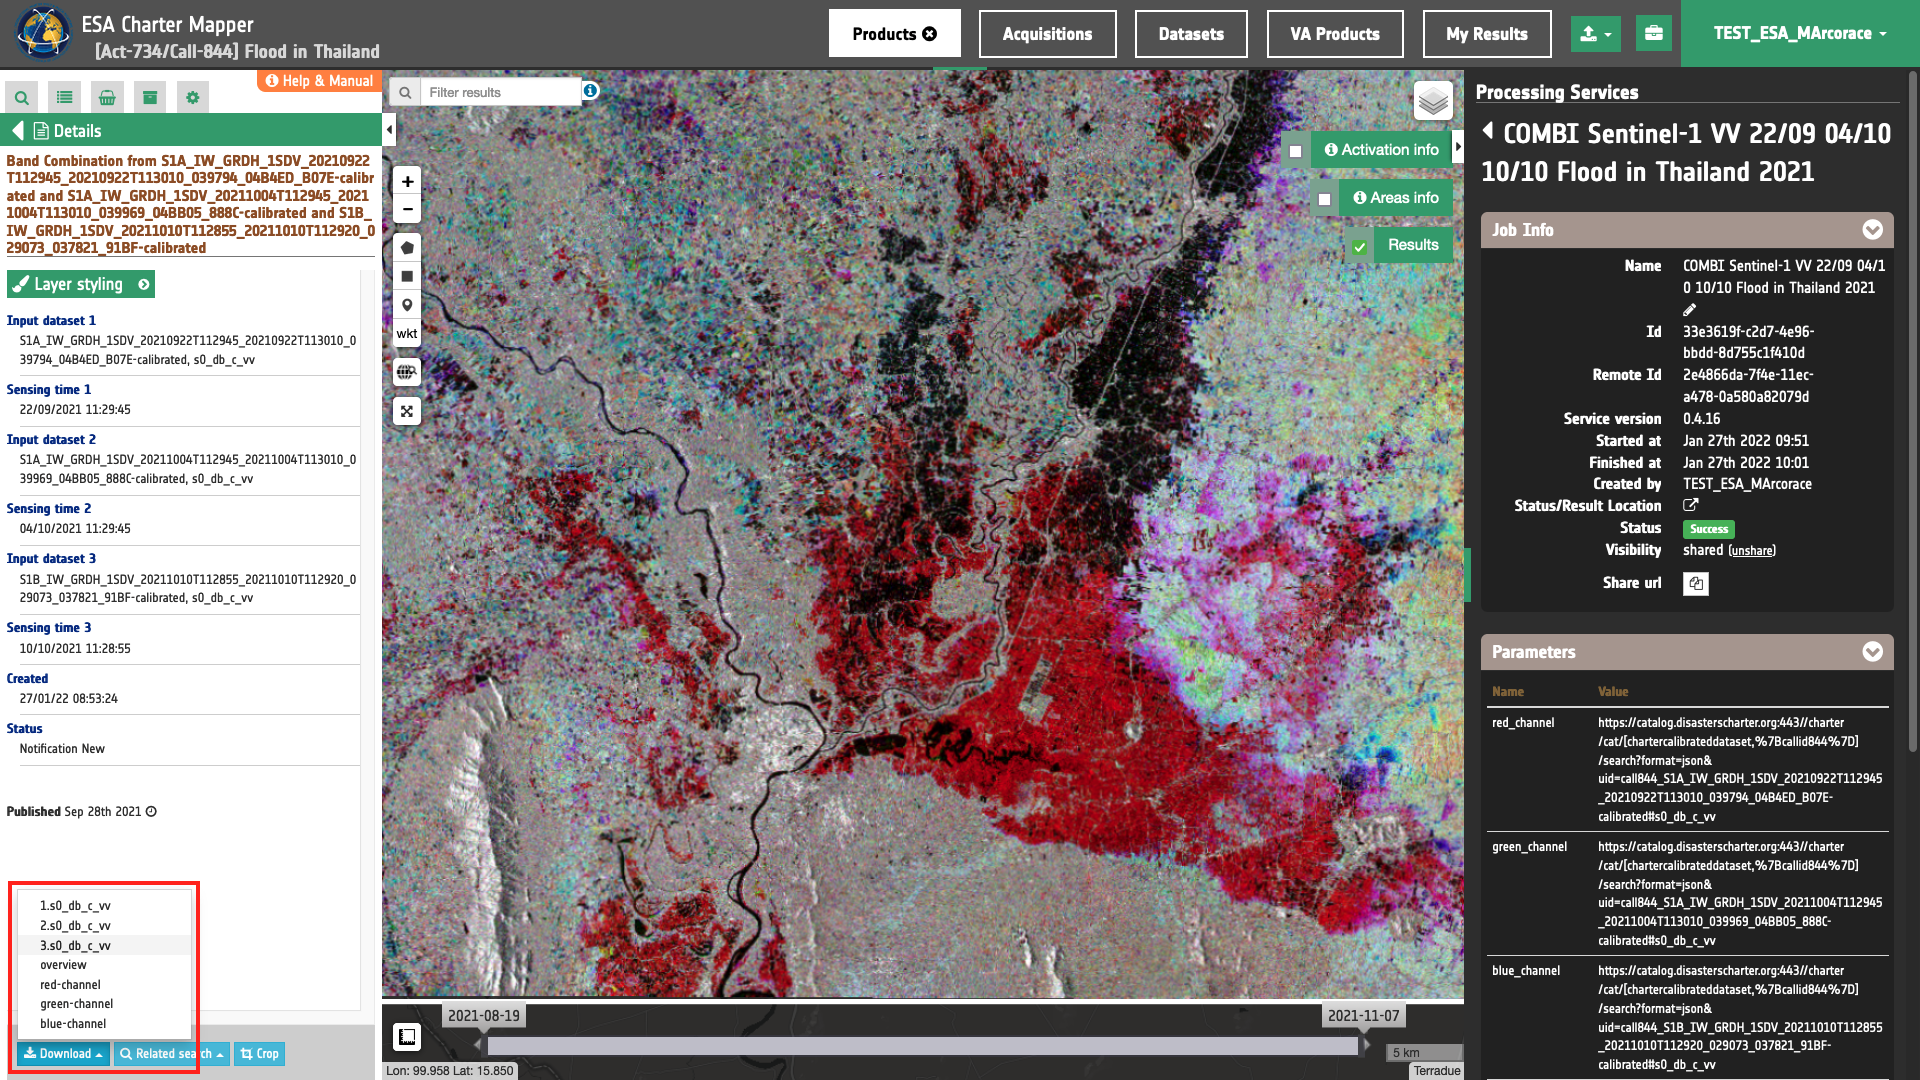
Visualization
See the result on the map. The preview appears within the area defined in the spatial filter.
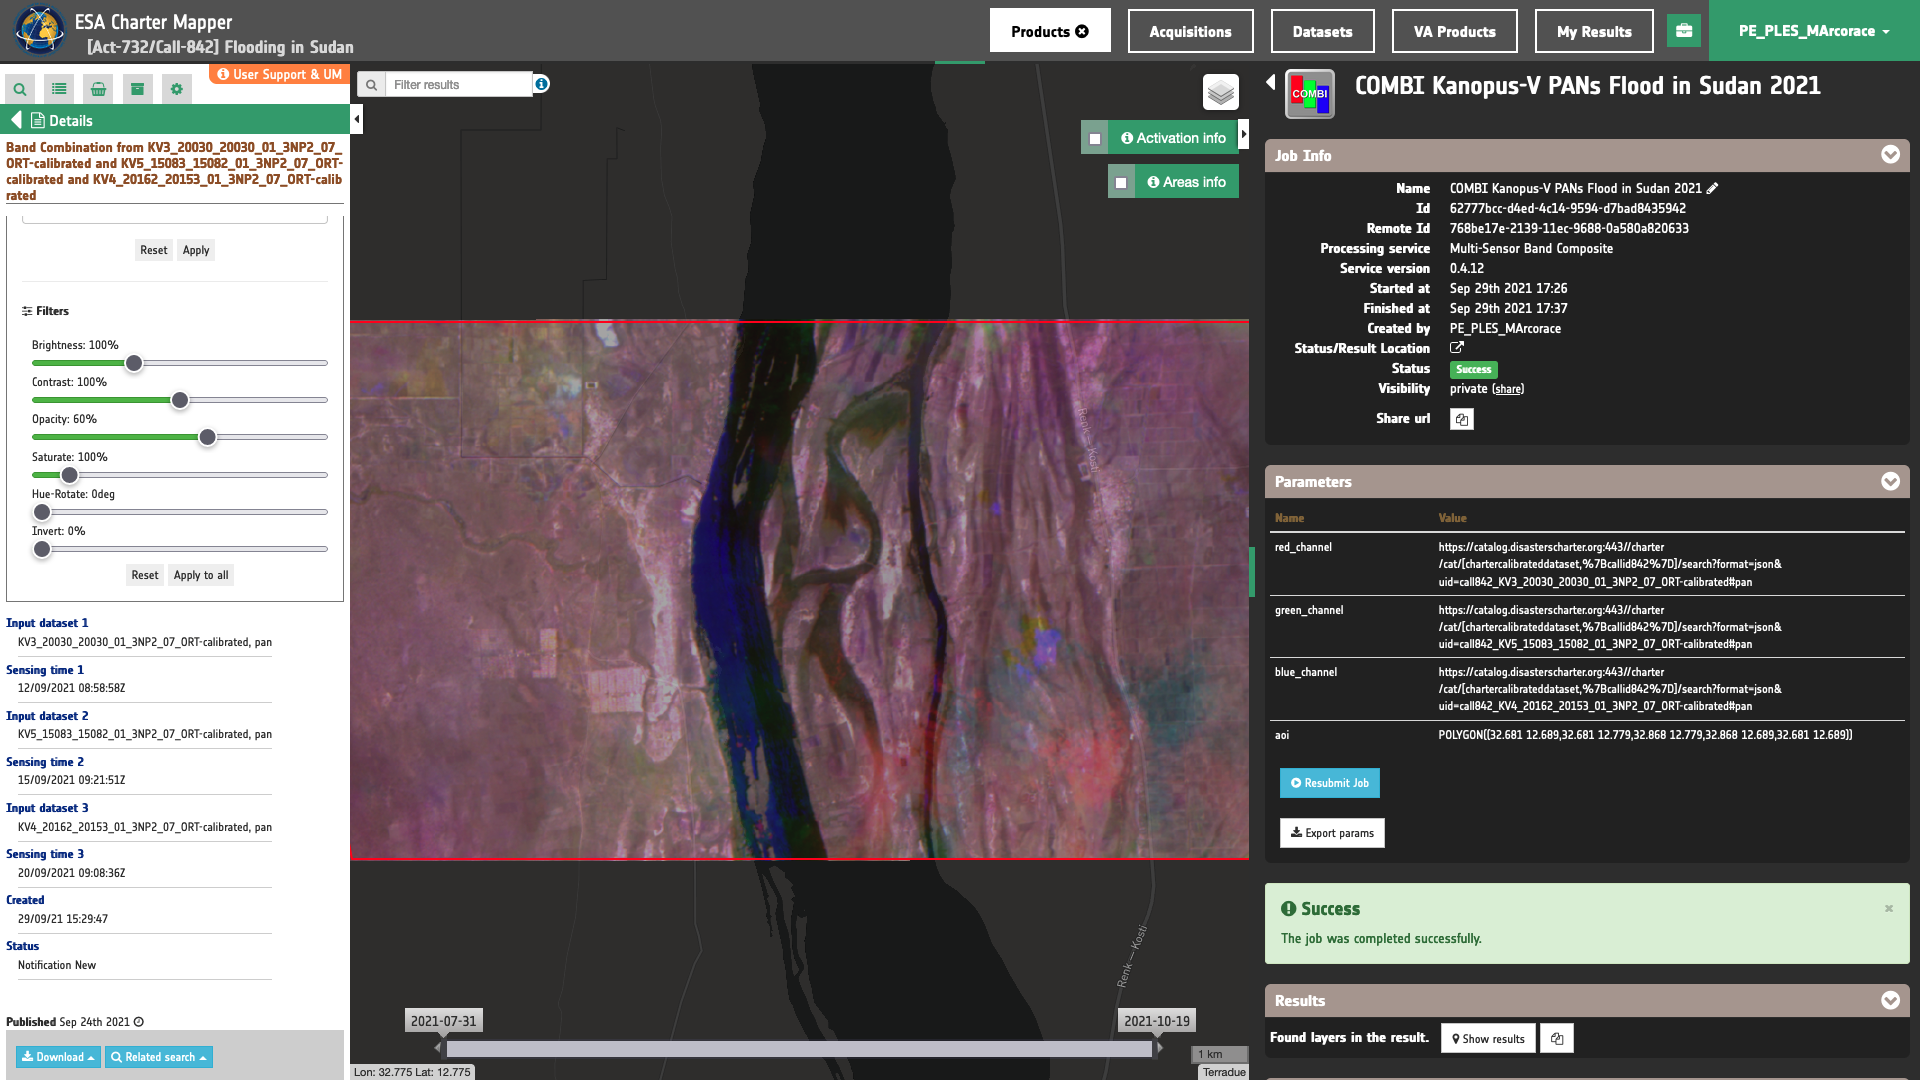
To get more information about the product just click on the preview in the map, a bubble showing the name of the layer Band Combination from KV3_20030_20030_01_3NP2_07_ORT-calibrated and KV5_15083_15082_01_3NP2_07_ORT-calibrated and KV4_20162_20153_01_3NP2_07_ORT-calibrated will appear and then click on the Show details button.
Tip
To quickly access Product Details double click on the layer from the Results list.
In the left panel of the interface, the details of Job Result will appear with Product metadata. Furthermore, by clicking on Layer styling you can also access to the View options. In here it is possible to see histogram/s of the Product which is visible in the map, set color formula, change Filters (e.g. Brightness, Opacity).
Tip
To visually compare the product overview with the underlying base layer (e.g. e.g. Natural Earth or Dark map)) you can set the Opacity filter under View options as 60%.
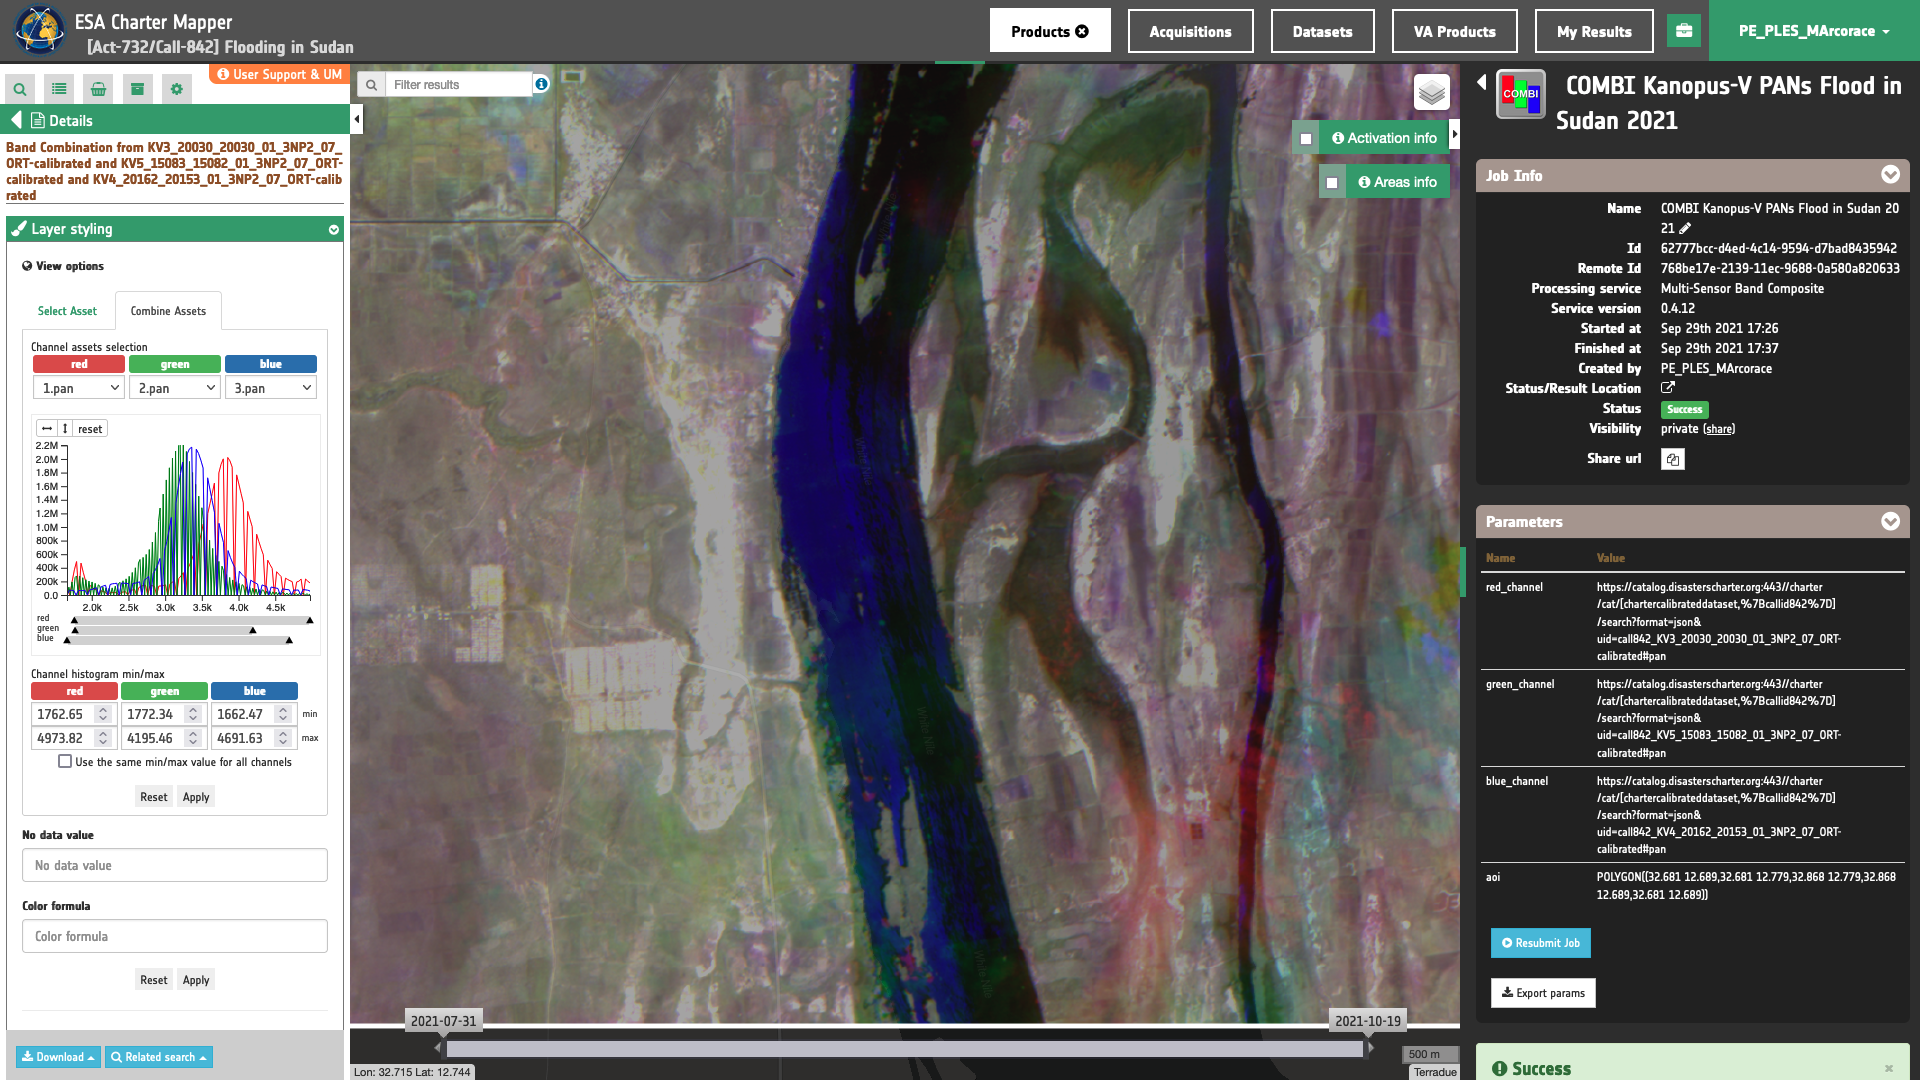
It is also possible to customize the overview on the fly by clicking on Layer Styling and Combine Assets. Min and Max values can be changed for RGB histograms.
Note
In the co-location of input Assets, the output overview and the processed Geophysical Assets have GSD equal to the finest resolution of all input Asset. When necessary, Assets are re-projected using the most common EPSG code of the input Assets.
Download
In the Multi-Sensor Band Composite (COMBI) service the following files are produced:
- 1.pan: asset
panproduct from reference optical calibrated dataset no. 1, as single band GeoTIFF in COG format, - 2.pan: asset
panproduct from reference optical calibrated dataset no. 2, as single band GeoTIFF in COG format, - 3.pan: asset
panproduct from reference optical calibrated dataset no. 3, as single band GeoTIFF in COG format, - overview: output multi-sensor-composite product given as 4 bands RGBA 8-bit GeoTIFF in COG format
- red-channel: R-channel product from Multi-sensor-composite RGBA given as single band 8-bit GeoTIFF in COG format,
- green-channel: G-channel product from Multi-sensor-composite RGBA given as single band 8-bit GeoTIFF in COG format,
- blue-channel: B-channel product from Multi-sensor-composite RGBA given as single band 8-bit GeoTIFF in COG format.
These products can be downloaded by clicking on the Download button located at the bottom of the Product Details tab in the left panel.
Multi-temporal Band Composite with Radar EO data
Abstract
This use case explains how to create a multi-temporal RGB composite from three single band assets acquired from the same radar sensor under different dates.
Find the data using multiple filter criteria
Choose an area in which you want to focus your analysis, e.g over the central region of Thailand.
From the Navigation and Search toolbar (located in the upper left side of the map), click on Spatial Filter and draw a square AOI over the Nakhon Sawan Province in Thailand. This spatial filter allows you to select only the EO data acquired over this area.
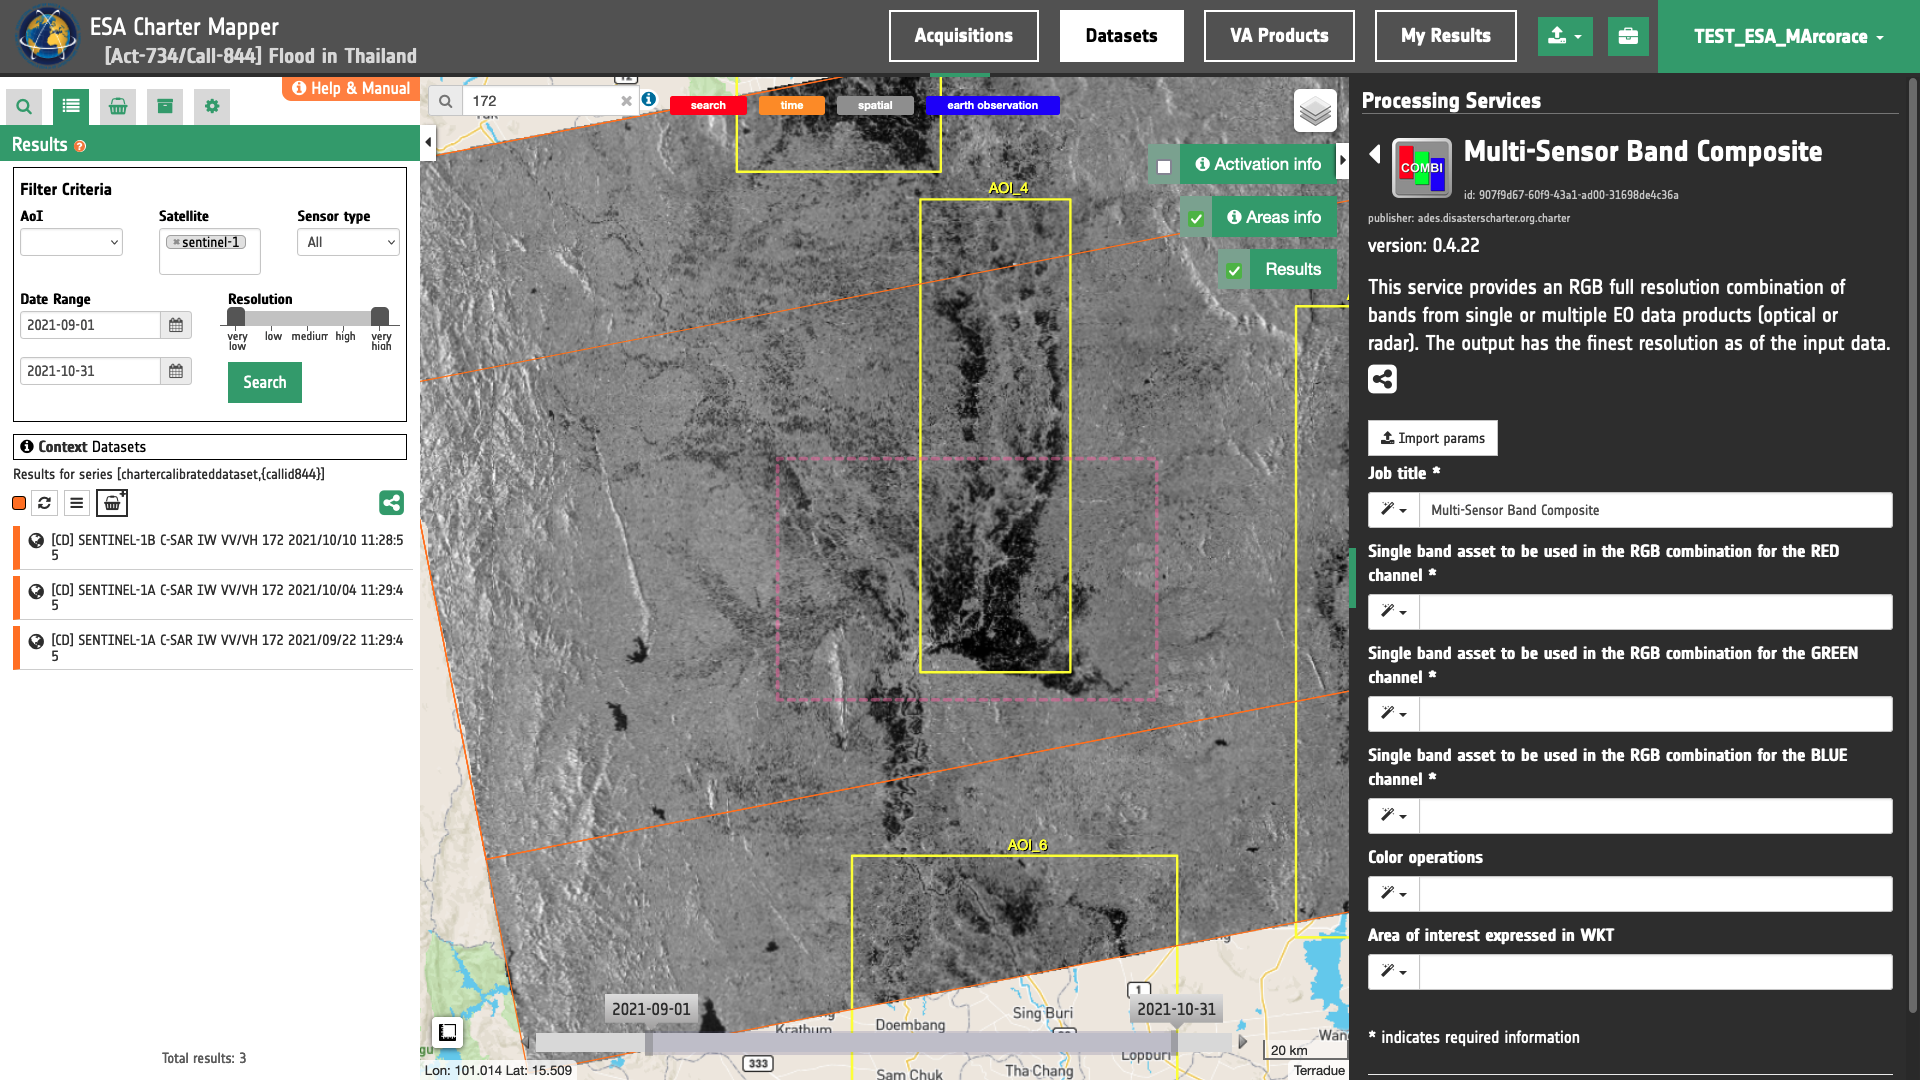
From the top of the left panel, use Filter Criterias to search for “Radar” and "Sentinel-1" data collections from the list.
Now it is possible to choose three SAR Calibrated Datasets to be used for the creation of a multitemporal band composite. Three calibrated datasets having the same relative orbit (172) are chosen to have RGB channels in the same radar geometry.
Tip
To filter results by relative orbit number you can use the Text filter by inserting 172 in the Search Terms text box always visible on the top left of the map.
Note
Useful iformation about Sentinel-1 relative orbits can be found at https://sentinels.copernicus.eu.
After this query the list in the Result panel will be updated as the one shown in the image below.
As an example you can choose the following pair:
-
Reference: SENTINEL-1A C-SAR IW VV/VH 172 2021/09/22 11:29:45
-
Flood image: SENTINEL-1A C-SAR IW VV/VH 172 2021/10/04 11:29:45
Fill the paramters
After the definition of spatial and time filters, you can employ COMBI, by combining, for example, three s0_db_c_vv assets from the three Calibrated Datasets from Sentinel-1 data:
-
SENTINEL-1A C-SAR IW VV/VH 172 2021/09/22 11:29:45
-
SENTINEL-1A C-SAR IW VV/VH 172 2021/10/04 11:29:45
-
SENTINEL-1A C-SAR IW VV/VH 172 2021/10/10 11:29:45
To do so you can fill the parameters as described in the following sections.
Job name
- Insert as job name:
COMBI Sentinel-1 VV 22/09 04/10 10/10 Flood in Thailand 2021
Reference input
-
Drag and Drop the band
s0_db_c_vvfrom the assets of the Sentinel-1 Calibrated Dataset no.1 in theRED channelfield. -
Drag and Drop the band
s0_db_c_vvfrom the assets of the Sentinel-1 Calibrated Dataset no.2 in theGREEN channelfield. -
Drag and Drop the band
s0_db_c_vvfrom the assets of the Sentinel-1 Calibrated Dataset no.3 in theBLUE channelfield.
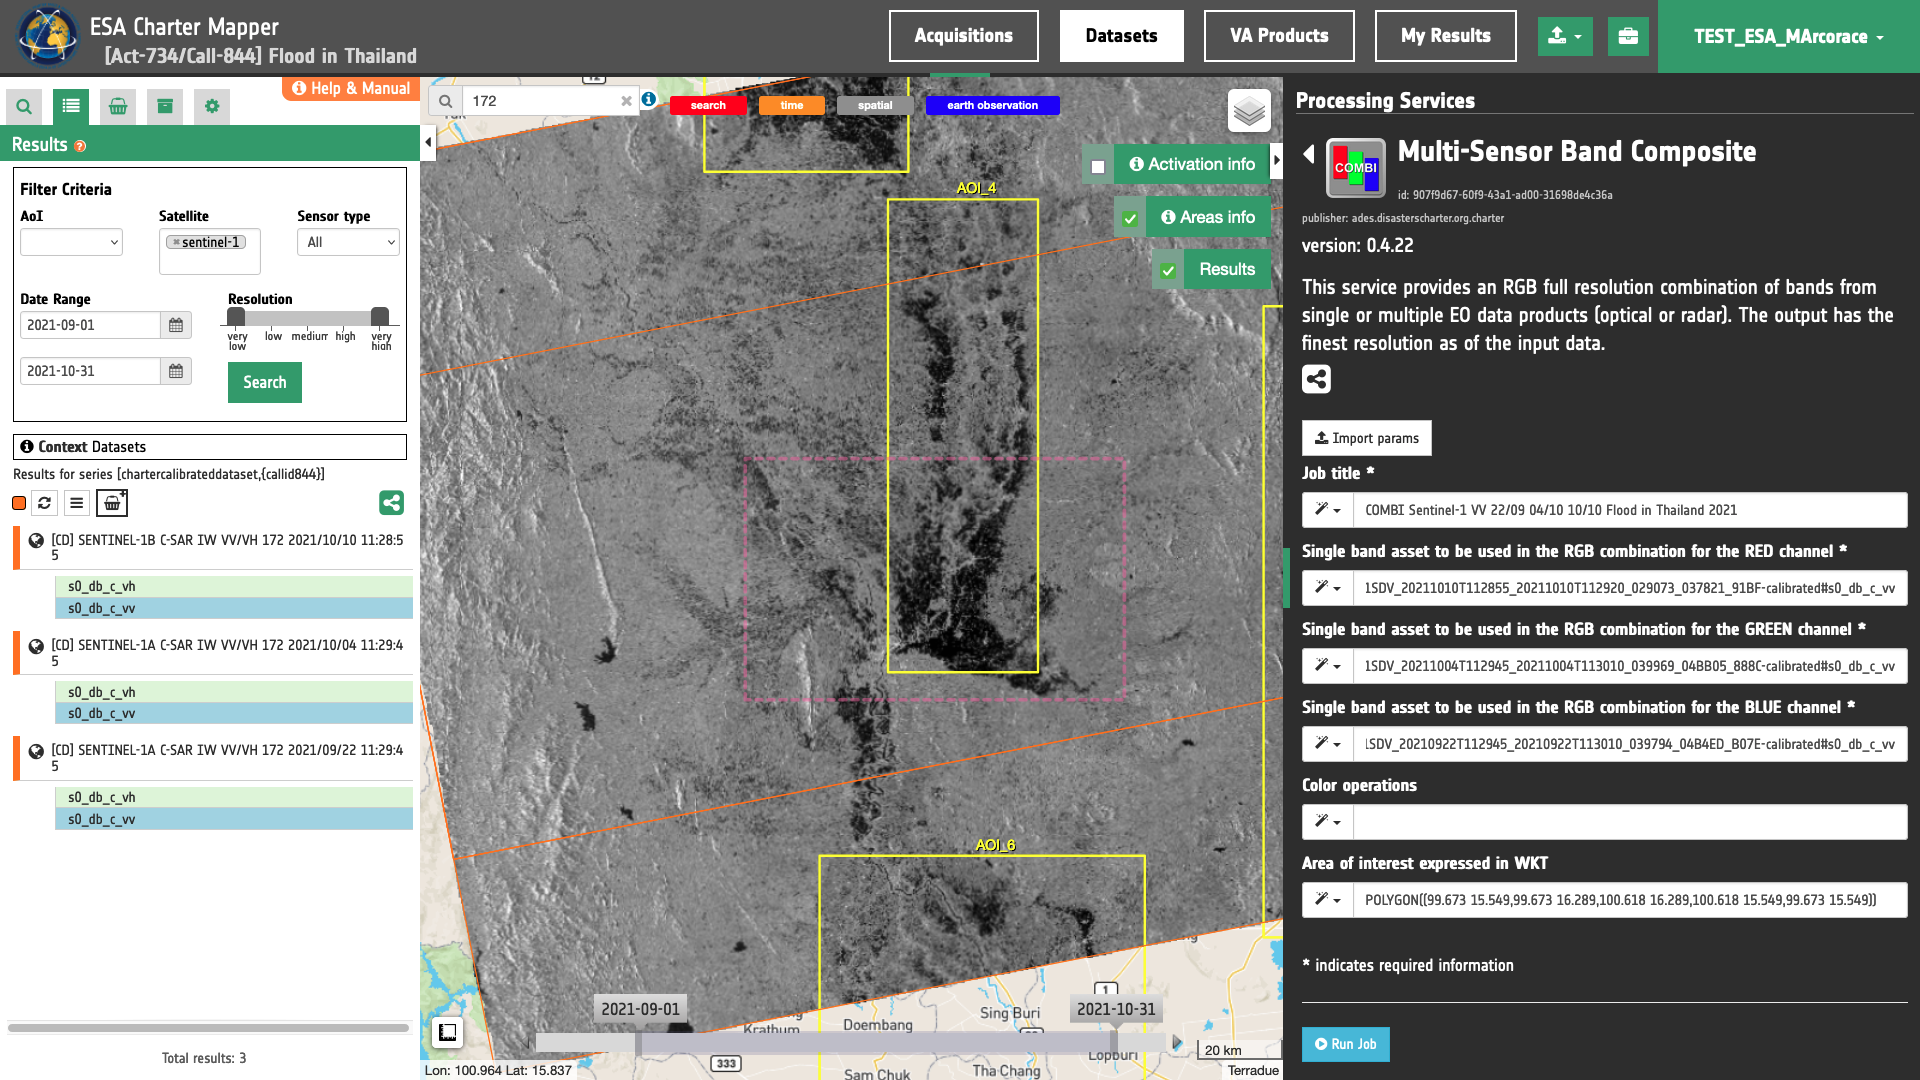
Warning
Drag and drop the single-band asset (e.g. "s0_db_c_vv") and not the Dataset (e.g. "[CD] SENTINEL-1A C-SAR IW VV/VH 172 2021/09/22 11:29:45") into the R- G-, B-channel fields.
Area of interest expressed in WKT
The “Area of interest as Well Known Text” can be defined by using the drawn polygon defined with the area filter.
Tip
To automatically define the WKT values click on the Magic tool wizard button in the left side of the "Area of interest expressed as Well-known text" box and select the option AOI from the list. The platform will automatically fill the parameter value with the rectangular bounding box taken from current search area in WKT format.
Note
This parameter is optional.
Run the job
Click on the button Run Job and see the Running Job. You can monitor job progress through the progress bar.
Results
Once the job is completed, click on the button Show results in the processing service tab. See the result on the map, COMBI overview appears within the area defined in the spatial filter.
Tip
You can also save the parameters employed in this job by clicking on the Export params button in the right panel. This allows you to copy all your entries to the clipboard. This is meant to be used for a quick re-submission of a similar job after a fine tuning of the parameters (e.g. to add a color formula later).
Below is reported the syntax which includes all the parameters employed in this example.
{
   "red_channel": "https://catalog.disasterscharter.org:443//charter/cat/[chartercalibrateddataset,%7Bcallid844%7D]/search?format=json&uid=call844_S1A_IW_GRDH_1SDV_20210922T112945_20210922T113010_039794_04B4ED_B07E-calibrated#s0_db_c_vv",
   "green_channel": "https://catalog.disasterscharter.org:443//charter/cat/[chartercalibrateddataset,%7Bcallid844%7D]/search?format=json&uid=call844_S1A_IW_GRDH_1SDV_20211004T112945_20211004T113010_039969_04BB05_888C-calibrated#s0_db_c_vv",
   "blue_channel": "https://catalog.disasterscharter.org:443//charter/cat/[chartercalibrateddataset,%7Bcallid844%7D]/search?format=json&uid=call844_S1B_IW_GRDH_1SDV_20211010T112855_20211010T112920_029073_037821_91BF-calibrated#s0_db_c_vv",
   "aoi": "POLYGON((99.673 15.549,99.673 16.289,100.618 16.289,100.618 15.549,99.673 15.549))"
}
Visualization
See the result on the map. The preview appears within the area defined in the spatial filter.
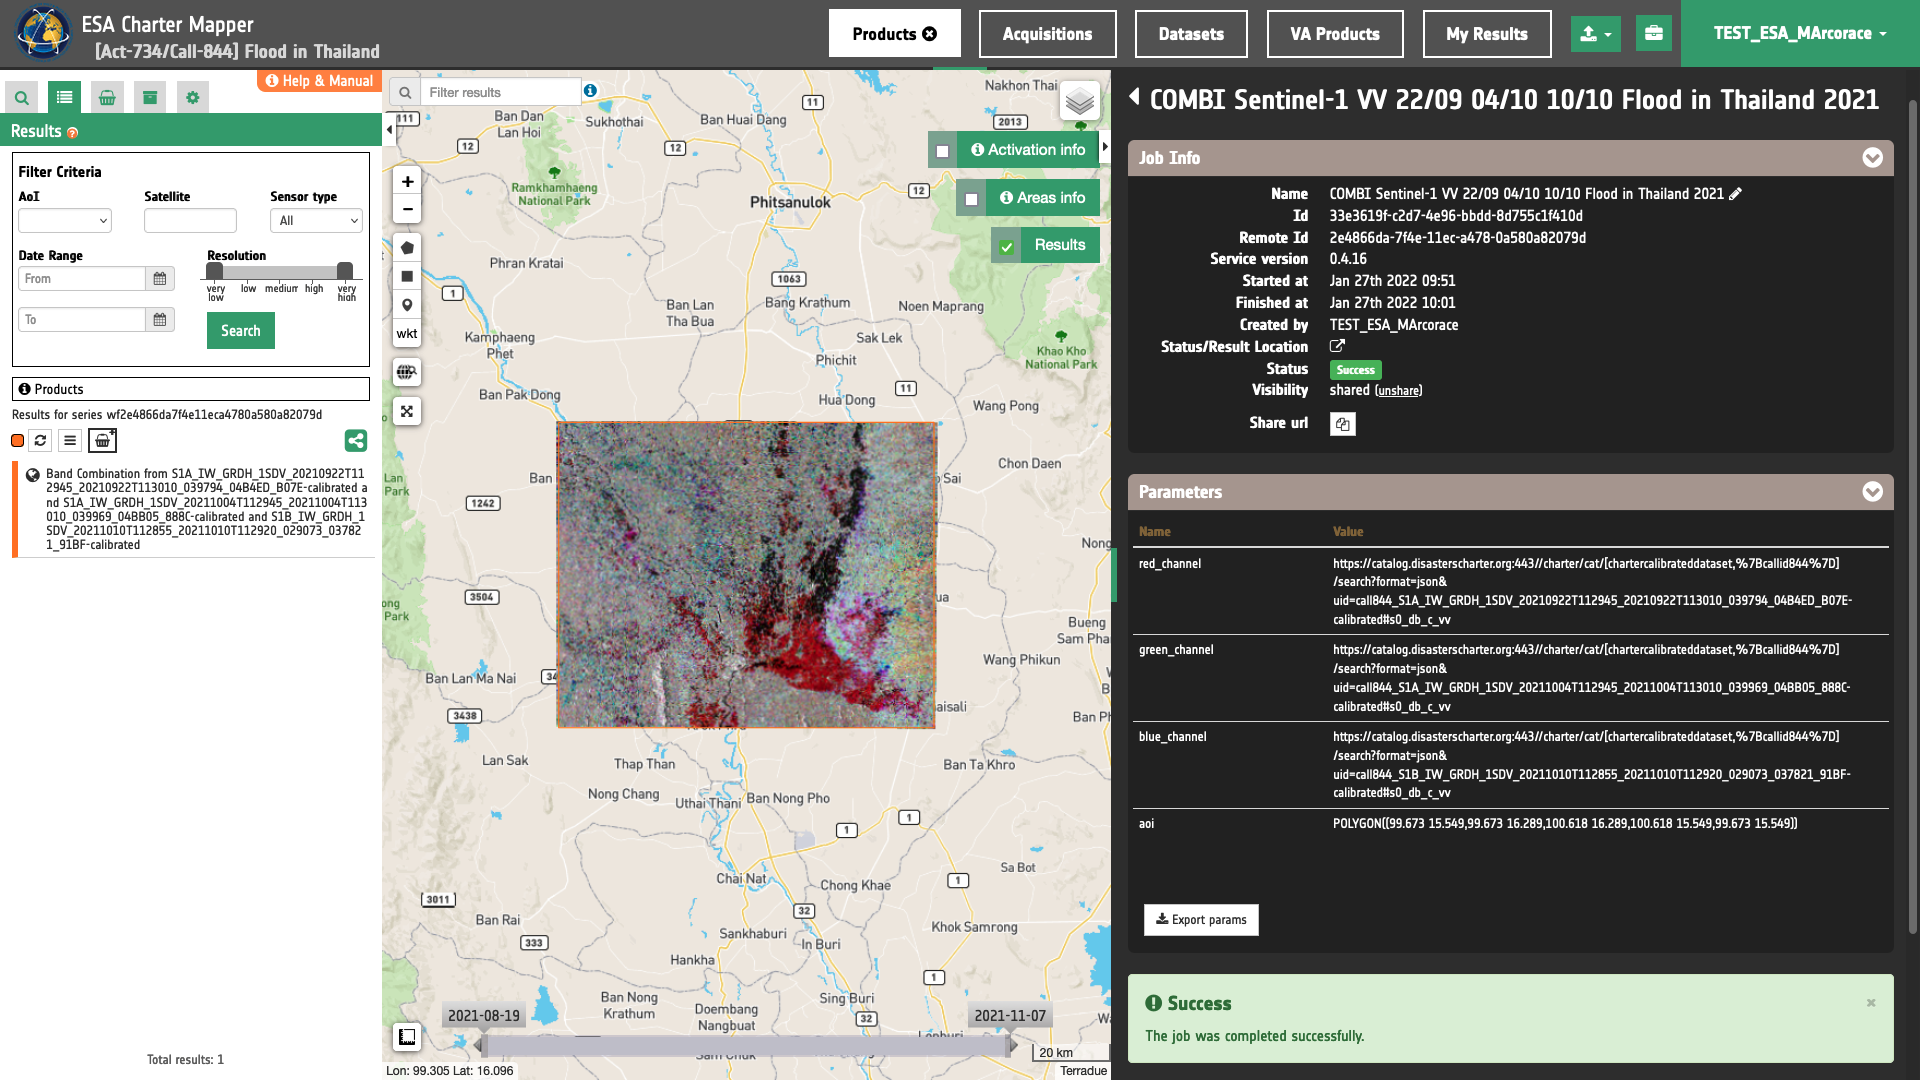
To get more information about the product just click on the preview in the map, a bubble showing the name of the layer Band Combination from S1A_IW_GRDH_1SDV_20210922T112945_20210922T113010_039794_04B4ED_B07E-calibrated and S1A_IW_GRDH_1SDV_20211004T112945_20211004T113010_039969_04BB05_888C-calibrated and S1B_IW_GRDH_1SDV_20211010T112855_20211010T112920_029073_037821_91BF-calibrated will appear and then click on the Show details button.
Tip
To quickly access Product Details double click on the layer from the Results list.
In the left panel of the interface, the details of Job Result will appear with Product metadata. Furthermore by clicking on Layer styling you can also access to the View options. In here it is possible to see histogram/s of the Product which is visible in the map, set color formula, change Filters (e.g. Brightness, Opacity).
Tip
To visually compare the product overview with the underlying base layer (e.g. e.g. Natural Earth or Dark map)) you can set the Opacity filter under View options as 60%.
It is also possible to customize the overview on the fly by clicking on Layer Styling and Combine Assets. Min and Max values can be changed for RGB histograms.
Note
In the co-location of input Assets, the output overview and the processed Geophysical Assets have GSD equal to the finest resolution of all input Asset. When necessary, Assets are re-projected using the most common EPSG code of the input Assets.
Download
In the Multi-Sensor Band Composite (COMBI) service the following files are produced:
- 1.s0_db_c_vv: asset
s0_db_c_vvproduct from reference calibrated dataset no. 1, as single band GeoTIFF in COG format, - 2.s0_db_c_vv: asset
s0_db_c_vvproduct from reference calibrated dataset no. 2, as single band GeoTIFF in COG format, - 3.s0_db_c_vv: asset
s0_db_c_vvproduct from reference calibrated dataset no. 3, as single band GeoTIFF in COG format, - overview: output multi-sensor-composite product given as 4 bands RGBA 8-bit GeoTIFF in COG format
- red-channel: R-channel product from Multi-sensor-composite RGBA given as single band 8-bit GeoTIFF in COG format,
- green-channel: G-channel product from Multi-sensor-composite RGBA given as single band 8-bit GeoTIFF in COG format,
- blue-channel: B-channel product from Multi-sensor-composite RGBA given as single band 8-bit GeoTIFF in COG format.
To download these products, just click on the Download button located at the bottom of the Product Details tab.