K-means tutorial
![]()
This service performs k-means unsupervised classifications from a set of single-band assets from the same EO mission. A collocation of inputs is made when assets are from multiple Datasets. In this service Principal Component Analysis (PCA) dimensionality reduction algorithm can be used on input assets to do image clustering only on PCA-reduced EO data.
 K-Means service description and specifications are available in this section.
Select the processing service
After the opening of the activation workspace, in the right panel of the interface, open the Processing Services tab. Select the processing service K-means Unsupervised Classifier (K-means).
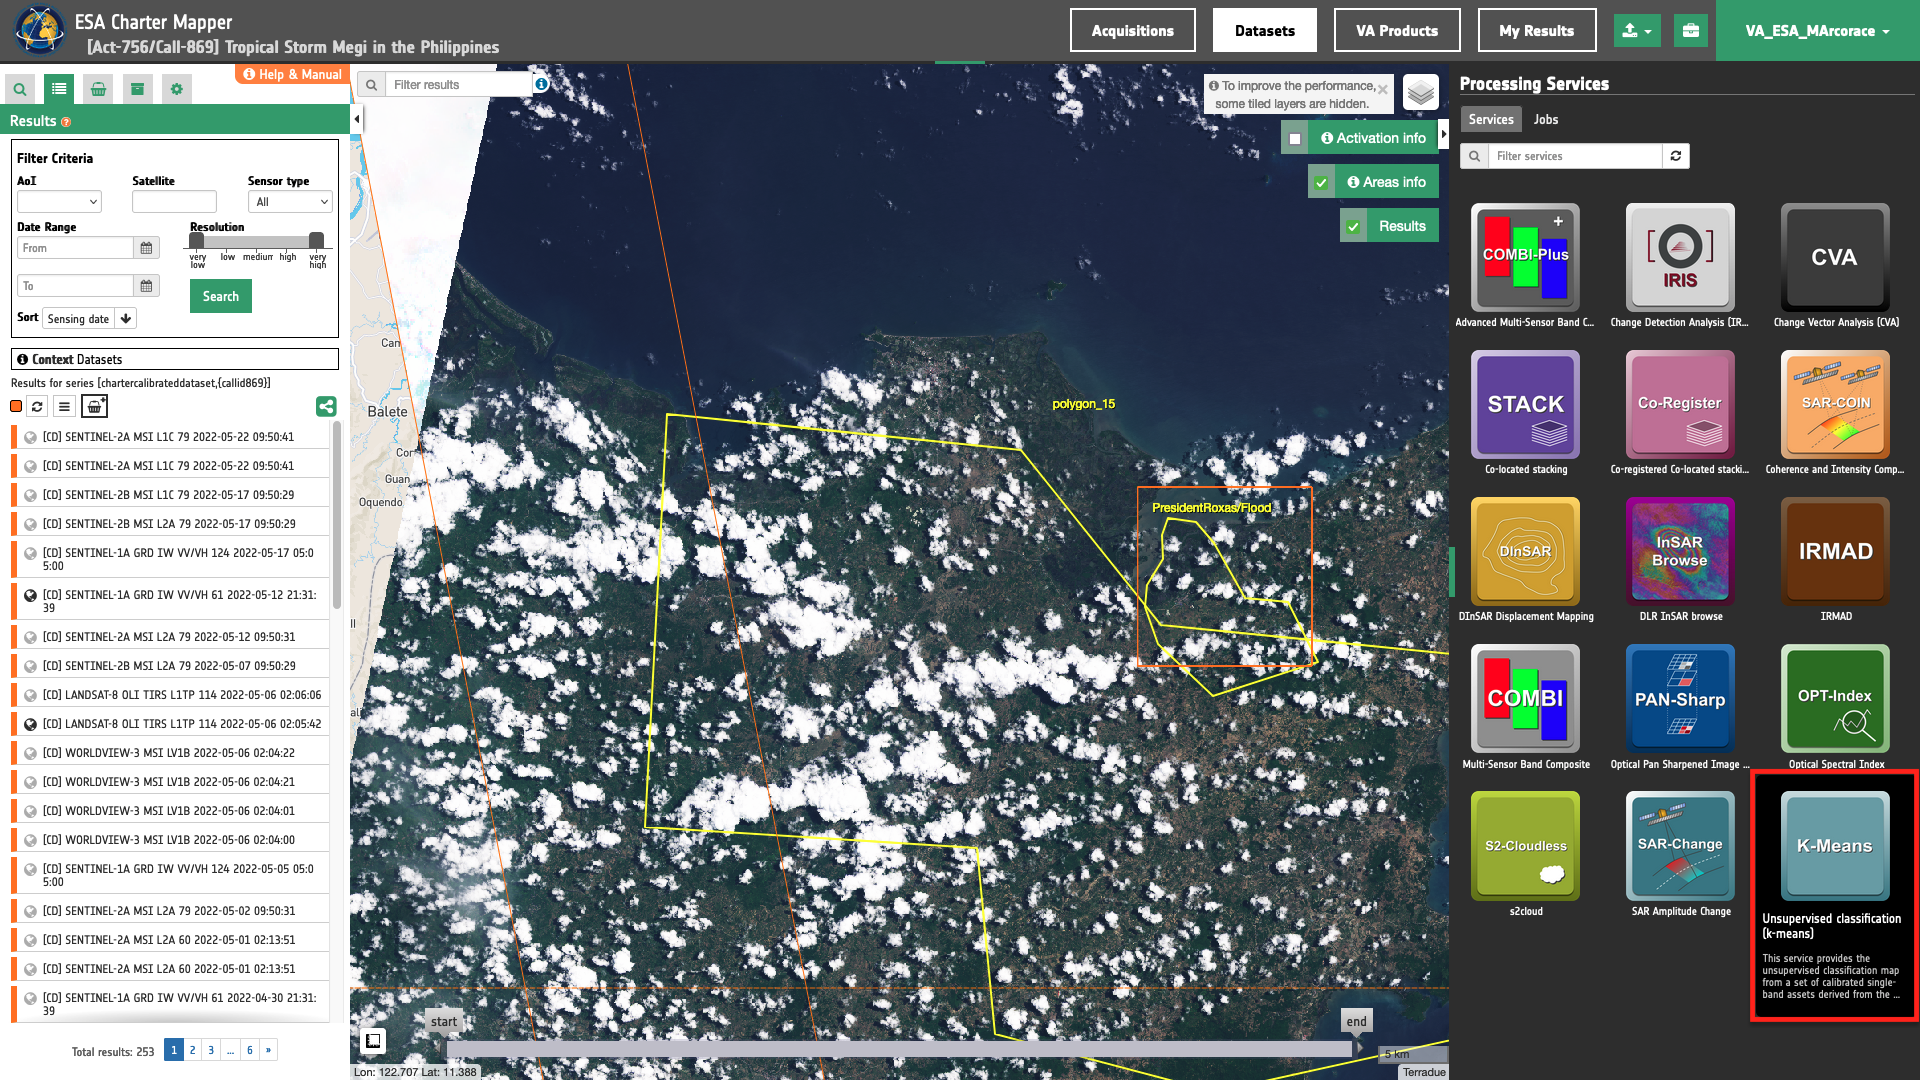
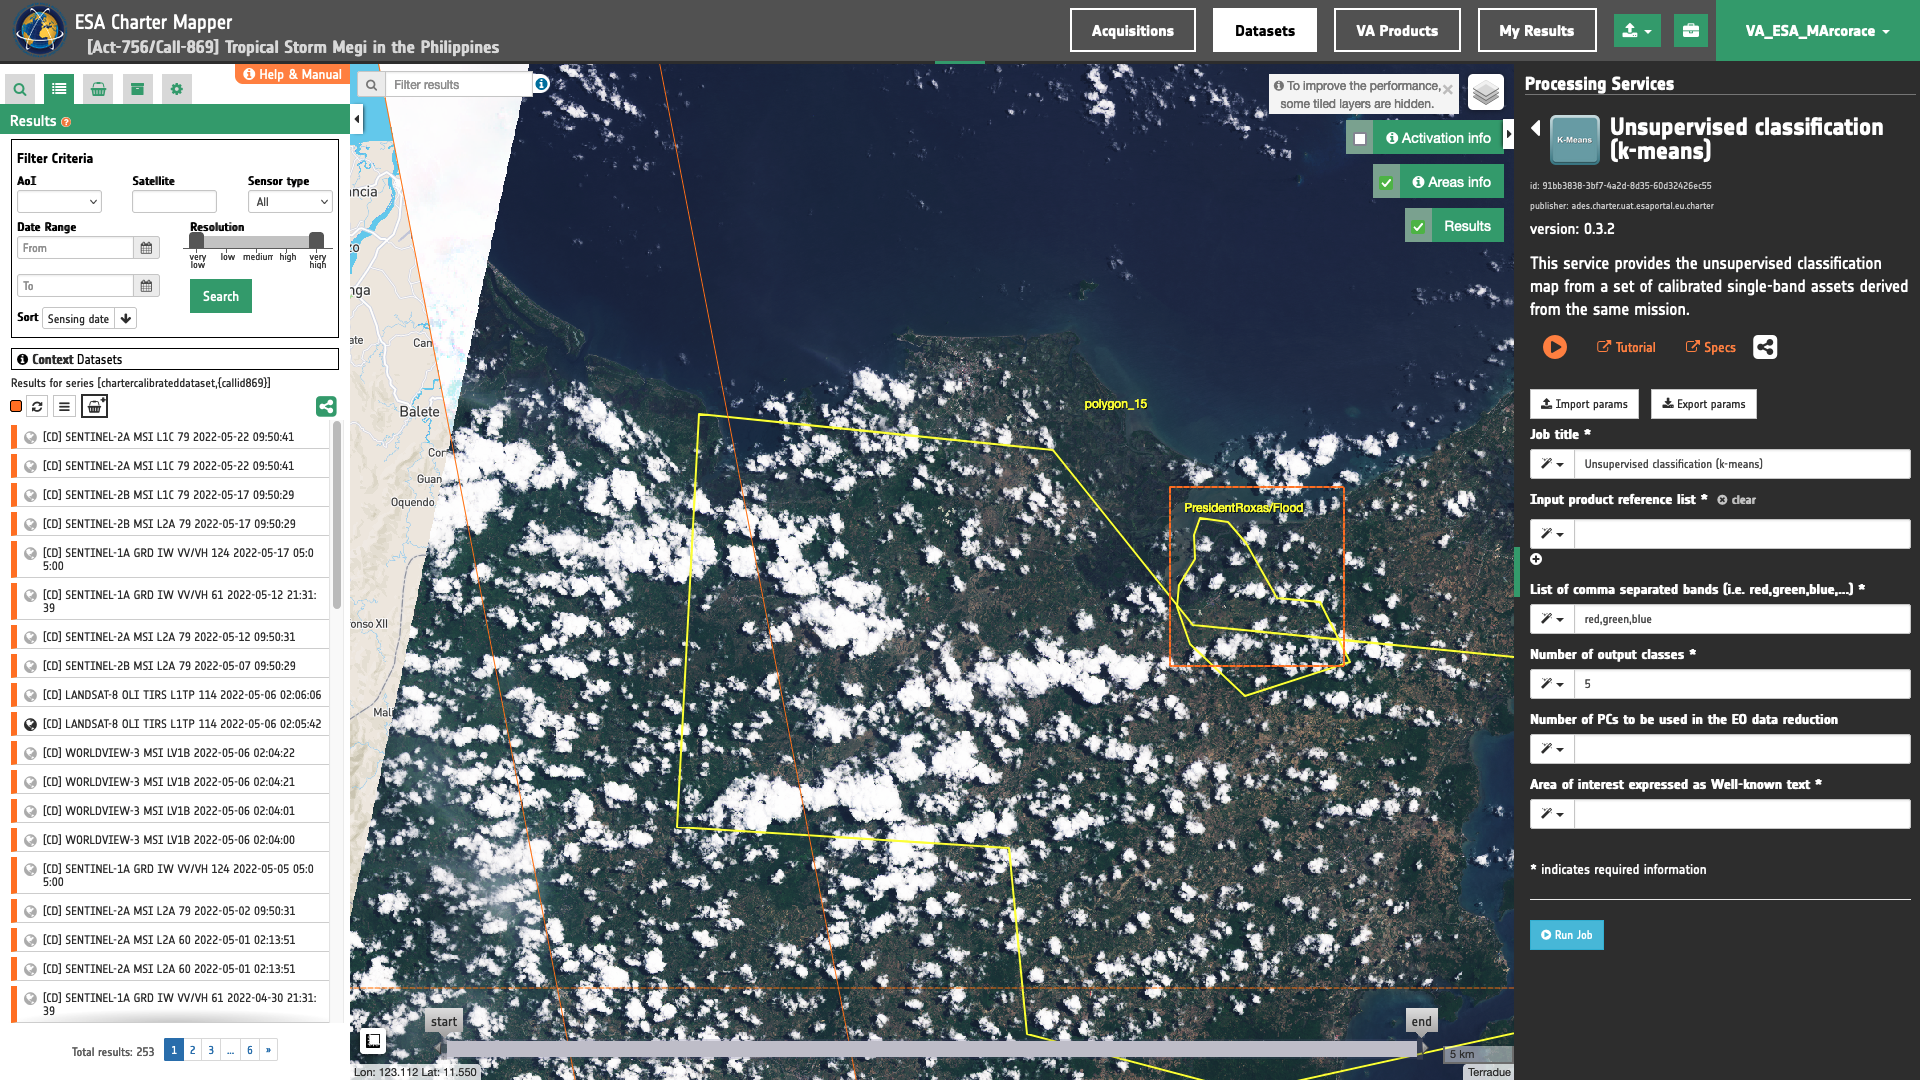
The "K-means Unsupervised Classifier (K-means)" panel is displayed with parameters values to be filled-in.
Use case 1: unsupervised classification of backscatter asset from a single-pol radar calibrated dataset
Abstract
This first use case explains how to derive a classification map from a single Sigma Nought asset.
Find the data using multiple filter criterias
Select the area for which you want to do an analysis, e.g over the floodplain near Ma-ayon, the Philippines.
From the Navigation and Search toolbar (located in the upper left side of the map), click on Spatial Filter and draw a square AOI over the floodplain near Ma-ayon, the Philippines. This spatial filter allows you to select only the EO data acquired over this area.
Tip
Use the Geocoding control to find some places on the map (e.g. Ma-ayon, Capiz, Western Visayas, Philippines). Inserted text could be a country, city name, street, mountain, river, etc.
From the top of the left panel, use Filter Criterias to search for Radar and tsx-1, tdx-1 data collections from the list.
After the query the list will be updated as the one shown in the next image.
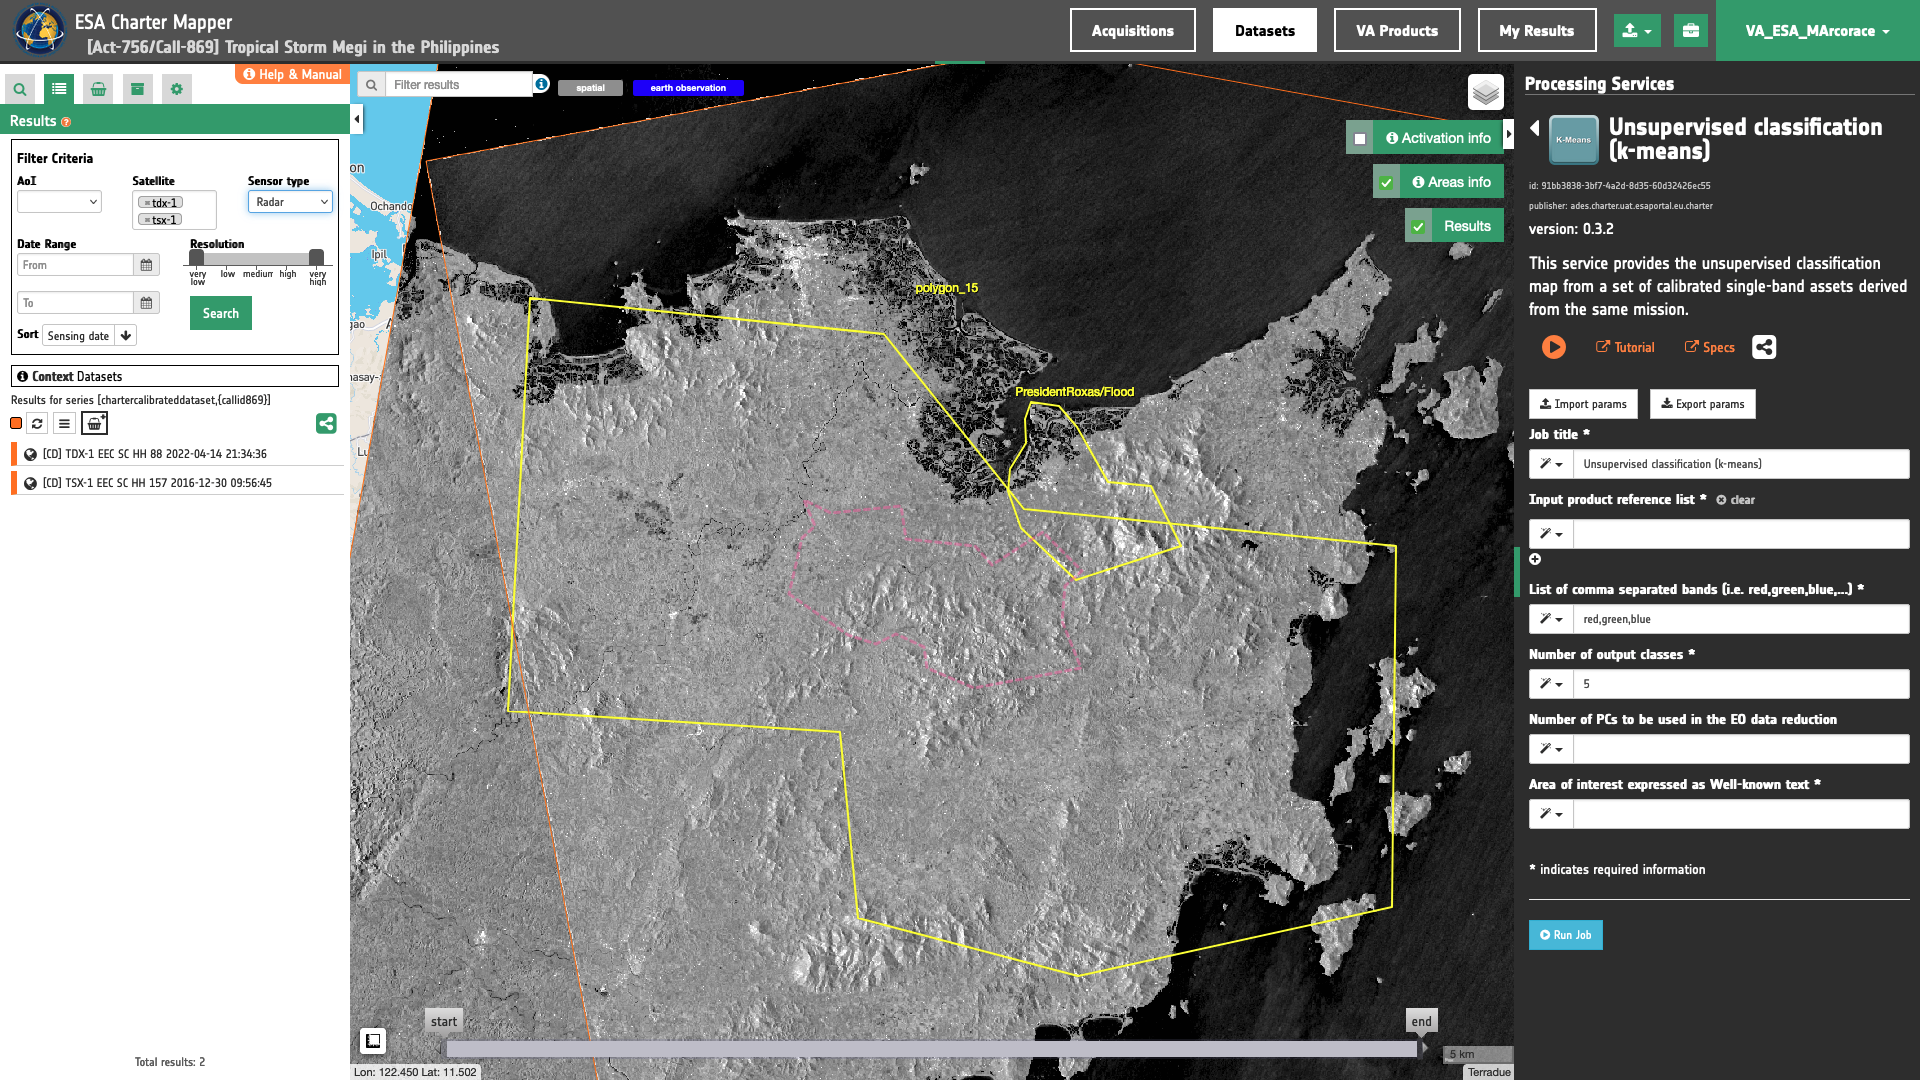
Now it is possible to choose the Radar Calibrated Dataset to be used for the K-means unsupervised classification. As an example you can choose the Dataset:
- [CD]: TDX-1 EEC SC HH 88 2022-04-14 21:34:36
Fill the parameters
After the definition of spatial and time filters, you can employ K-Means, by using the chosen Calibrated Dataset from TanDEM-X data.
To do so you can fill the parameters as described in the following sections.
Job name
- Insert as job name:
K-means 3 classes TDX-1 HH Apr 2022, Ma-ayon, Philippines
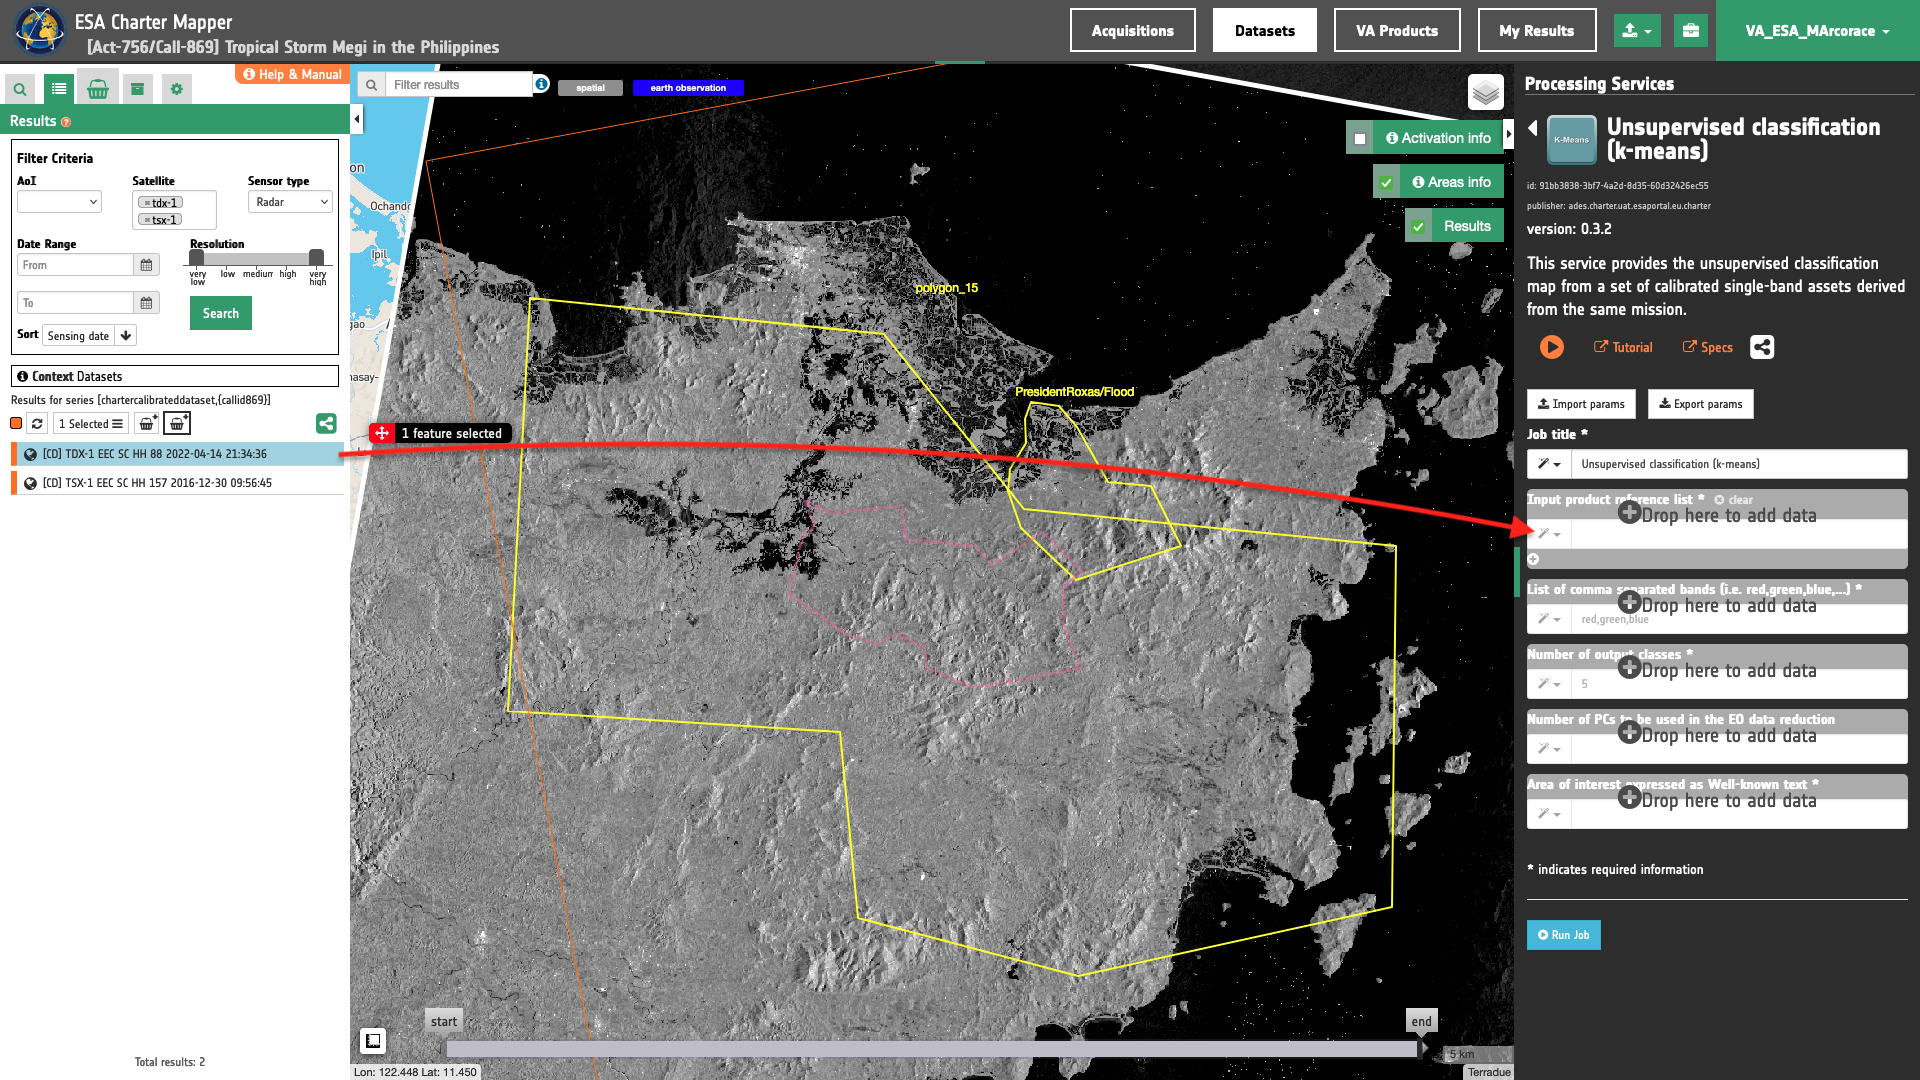
Input product reference list
Drag and Drop the selected Radar Calibrated Dataset item in the Input product reference list field.
List of comma-separated assets
Insert the list of single-band assets to be extracted from the given pair of calibrated datasets in the "List(s) of comma-separated band(s)” field. In this parameter the user must manually insert a list assets given as of comma-separated list of common band names.
To employ K-means using the Sigma0 single-band asset in X-band and HH polarization from the TerraSAR-X radar calibrated dataset the following must be inserted:
s0_db_x_hh
and the service automatically extracts the single-band asset for this specified CBN.
Note
All CBNs available in the ESA Charter Mapper can be found here.
Warning
The input calibrated product reference must include the single-band assets specified in the parameter.
Number of classes
Insert here the Number of Classes (N_C) to be used in the k-means classification. Insert for example 3 as a number of classes.
Warning
The number of Number of Classes (N_C) shall be N_C > 1 and N_C <= 12.
Number of PCs to be used in the EO data reduction (optional)
This optional parameter offers the option to employ the Principal Component Analysis (PCA) dimensionality reduction algorithm by specifying the number of Principal Components to be employed in the k-means classification with PCA EO data reduction. As an example, in case N_PC is equal to 2 the first 2 PCs components are used in the image classification instead of all input assets.
Warning
The number of Principal Components (N_PC) shall be N_PC > 1 and N_PC <= 3.
Being this unsupervised classification of a single image PCA EO data reduction is not needed and the parameter can be left blank.
Note
If the number of Principal Components (N_PC) is not specified the k-means unsupervised classification is made without PCA dimensionality reduction.
Area of interest expressed as Well-known text
Finally, you need to define the “Area of interest as Well Known Text”. The AOI can be defined by using the drawn polygon defined with the area filter.
Tip
In the definition of “Area of interest as Well Known Text” it is possible to apply as AOI the drawn polygon defined with the area filter. To do so, click on the button in the left side of the "Area of interest expressed as Well-known text" box and select the option AOI from the list. The platform will automatically fill the parameter value with the rectangular bounding box taken from current search area in WKT format.
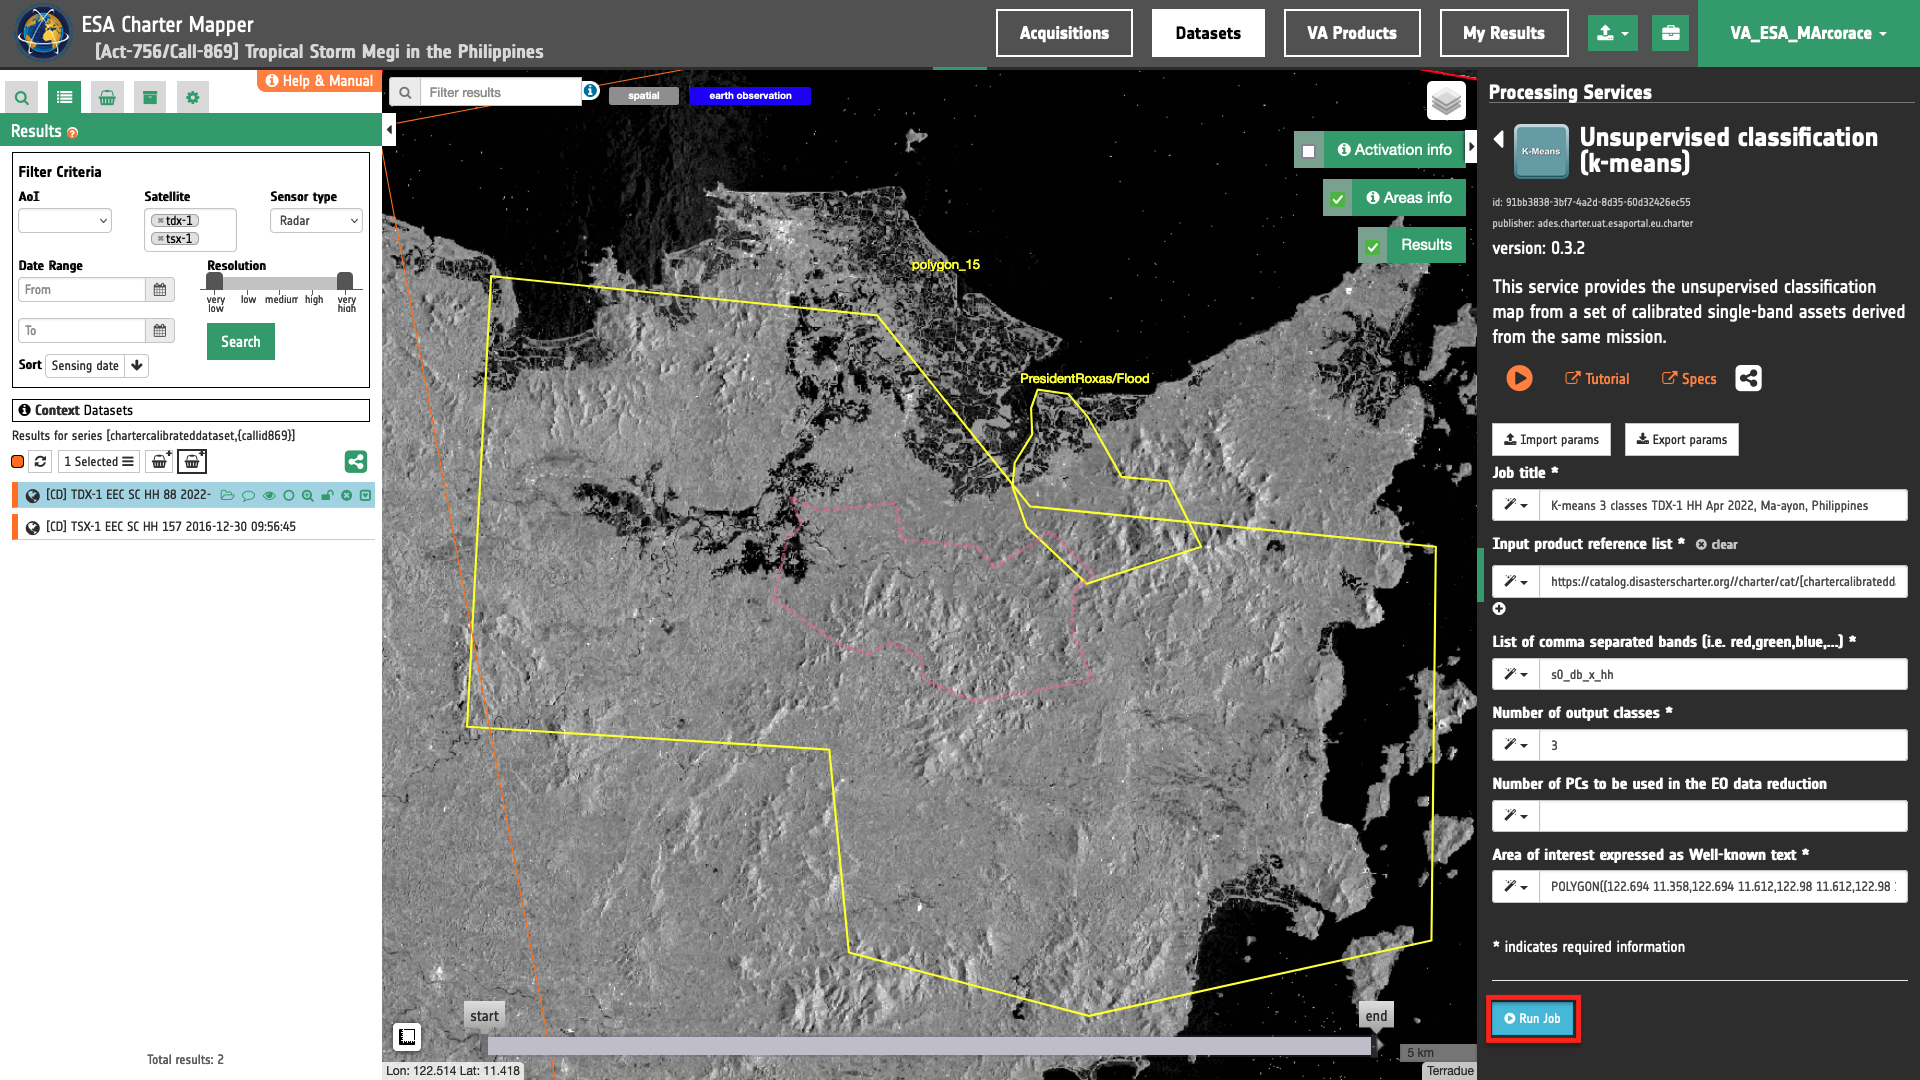
Run the job
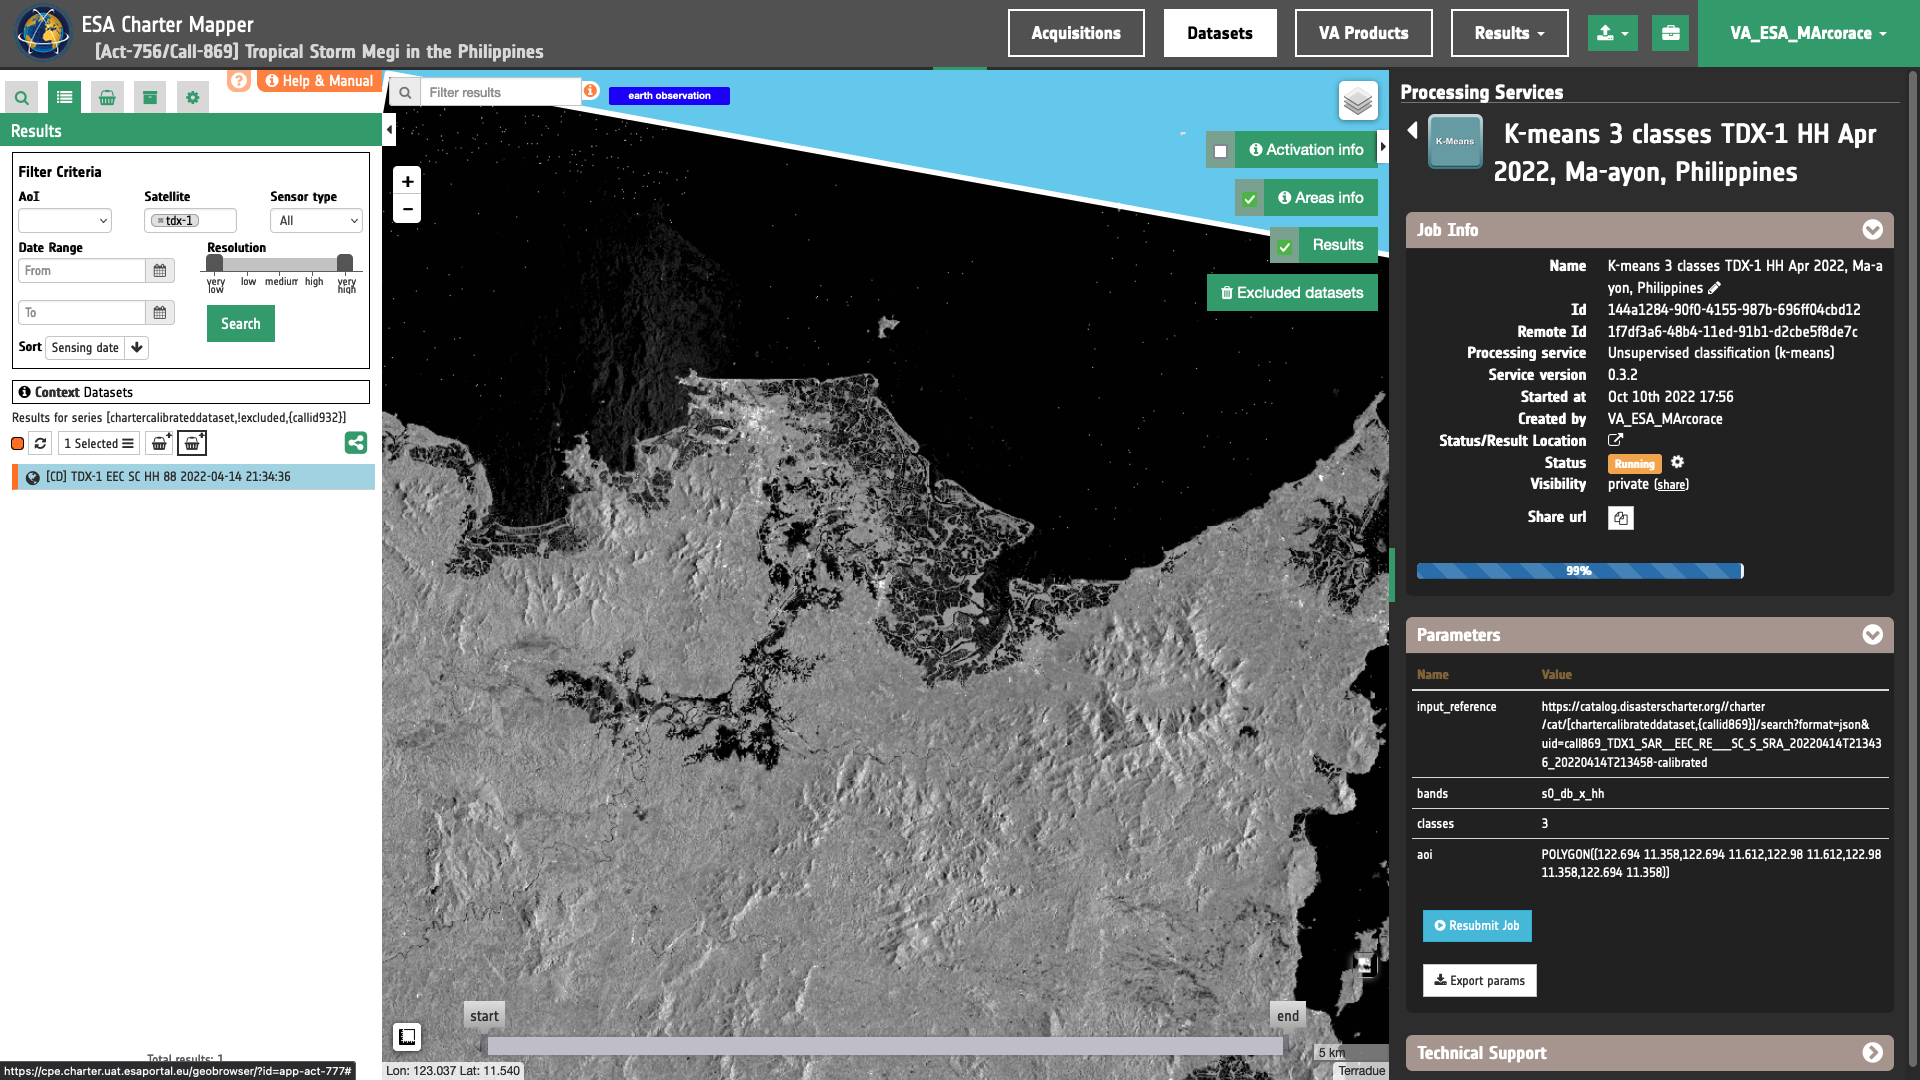
Click on the button Run Job and see the Running Job. You can monitor job progress through the progress bar.
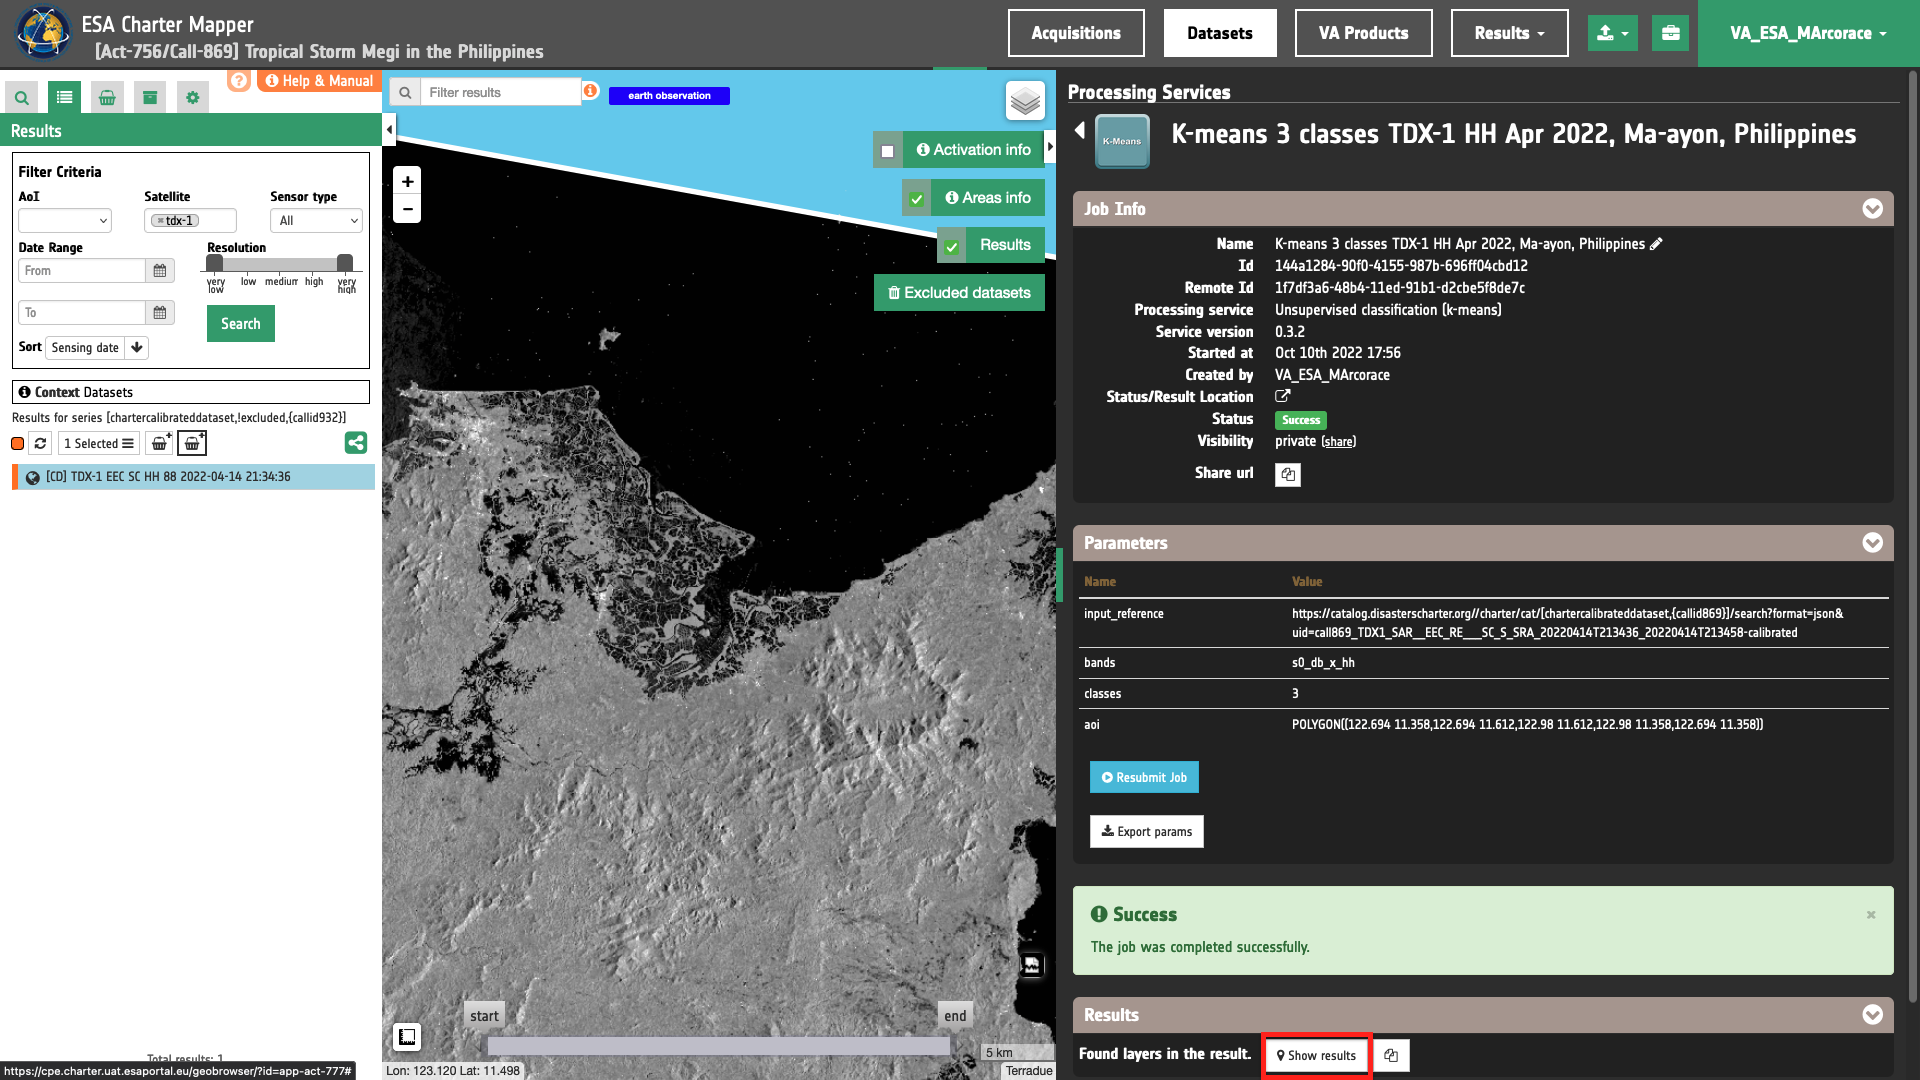
Results: download and visualization
Once the job is completed, click on the button Show results at the bottom of the processing service panel.
Tip
You can also save the parameters employed in this job by clicking on the Export params button in the right panel. This allows you to copy all your entries to the clipboard. This is meant to be used for a quick re-submission of a similar job after a fine tuning of the parameters (e.g. to add a color formula later).
Below is reported the syntax which includes all the parameters employed in this example.
{
   "input_reference": [
      "https://catalog.disasterscharter.org//charter/cat/[chartercalibrateddataset,{callid869}]/search?format=json&uid=call869_TDX1_SAR__EEC_RE___SC_S_SRA_20220414T213436_20220414T213458-calibrated"
   ],
   "bands": "s0_db_x_hh",
   "classes": "3",
   "aoi": "POLYGON((122.694 11.358,122.694 11.612,122.98 11.612,122.98 11.358,122.694 11.358))"
}
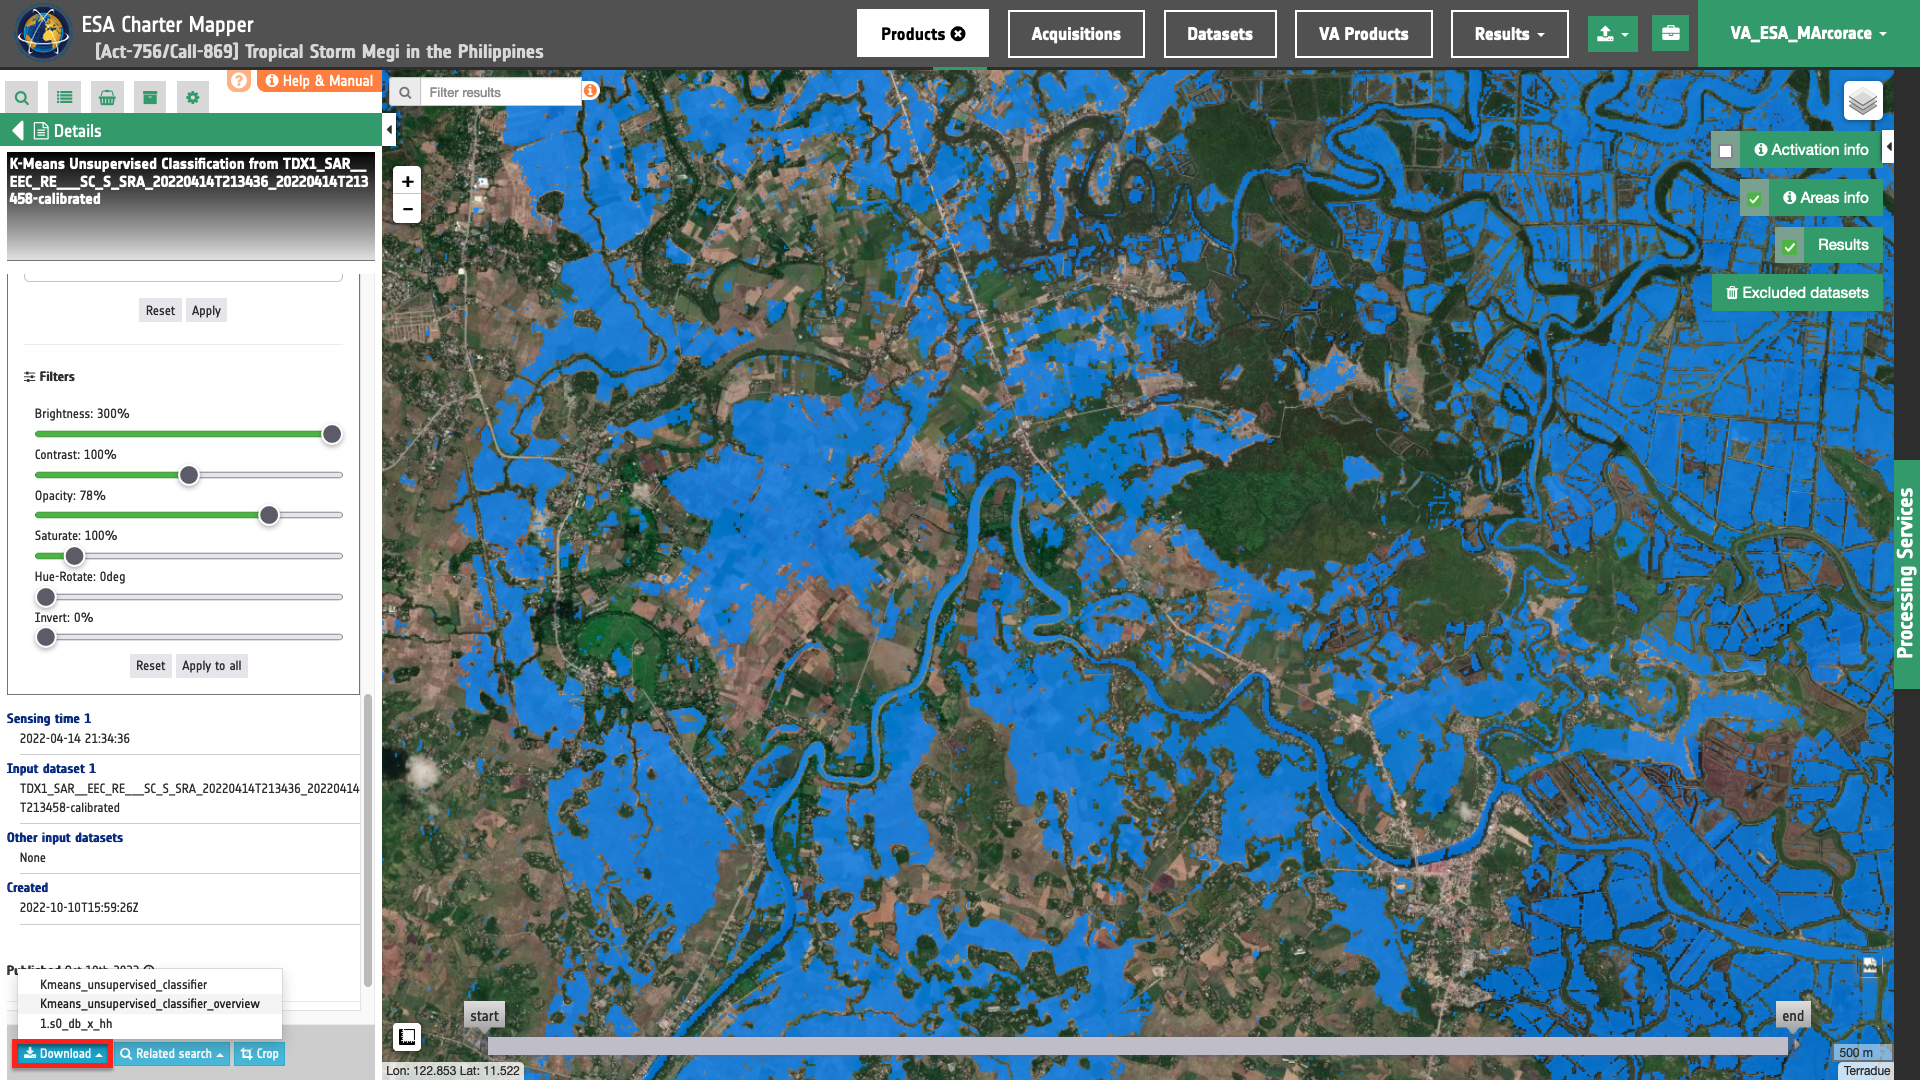
Visualization
See the result on the map. The preview appears within the area defined in the spatial filter.
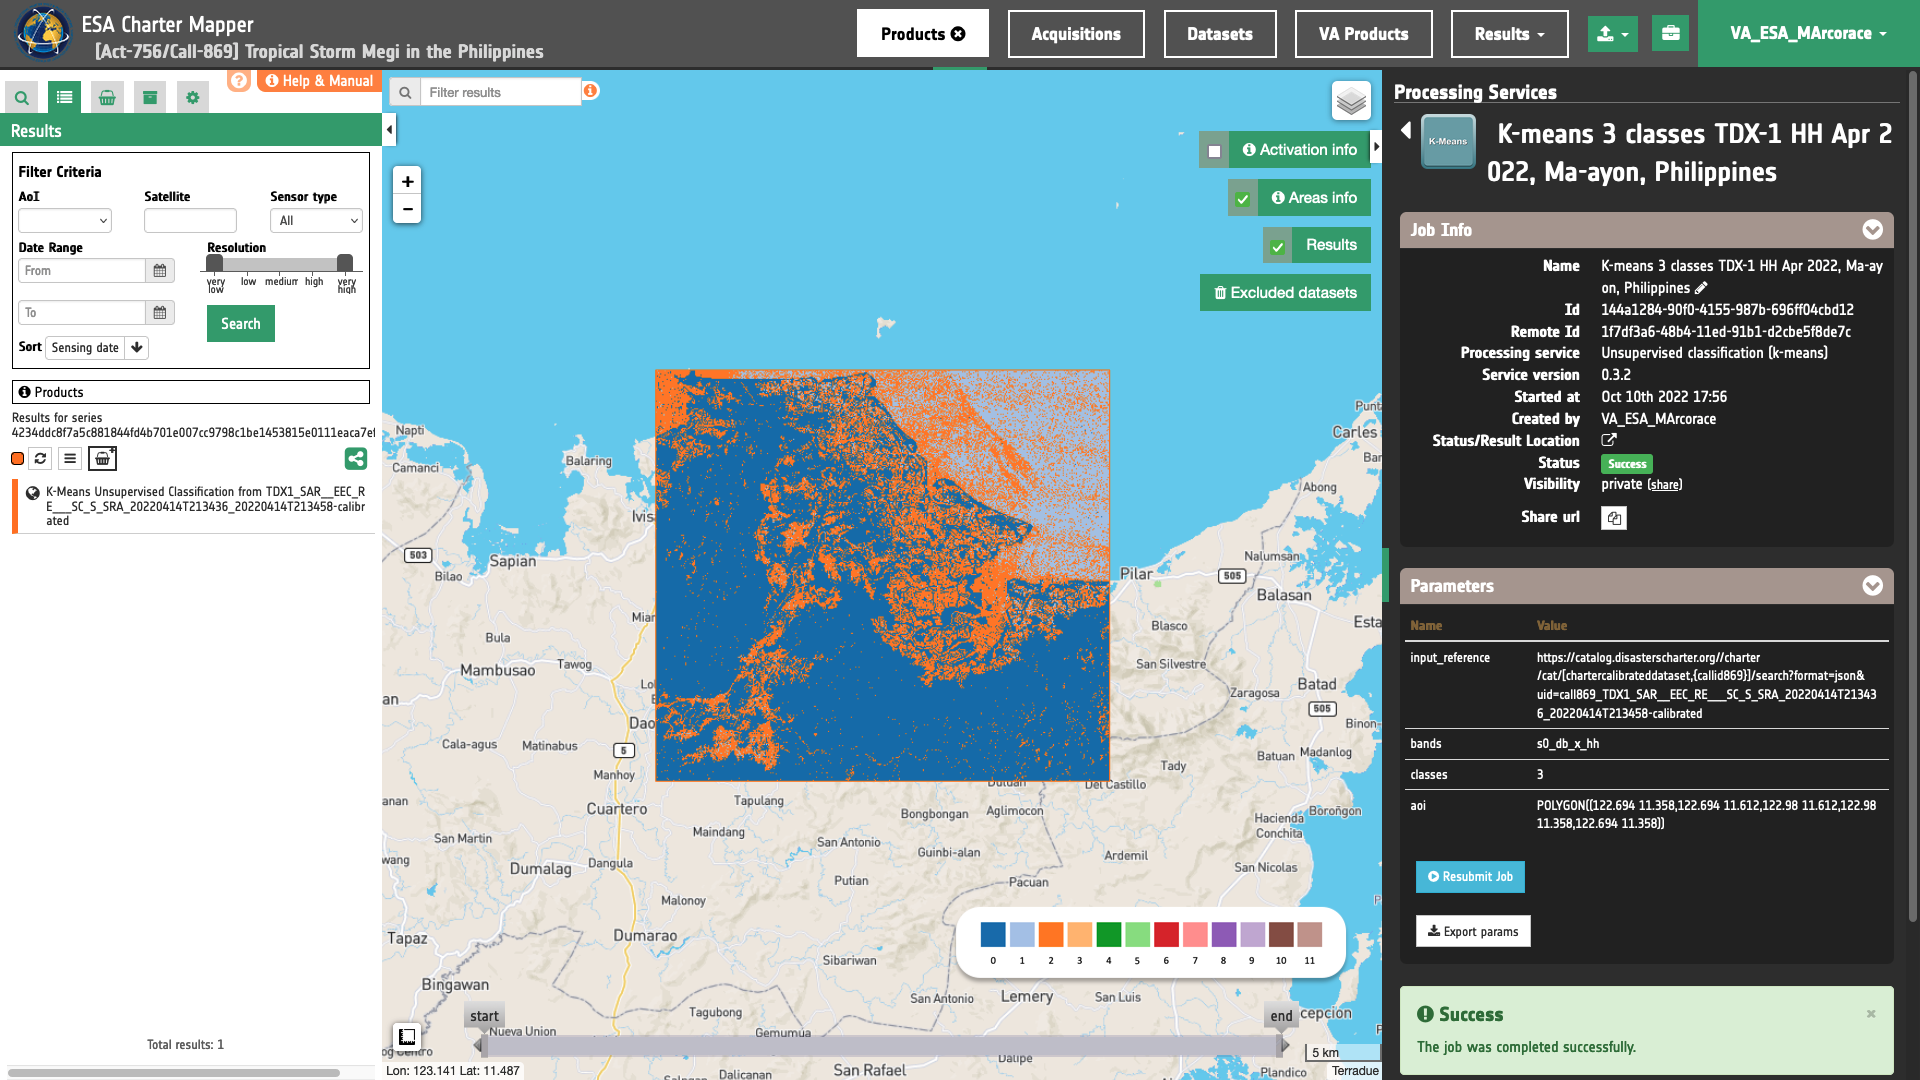
To get more information about the product just click on the preview in the map, a bubble showing the name of the layer K-Means Unsupervised Classification from TDX1_SAR__EEC_RE___SC_S_SRA_20220414T213436_20220414T213458-calibrated will appear and then click on the Show details button.
Tip
To quickly access Product Details double click on the layer from the Results list.
In the left panel of the interface, the details of Job Result will appear with Product metadata. Furthermore by clicking on Layer styling you can also access to the View options. Under Select Asset it is possible to select each asset and visualize it on the map.
Furthermore by clicking on Layer styling you can also access to the View options. In here it is possible to see histogram/s of the Product which is visible in the map, set color formula, change Filters (e.g. Brightness, Opacity) and insert an Expression to employ band arithmetic with assets and visualize changes on the fly in the map.
As an example it is possible to employ an Expression to aggregate classes and derive a binary map including only the wanted information from the K-Means classification.
Being the number of classes equal to 3 the classification map contains the following possible values [0,1,2]. Each value represents one class obtained from the unsupervised classification. In this particular use case, classes having values equal to 1 and 2 may potentially refer to satellite detected waters. With this assumption, under the Details panel it is possible to make an on-the fly binarization of the classification map by aggregating these two classes.
To make this binarization on the fly the following procedure can be followed:
-
Firstly, under Select Asset choose the
Kmeans_unsupervised_classifiersingle-band asset to be used for the binarization.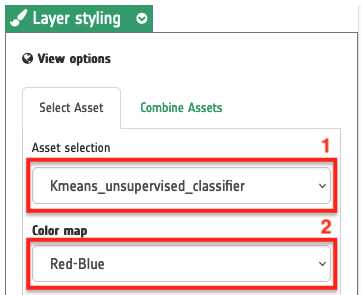
-
Choose a Color map as the
Red-Blueone. -
Being a binarization of an asset, set values
0and1for Min and Max respectively.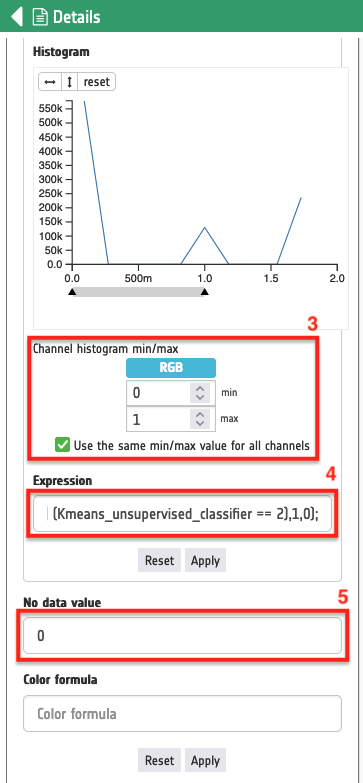
-
To derive a binary mask from source asset insert under Expression the following:
where((Kmeans_unsupervised_classifier == 1) | (Kmeans_unsupervised_classifier == 2),1,0);which transforms the K-Means Unsupervised classification map to a binary array with
truepixels for values of theKmeans_unsupervised_classifierasset equal to1or2.To visualize the change of the asset on the fly just click on the Apply button underneath.
-
To set
falsepixels of the binary transparent, it is possible to set as no data the value of the remaining class of theKmeans_unsupervised_classifierasset (the class 0 which may probably represent land in this use case classification). Thus under No data value set the value 0 and click on the second Apply button just below the Color Formula field.
Warning
Values under the No data value field are the value of the source asset (e.g. [0,1,2] for a K-Means classification map with 3 classes) and NOT the values of the asset altered by the Expression (e.g. [0,1] for a binary map derived from an asset with an expression).
The result of this on the fly binarization with transparency shall be seen on the map as shown in the below figure.
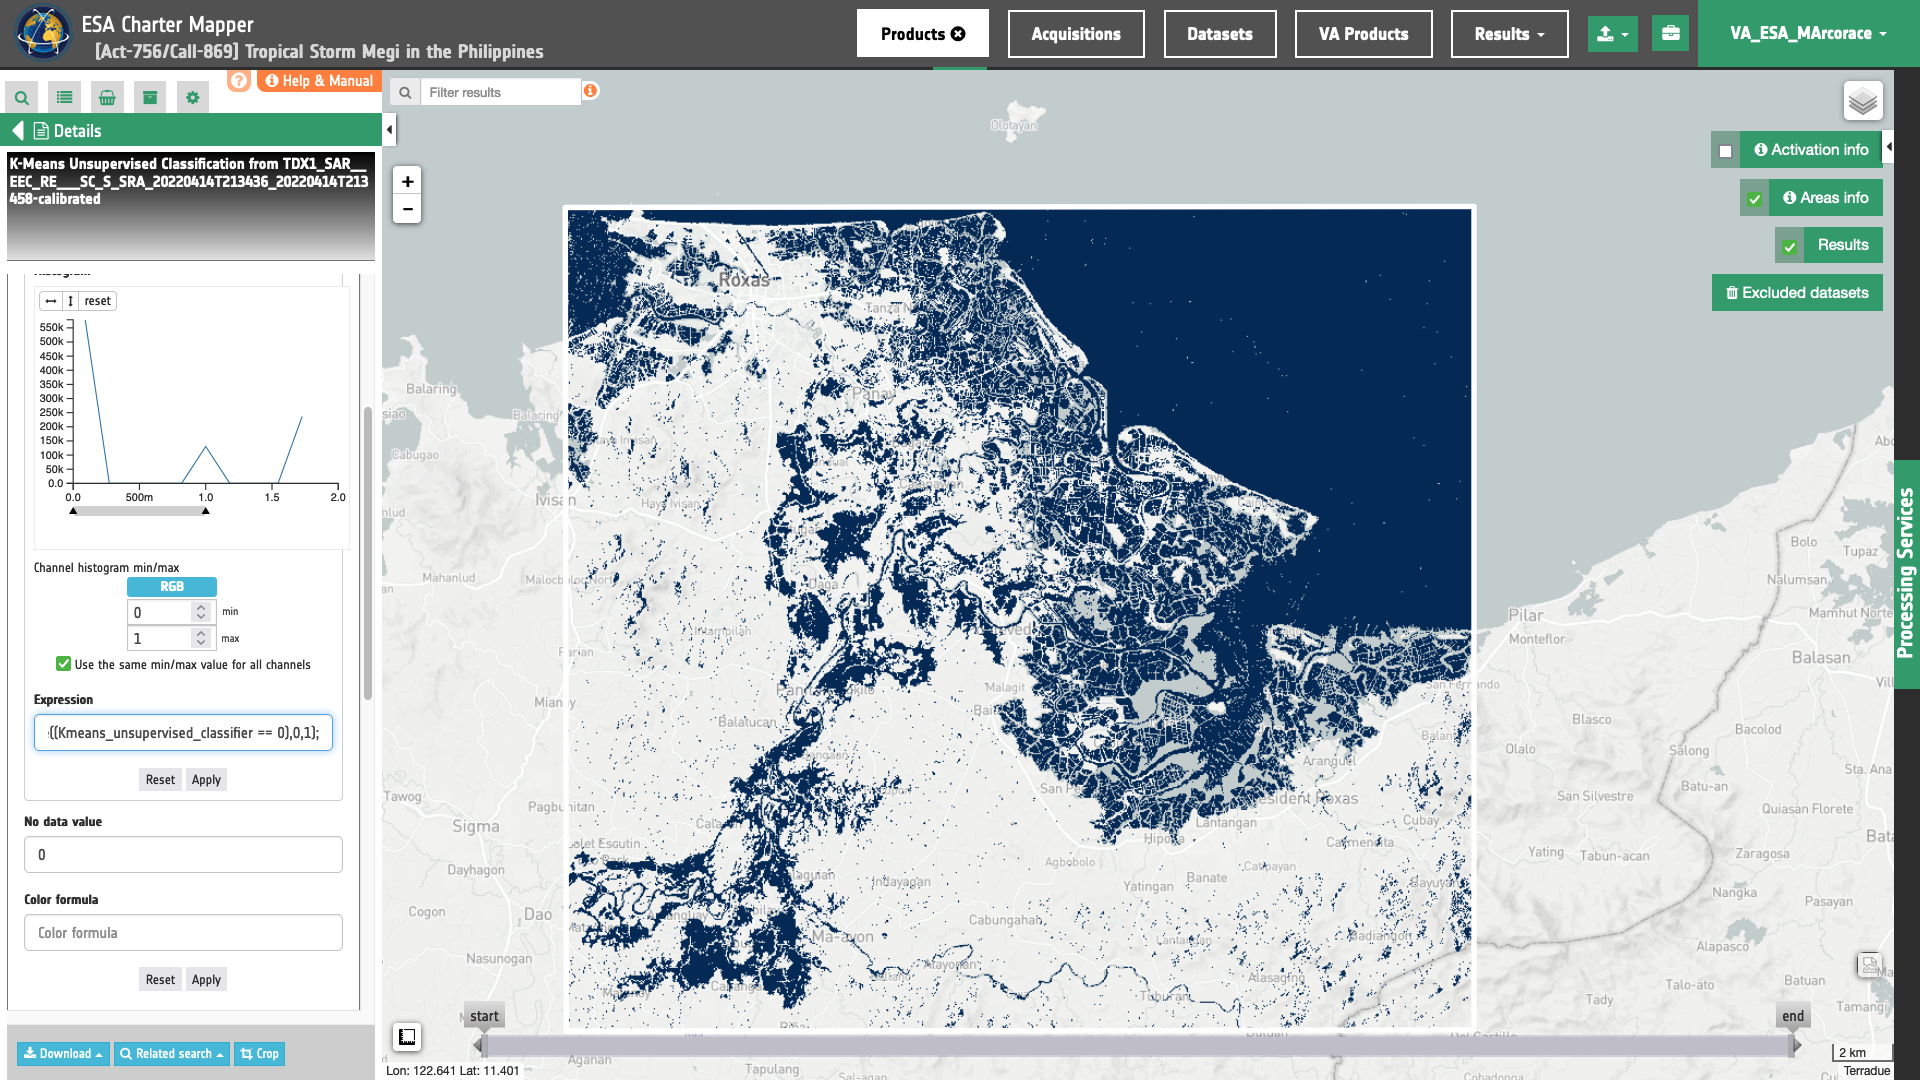
Tip
To visually compare the product overview with the underlying base layer (e.g. Natural Earth) you can set the Opacity filter under View options as 70%.
Note
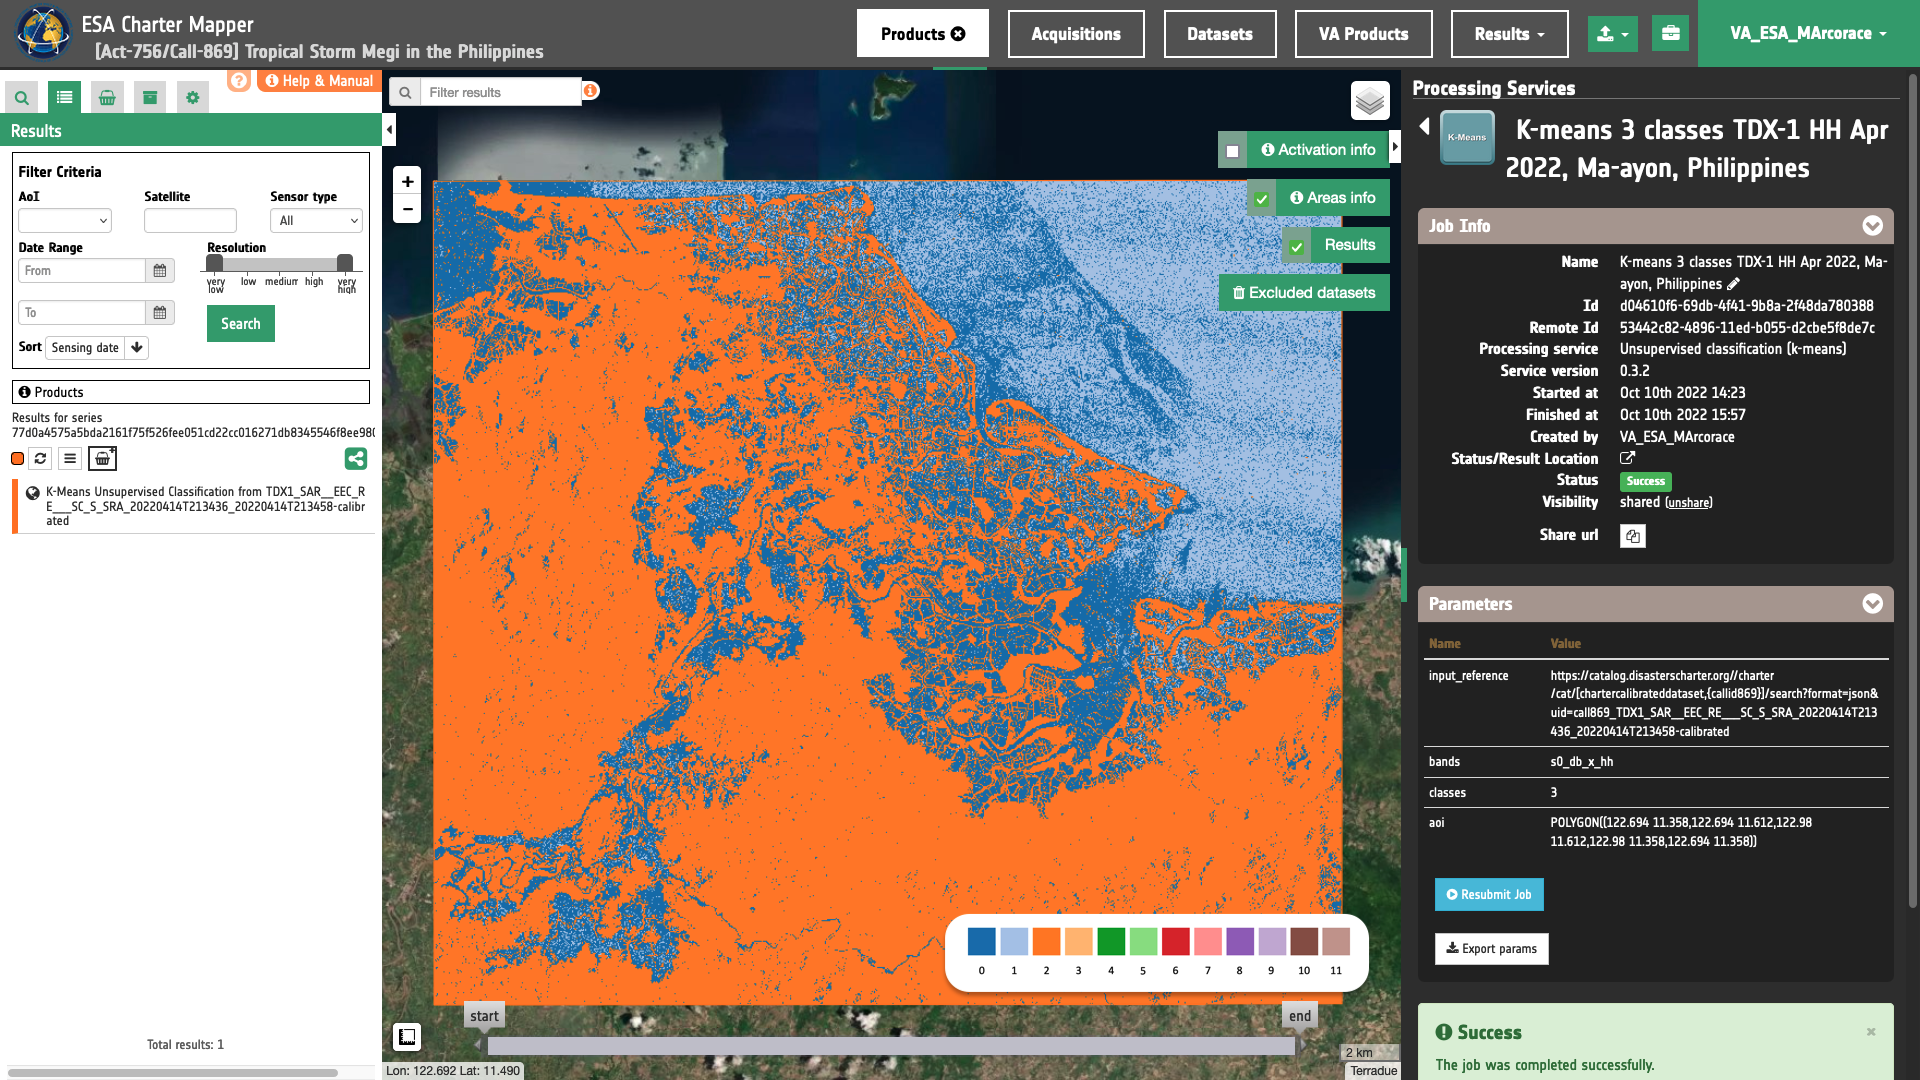
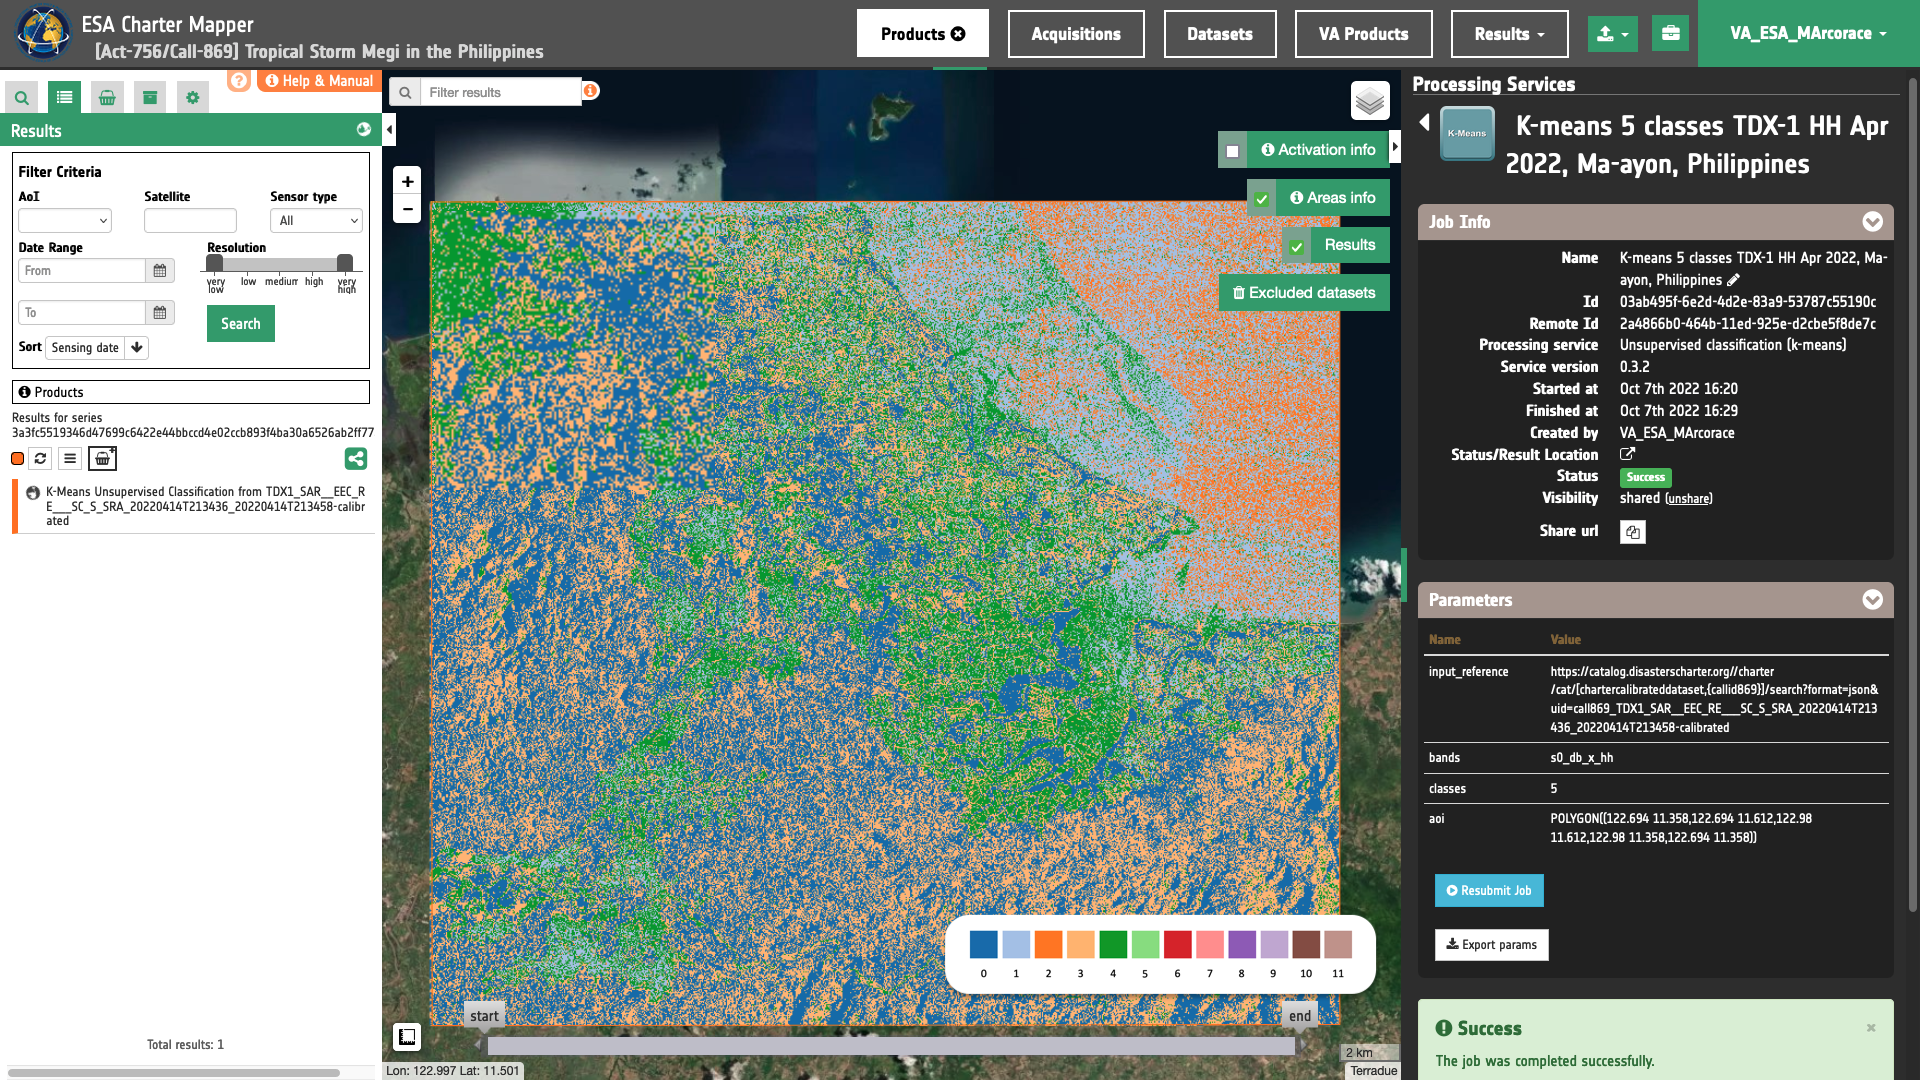
The number of classes is a crucial parameter in the K-Means classification. Below are two examples obtained with the same EO data by using 3 and 5 classes.
K-Means unsupervised classification into 3 classes from a s0_db_x_hh Sigma Nought asset
K-Means unsupervised classification into 5 classes from a s0_db_x_hh Sigma Nought asset
Download
In this use case the K-means Unsupervised Classifier (K-Means) service produces the following files:
- 1.s0_db_x_hh: single-band geophysical asset
s0_db_x_hhproduct from input radar calibrated dataset as single band GeoTIFF in COG format, - Kmeans_unsupervised_classifier: single-band geophysical asset
Kmeans_unsupervised_classifierproduct representing the classified map under 3 classes values=[0,1,2] as single band GeoTIFF in COG format, - Kmeans_unsupervised_classifier_overview: K-means classification overview product as 4 bands RGBA GeoTIFF in COG format.
These products can be downloaded by clicking on the Download button located at the bottom of the Product Details tab in the left panel.