Some useful s-expressions to be used in STACK
![]()
In the STACK service s-expressions are defined by the user using logical/arithmetic operators and functions described in the STACK service specification. Below are listed some use cases of s-expressions which can be replicated in multiple situations when it is necessary to derive a single band asset from a co-located stack (e.g. to derive a binary mask from thresholding).
Compute average backscatter
To compute average backscatter from multiple single band assets with STACK (e.g. from 3 single band C-band Sigma nought assets in VV polarization 1.s0_db_c_vv, 2.s0_db_c_vv and 3.s0_db_c_vv) the following s-expression can be used:
sigma_average:(/ (+ 1.s0_db_c_vv 2.s0_db_c_vv 3.s0_db_c_vv) 3)
Input single band assets are:
-
1.s0_db_c_vvsingle band asset representing C-band Sigma Nought in VV polarization from a 1st Radar Calibrated Dataset, -
2.s0_db_c_vvsingle band asset representing C-band Sigma Nought in VV polarization from a 2nd Radar Calibrated Dataset, -
3.s0_db_c_vvsingle band asset representing C-band Sigma Nought in VV polarization from a 3rd Radar Calibrated Dataset.
The output sigma_average is a single band asset representing the average Sigma Nought values derived from these input assets with the provided s-expression.
In this s-expression the / and + arithmetic operators are applied to compute the average.
Derive a normalized difference spectral index
To derive the Normalized Difference Snow Index (NDSI) from an Optical Calibrated Dataset with STACK the following s-expression can be used:
ndsi:(norm_diff 1.green 1.swir16)
Input single band assets are:
-
1.greensingle band asset representing green TOA reflectance from an Optical Calibrated Dataset, -
1.swir16single band asset representing swir16 TOA reflectance from the same Optical Calibrated Dataset.
The output ndsi is a single band asset representing NDSI values derived from these input assets with the provided s-expression.
In this s-expression the norm_diff operator is used to employ the normalized difference between green and swir16 assets included into the same Optical Calibrated Dataset.
Quick estimation of satellite-detected water from optical or SAR data
Below use cases describe possible ways to derive water masks from optical and SAR data.
Derive water mask from optical data
The following s-expression:
opt_water_mask:(where (>= (norm_diff 1.green 1.nir) 0.3) 1 0)
can be used to derive a water mask from the binarization of the NDWI spectral index.
Input single band assets are:
-
1.greensingle band asset representing green TOA reflectance from an Optical Calibrated Dataset, -
1.nirsingle band asset representing nir TOA reflectance from the same Optical Calibrated Dataset.
The output opt_water_mask is a single band binary mask derived from these input assets with the provided s-expression.
In this s-expression norm_diff operator is used to employ the normalized difference between green and nir assets included into the same Optical Calibrated Dataset. The where operator is then applied to derive a binary mask satisfying this condition: NDWI >= threshold. The value 0.3 represents the threshold as TOA reflectance.
Derive water mask from radar data
The following s-expression:
sar_water_mask:(where (<= 1.s0_db_c_hh -23) 1 0)
can be used to derive a water mask from the binarization of radar backscatter.
The input is the 1.s0_db_c_hh single band asset representing Sigma Nought in dB from systematic Radar Calibration of a C-band intensity image in HH polarization.
The output sar_water_mask is a single band binary mask derived from this input backscatter asset with the provided s-expression.
In this s-expression the where operator is then applied to derive a binary mask satisfying this condition: Sigma0 <= signed threshold in db. The value -23 represents the threshold for Sigma Nought in dB.
Extract flooded areas over a land cover class
STACK can be used also to post-process an asset from a Result of another processor. For instance, this makes it possible to co-locate a binary flood map from the Result of the HASARD on-demand service with the Land Cover Auxiliary Dataset to extract flooded pixels over only a certain LC class. As an example the following s-expression:
flooded_cropland:(where (== 2.worldcover 40) 1.flood-mask 0)
can be used to derive a flood mask over only crop fields.
Input single band assets are:
-
1.flood-masksingle band asset representing the flood mask from a result with the HASARD service, -
2.worldcoversingle band asset representing land cover classes from the ESA World Cover 2020 Auxiliary Dataset.
The output flooded_cropland is a single band binary mask derived from these 2 input single band assets with the provided s-expression.
In this case the s-expression (where (== 2.worldcover 40) 1.flood-mask 0) is used to generate the flooded_cropland asset from the flood-mask one using the condition (== 2.worldcover 40). The value 40 represents the pixel value of the LC class cropland for the single-band asset worldcover offered in the ESA World Cover Auxiliary Dataset.
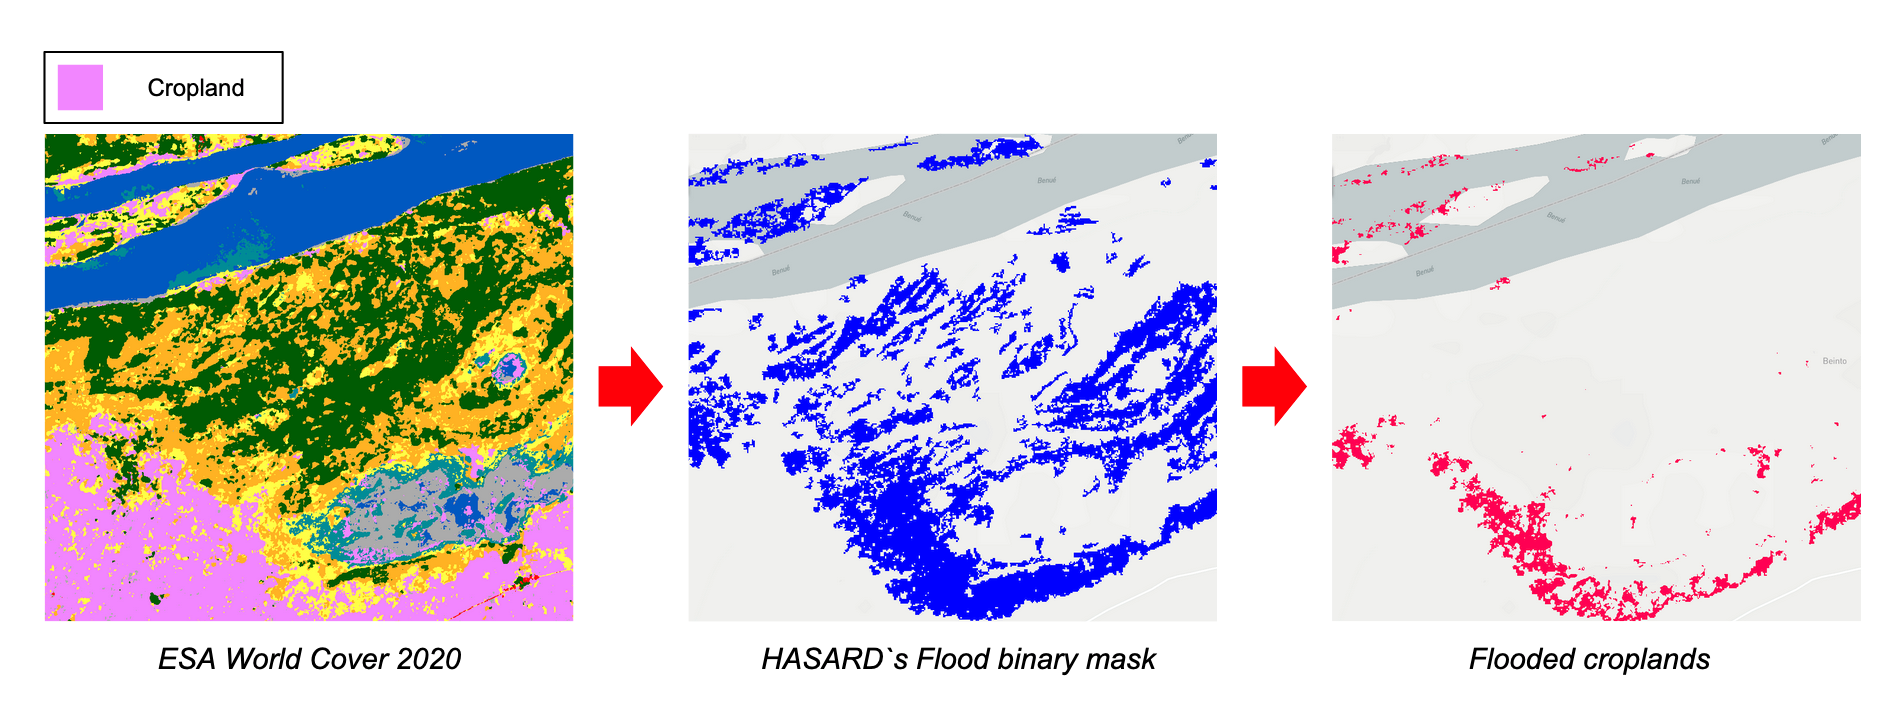
Figure 1 - Extraction of flooded cropland using the STACK service from a co-location of an HASARD`s binary flood map and the ESA world Cover.
Hint
Specifications of the worldcover single band asset can be found here.
Map floodplains from the HAND auxiliary dataset
STACK can be used also to process a single band asset from an Auxiliary Dataset. As an example the following s-expression:
floodplains:(where (<= 1.hand 20) 1 0)
can be used to derive a binary mask representing potential floodplains derived from the DEM.
Input single band asset is 1.hand representing the Height Above the Nearest Drainage (HAND) from the MERIT-Hydro dataset of University of Tokyo.
The output floodplains is a single band binary mask derived from 1.hand with the provided s-expression.
In this case the s-expression (where (<= 1.hand 20) 1 0) is used to generate the floodplains asset from the hand-mask one using the condition (<= 1.hand 20) 1 0). The value 20 represents a threshold, as maximum relative height in meters from the closest stream, for the single-band asset hand offered in the MERIT-Hydro Auxiliary Dataset.
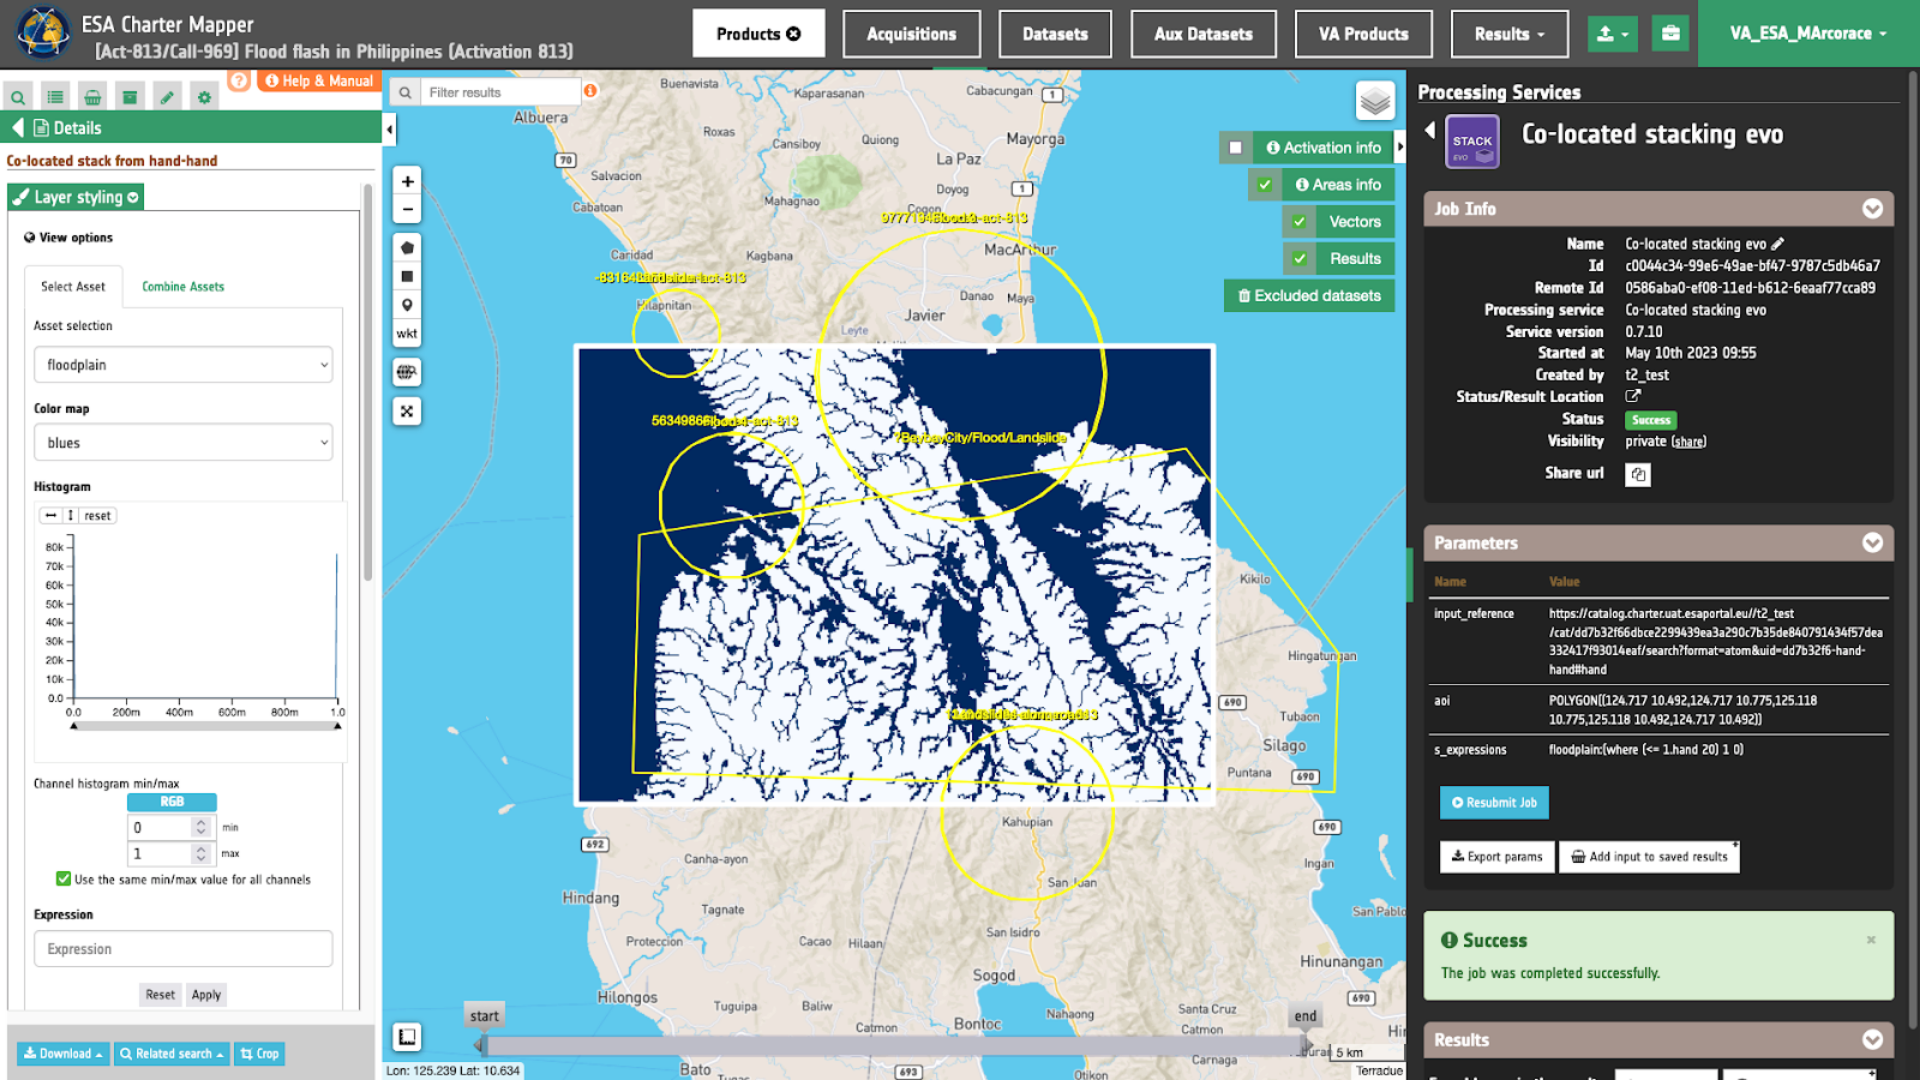
Figure 2 - Mapping of potential floodplains using the STACK service and the HAND Auxiliary Dataset of the University of Tokyo.
Note
The binary mask derived from HAND can be used to post-process flood maps derived from on-demand processing (e.g. HASARD).
Hint
Specifications of the hand single band asset can be found here.
Derived Burned Area Visualization binary mask
Using s-expressions in STACK it is possible to estimate burnt areas by employing the Burned Area Visualization algorithm with the blue, nir, swir16, swir22, ndvi, ndwi single band assets derived from an Optical Calibrated Dataset acquired after a fire event.
As an example the following s-expression:
bav:(where (& (< (+ (/ (- 1.swir16 1.swir22) (+ 1.swir16 1.swir22) ) 1.nir) 1000) (> 1.swir16 1000) (< 1.blue 1000) (< 1.ndvi 0.3) (< 1.ndwi 0.1)) 1 0)
can be used to derive a binary mask single band asset with values of 1 indicating burned areas.
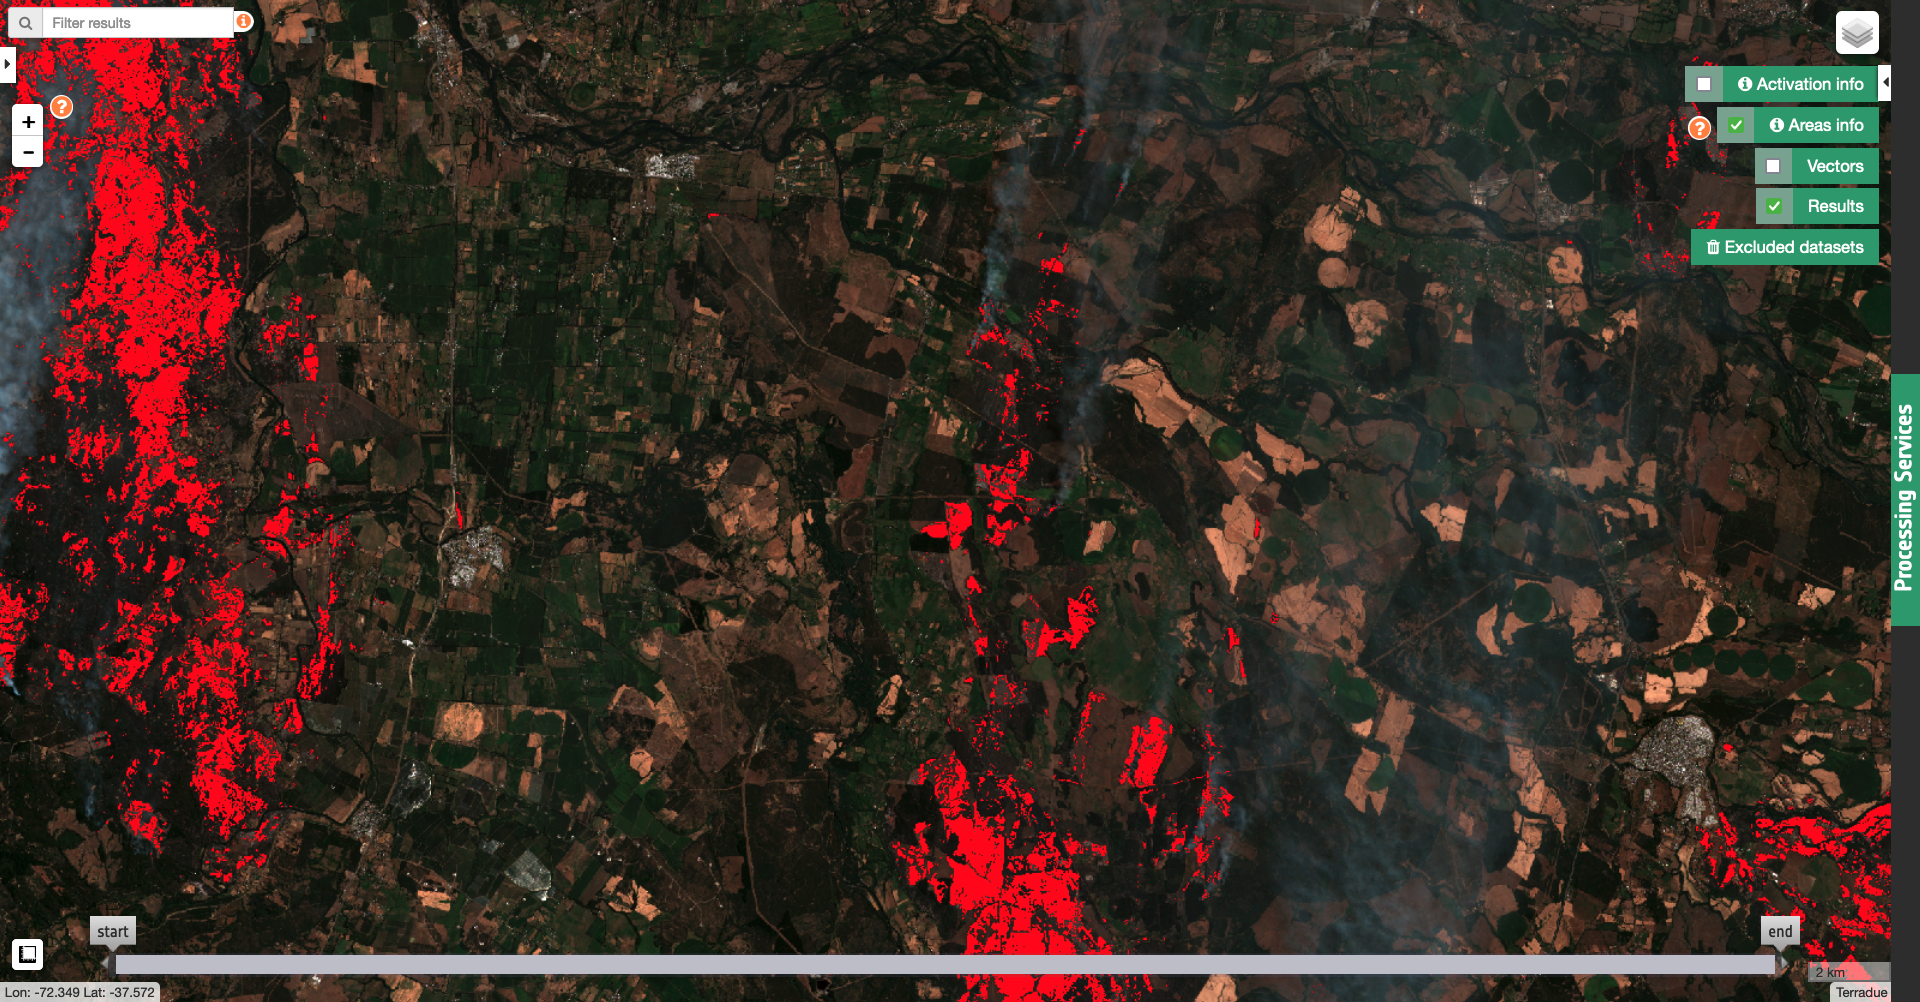
Figure 2 - Burned Area Visualization from Copernicus Sentinel-2 data acquired after a large wildfire event occurred in Jan-Feb 2023 near Los Angeles, Chile.
Input single band assets are:
-
1.bluesingle band asset representing reflectance rescaled to 10000 for CBN=blue, -
2.swir16single band asset representing reflectance rescaled to 10000 for CBN=swir16, -
2.swir22single band asset representing reflectance rescaled to 10000 for CBN=swir22, -
1.ndvisingle band asset representing NDVI. -
1.ndwisingle band asset representing NDWI (Mc Feeters, 1996).
The output bav is a single band binary mask derived from these input single band assets with the provided s-expression.
In this case the s-expression (where (& (< (+ (/ (- 1.swir16 1.swir22) (+ 1.swir16 1.swir22) ) 1.nir) 1000) (> 1.swir16 1000) (< 1.blue 1000) (< 1.ndvi 0.3) (< 1.ndwi 0.1)) 1 0) is used to generate the bav asset with a binarization of a customized index and swir16, blue, nir, ndvi, ndwi assets. The value 1000 represents the threshold applied to the customized index, the swir16, the blue, and the nir assets. The value 0.3 represents the threshold applied to the NDVI. The value 0.1 represents the threshold applied to the NDWI.
Note
Notes from the authors of the script (Monja Šebela): "The script does well at detecting burned areas and covers burned land well in most cases. The script is not perfect, as it sometimes fails to completely cover the burned area or overestimates them. It is however useful for detecting burned areas nonetheless, as it consistently detects large scale recently burned areas".
Compute NDVI loss after a landslide
S-expressions can be used also to combine assets from 2 Results obtained with the same on-demand processor supported by STACK. As an example, STACK allows to co-locate NDVI indexes from the Results of the OPT-Index on-demand service obtained with two different Calibrated Dataset acquired before and after a landslide. As an example the following s-expression:
ndvi_loss:(where (<= (- 2.ndvi 1.ndvi) -0.55) 1 0)
can be used to derive a binary mask which is mapping NDVI loss due to a landslide over vegetated areas.
Input single band assets are:
-
1.ndvisingle band asset representing NDVI before the landslide from a 1st OPT-Index result, -
2.ndvisingle band asset representing NDVI after the landslide from a 2nd OPT-Index result.
The output ndvi_loss is a single band binary mask derived from these 2 input single band assets with the provided s-expression.
In this case the s-expression (where (<= (- 2.ndvi 1.ndvi) -0.55) 1 0) is used to generate the ndvi_loss asset with a binarization of negative NDVI difference values (NDVI-post - NDVI-pre <= -0.55). The value -0.55 represents the threshold applied to the NDVI difference.
Compute coherence loss after an earthquake
Another useful use case with STACK is the one exploiting a pair of coherence single band assets from 2 SAR-COIN results, obtained from 3 SLC Datasets acquired before and after an earthquake. As an example the following s-expression:
ccd:(where (<= (- 2.coh_c_vv_20230129_20230210 1.coh_c_vv_20230117_20230129) -0.4) 3.wsf2019 0)
can be used to derive a binary mask which is mapping coherence loss due to an earthquake over built-up areas.
Input single band assets are:
-
1.coh_c_vv_20230117_20230129single band asset representing coherence before the earthquake from a 1st SAR-COIN result, -
2.coh_c_vv_20230129_20230210single band asset representing coherence after the earthquake from a 2nd SAR-COIN result, -
3.wsf2019single band asset representing a binary mask of built up areas from the DLR`s World Settlement Footprint 2019 Auxiliary Dataset.
The output ccd is a single band binary mask derived from these input single band assets with the provided s-expression.
In this case the s-expression (where (<= (- 2.coh_c_vv_20230129_20230210 1.coh_c_vv_20230117_20230129) -0.4) 3.wsf2019 0) is used to generate the ccd asset with a binarization of negative coherence difference values (coherence-post - coherence-pre <= -0.4). The value -0.4 represents the threshold applied to the coherence difference.
Hint
Specifications of the wsf2019 single band asset can be found here.