GIS functions
The geobrowser supports visualization on the map of data in vector format. The visualization of vector features is handled in the geobrowser using the GeoJSON (.json)1 format.
Note
A vector feature can be scaled to any size without losing quality and thus always printed out in the map clearly.
It also provides online digitization functions to create multiple types of vector (point, polyline, polygon or multipolygon features). Polygon vectors can be used in the platform for visualization, filtering EO data, and as input in on-demand processing.
Create vector
In the left panel under the GIS Functions tab the geobrowser provides widgets to create and digitize vectors in the map. With this function the user is able to create point, polyline, polygon or multipolygon features online within the workspace, by drawing the shapes on the map.
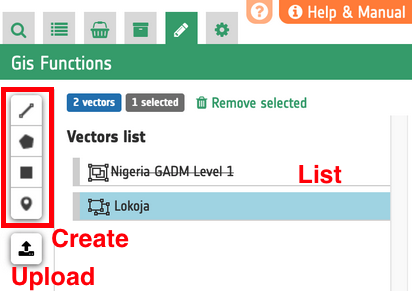
Figure 1 - GIS Functions panel.
Upload vector
Concerning the import of external vector files in the ESA Charter Mapper, the geobrowser supports uploading of several spatial data formats, such as GeoJSON, Shapefile, KML and KMZ.
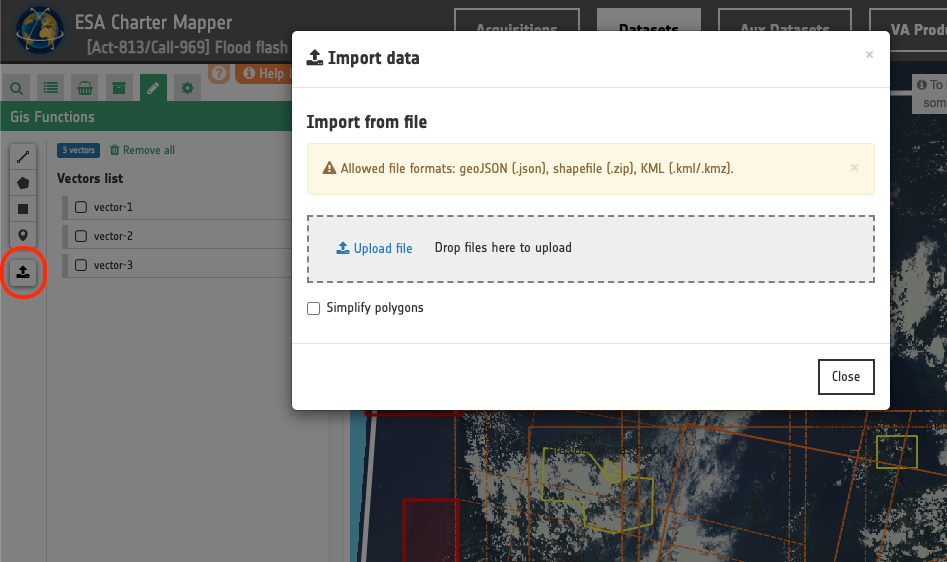
Figure 2 - Upload dialog.
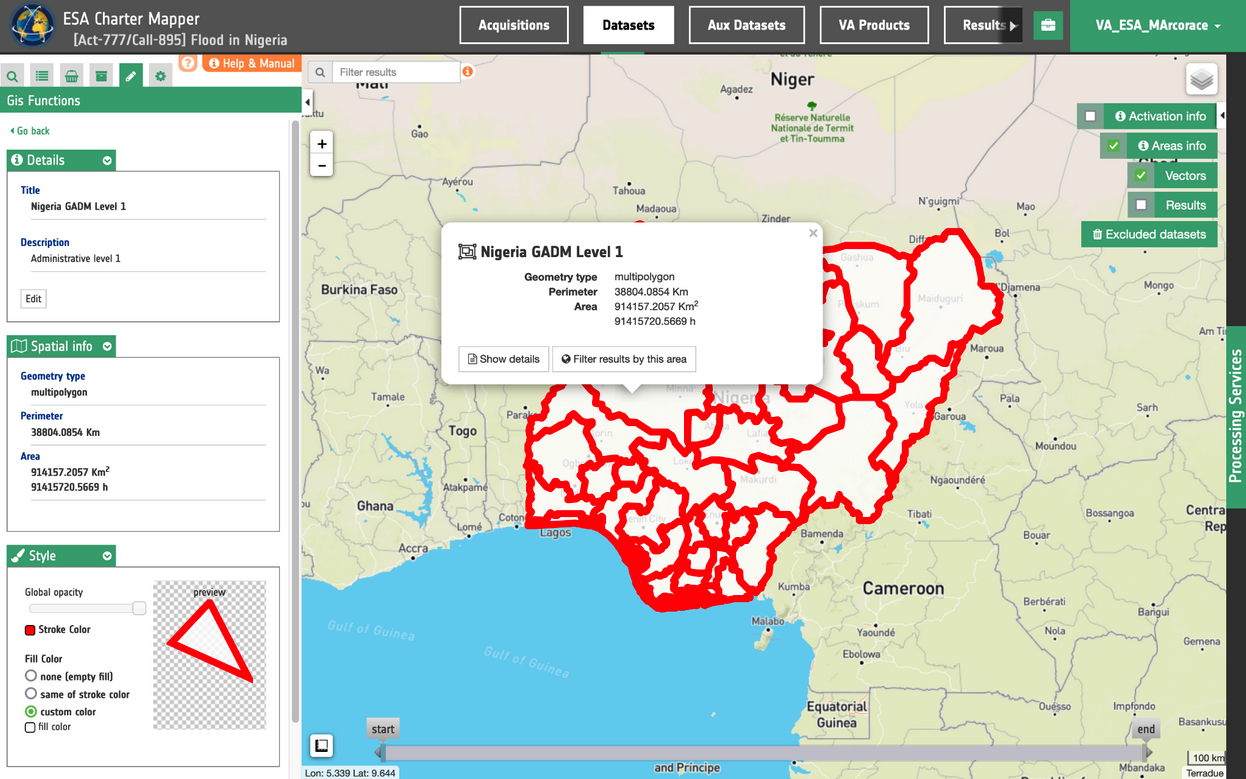
Figure 3 - Visualizazion of an uploaded GADM Admin 1 level shapefile into the workspace.
Edit vector
Once a vector feature is created or imported, the geobrowser also enable the user to:
-
edit the vector title/description;
-
add, remove or edit labels;
-
add, remove or edit attributes;
-
edit the vector shape;
-
change the vector style.
The editing features are accessible by the vector details panel, by double clicking the vector in the vector's list.
Title and description editing
Users can edit the vector's title and description. The titles are shown on the vector's list and on the map (by hovering the shapes on the map).
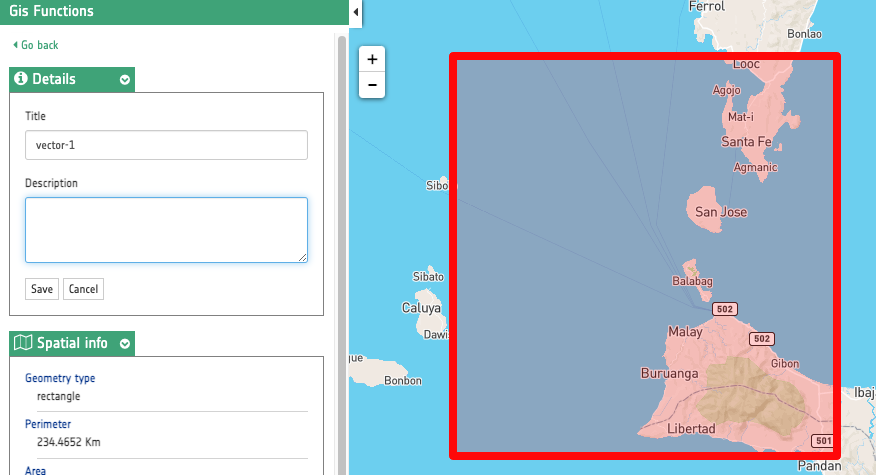
Figure 4 - Online editing of vector's title and description.
Metadata editing
From the vector details panel it is also possible to edit vector's metadata, such as labels (list of keys) and attributes (list of key-value pairs).
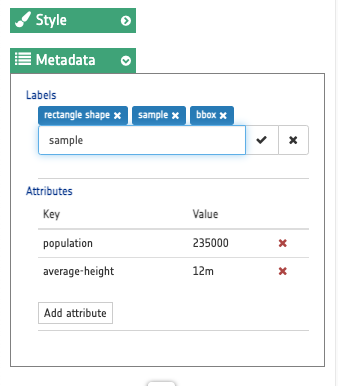
Figure 5 - Online editing of vector's metadata.
Group multiple line or polygon features
After the selection of vector features of the same type in the left panel it is possible to group selected features into multipolygon or multipolylines.
As an example after the import of a vector including multiple line features, select them all by clicking on the select all button.
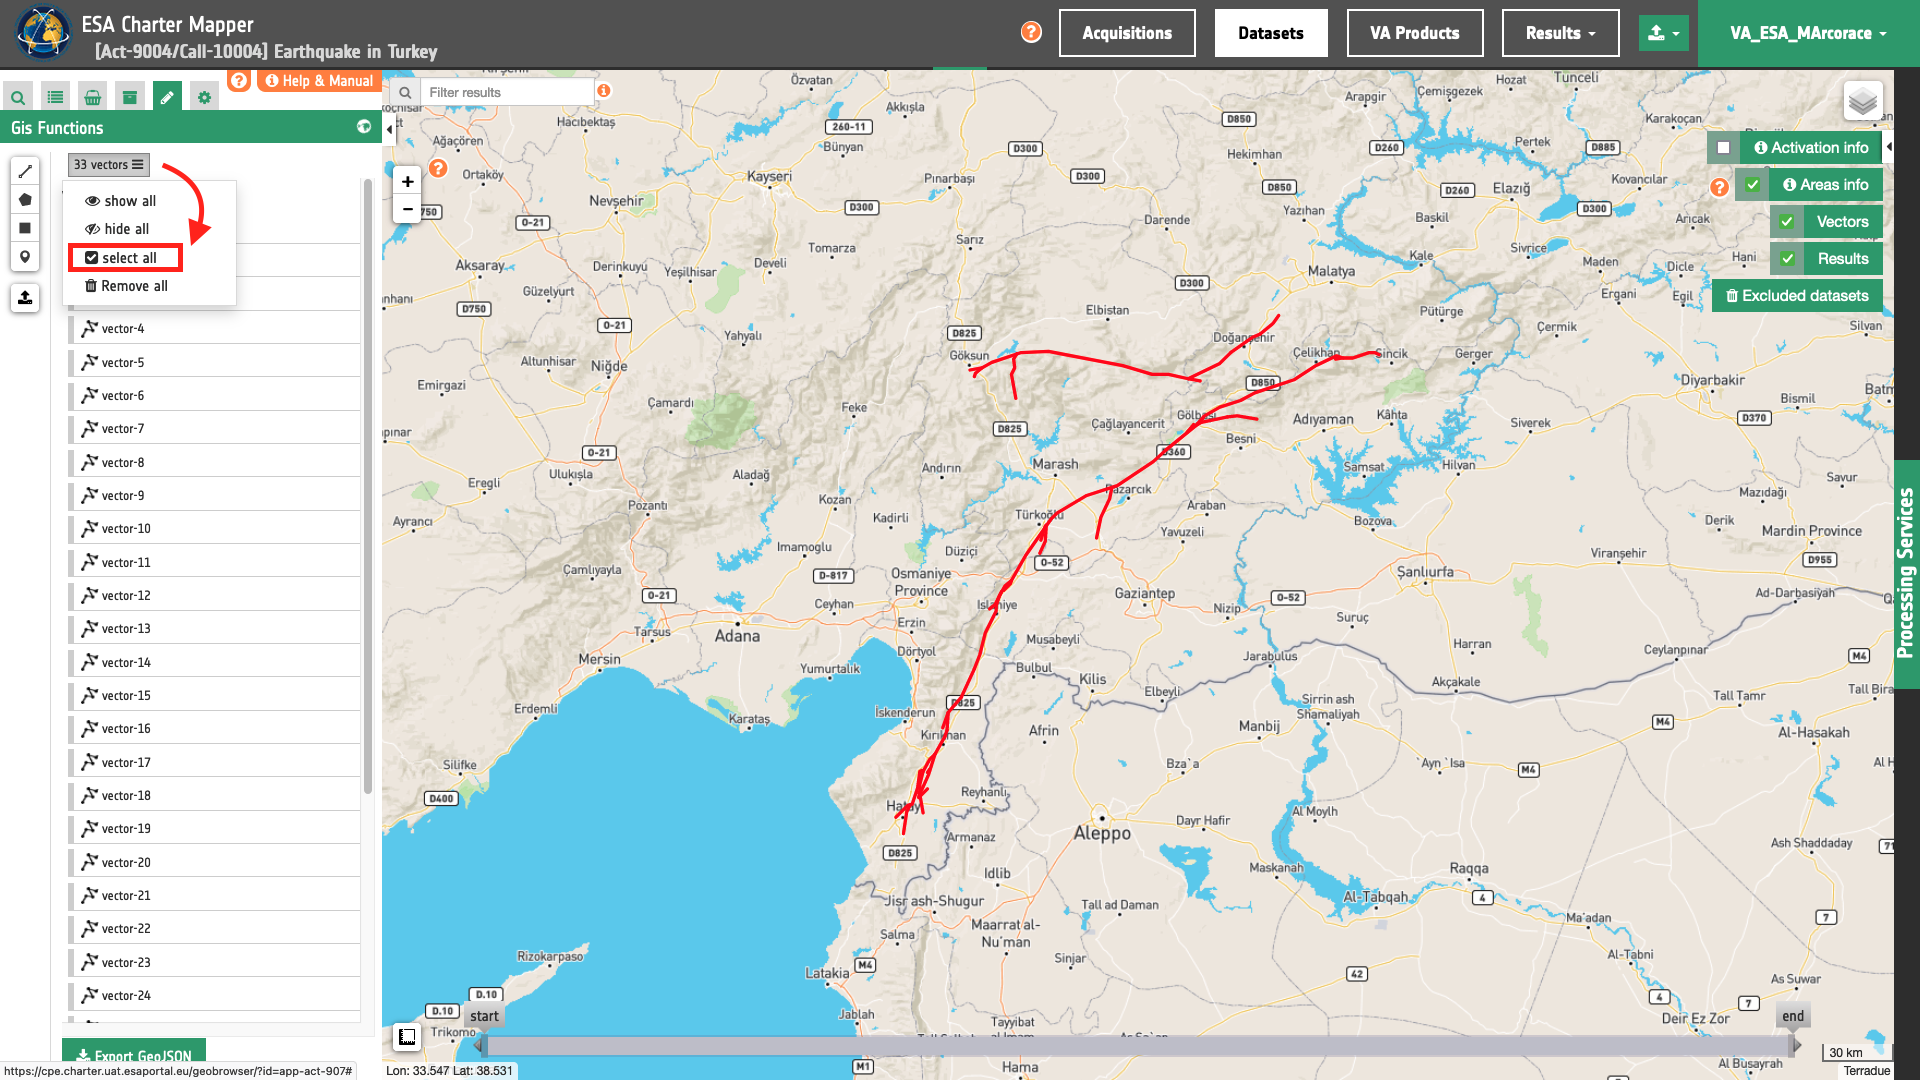
Figure 6 - A button to select all features in GIS functions.
Once all features are selected click on the Group button.
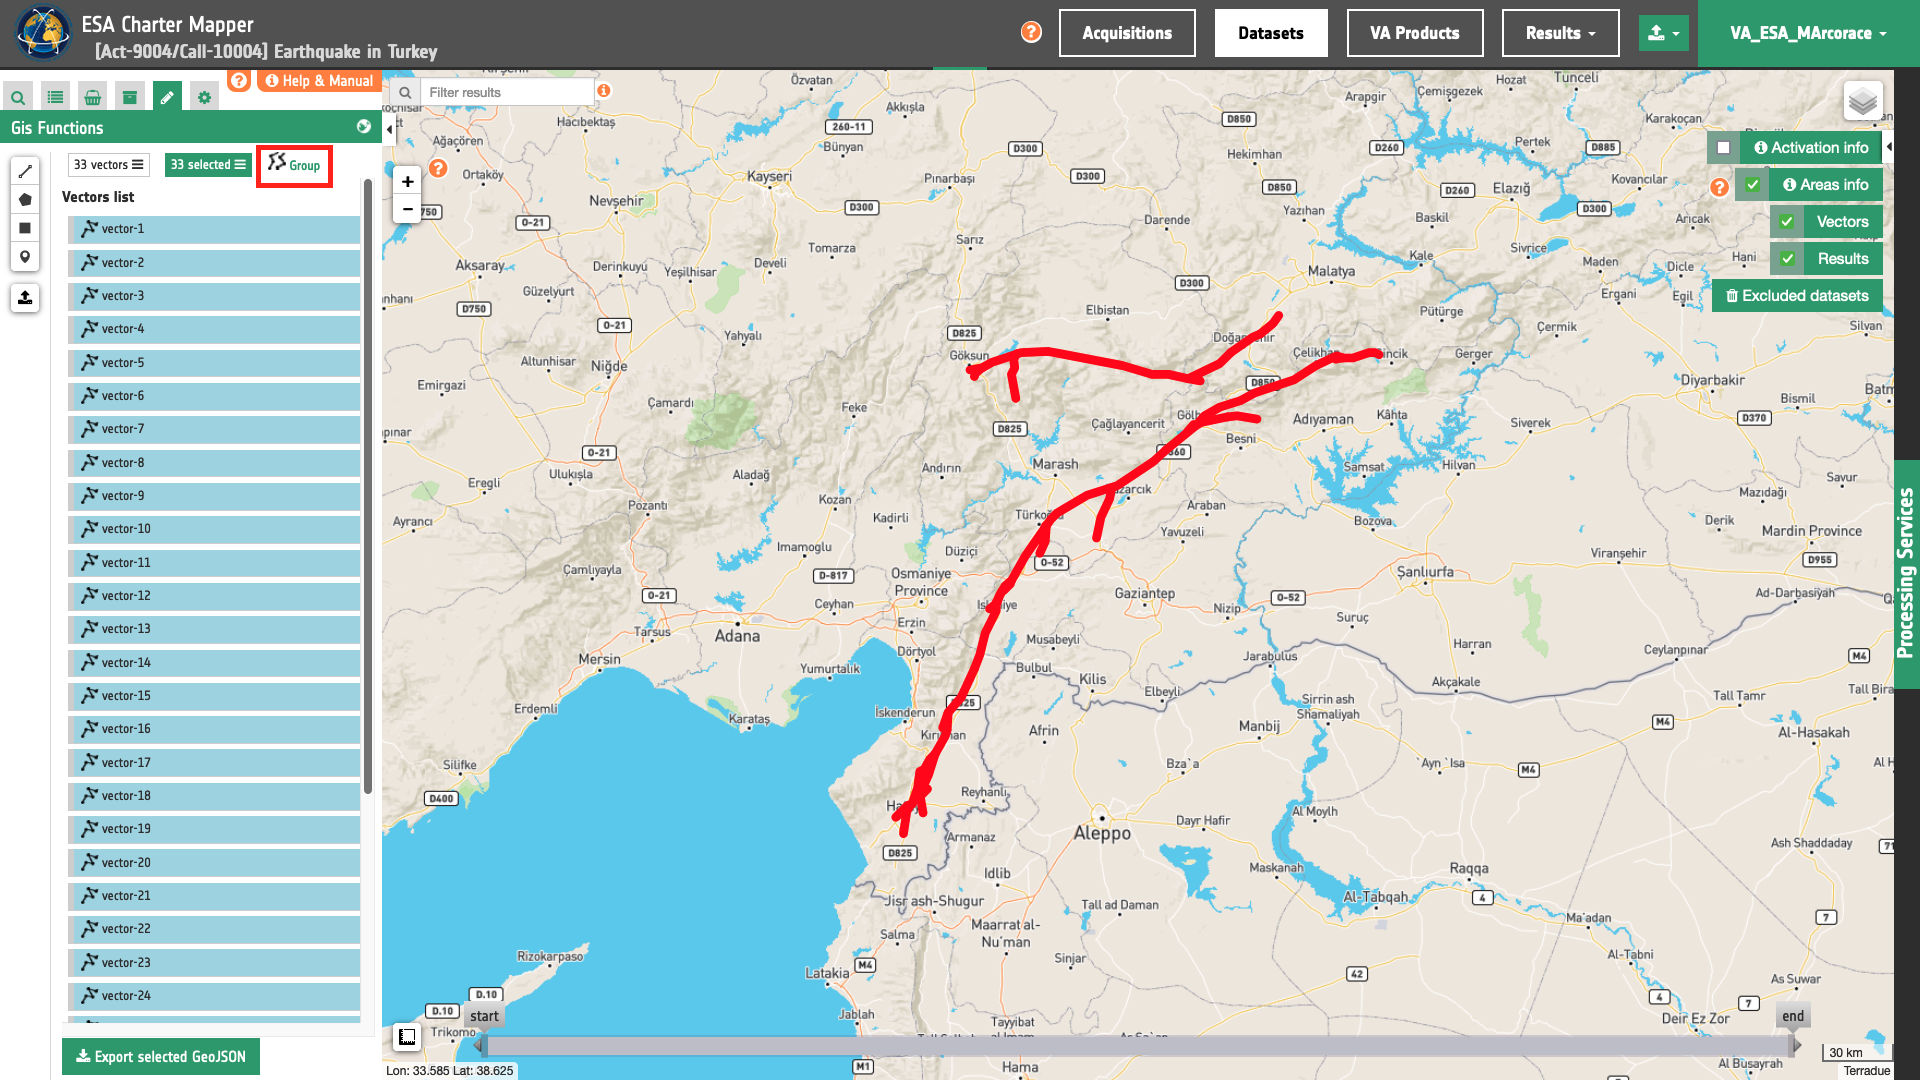
Figure 7 - A button to group selected features in GIS functions.
All features are now grouped into a single multipolyline feature.

Figure 8 - Result from the grouping of multiple features in GIS functions.
The metadata of this multipolyline feature can be then edited as needed.
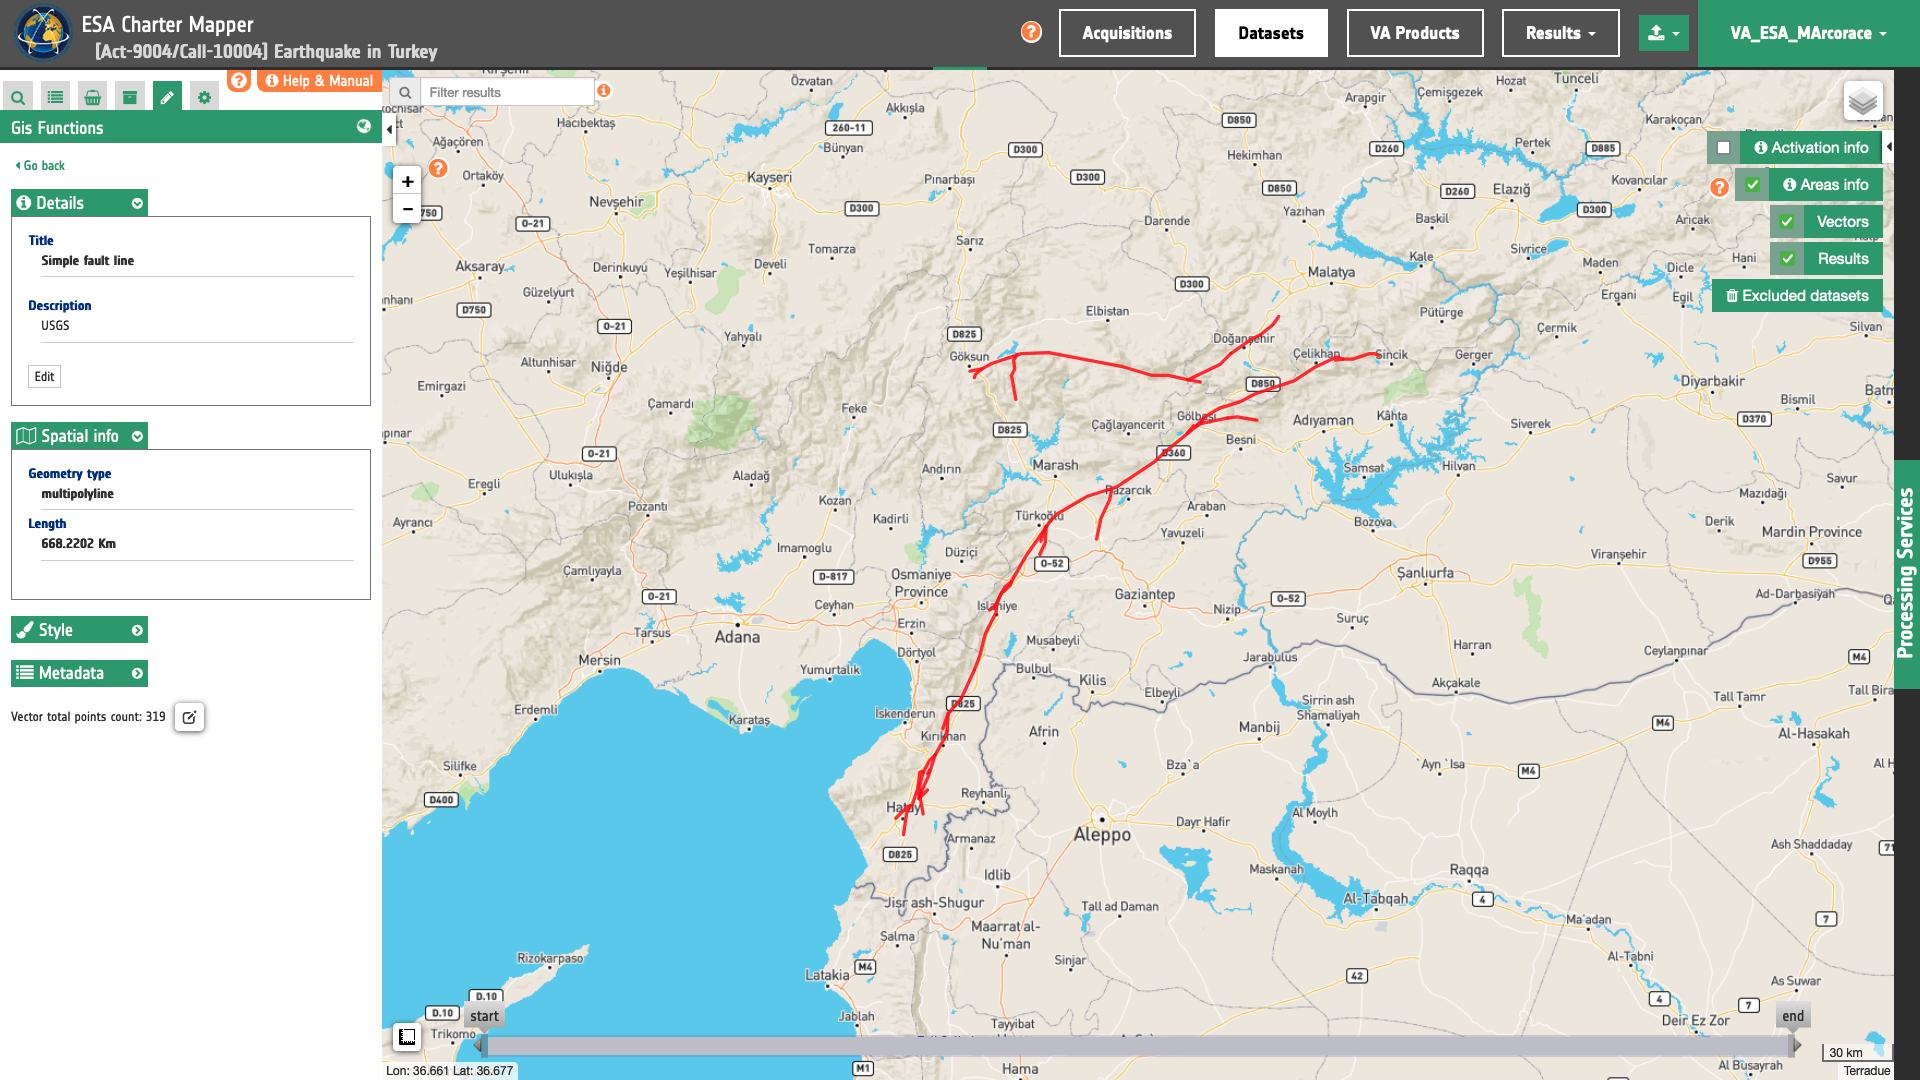
Figure 9 - Editing of metadata of a multipolyline feature in GIS functions.
Shape editing
Online editing functions of vectors include also the modification of the shape (delete, add or move a vertex of a polygon) and of vector labels.
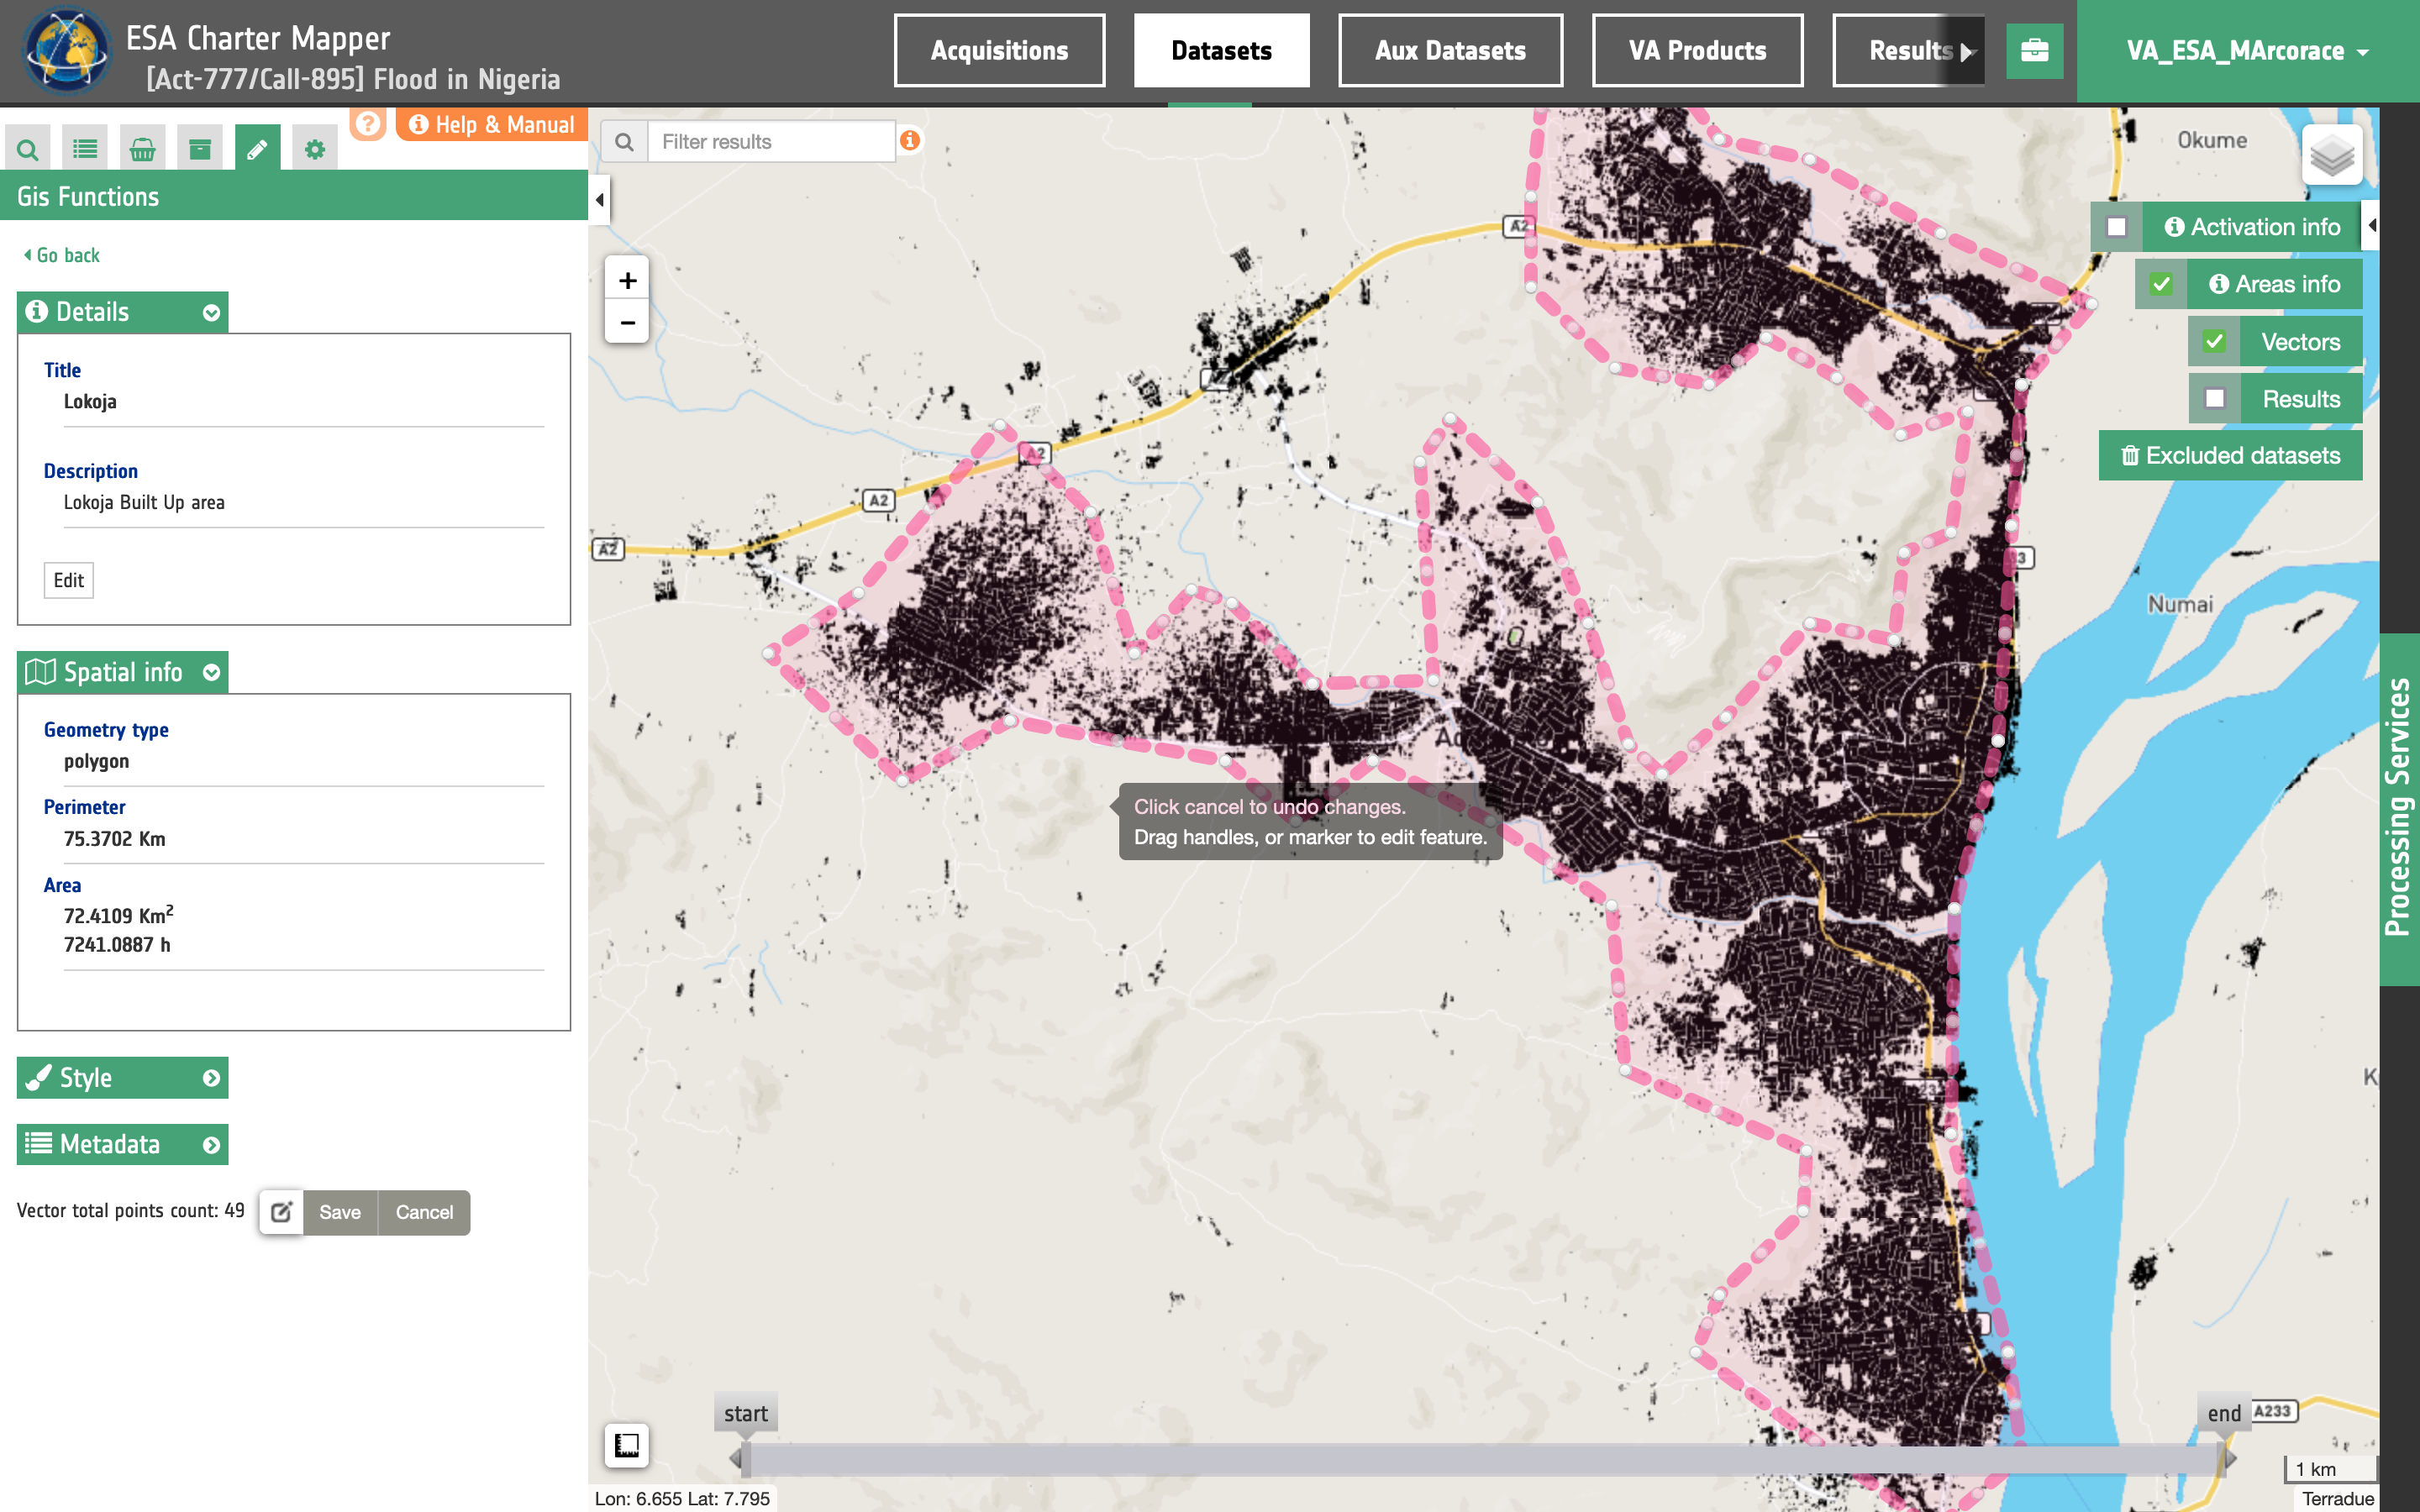
Figure 10 - Online editing of vertices into a polygon in the geobrowser.
Style editing
User can change vector's visual styles, like color (border and fill) and vector opacity.
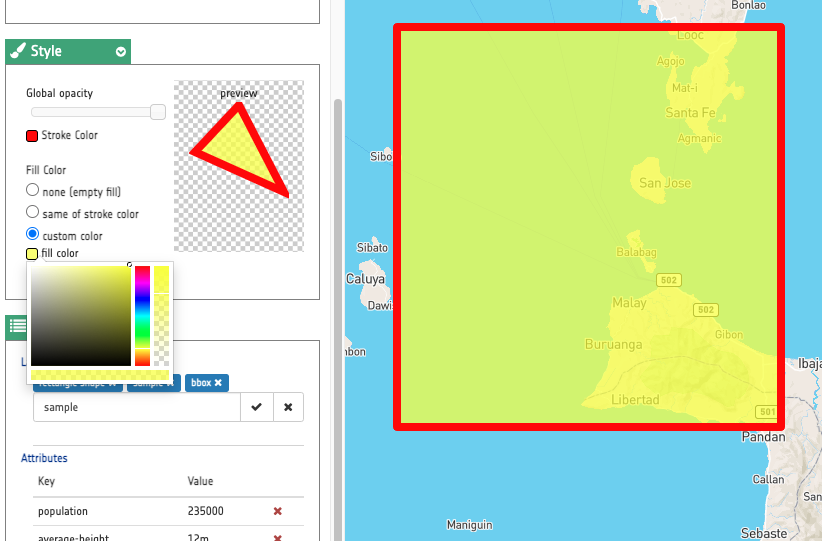
Figure 11 - Online editing of vector style in the geobrowser.
Export vector
In the ESA Charter Mapper it is also possible to save and export the created and edited vectors.

Figure 12 - GIS Functions export button.
When exporting vectors, those are offered in GeoJSON (.json) format.
Metadata and style are stored in the GeoJSON to include this information when uploading the vector back to the ESA Charter Mapper.
-
GeoJSON, a format for encoding a variety of geographic data structures. Available at: https://geojson.org/. ↩