IRIS tutorial
![]()
This service performs a Change Detection using a pair of calibrated optical single band assets from the same or different EO missions, or a pair of SAR single band assets acquired from the same sensor. The service supports also a pair of spectral index or coherence single band assets derived from the same mission with other on-demand processors. The output consists of multiple change detection products derived from the Structural Similarity Index that show intensity, extent, and contours of the detected changes in the region of interest.
 IRIS service description and specifications are available in this section.
Select the processing service
After the opening of the activation workspace, in the right panel of the interface, open the Processing Services tab.
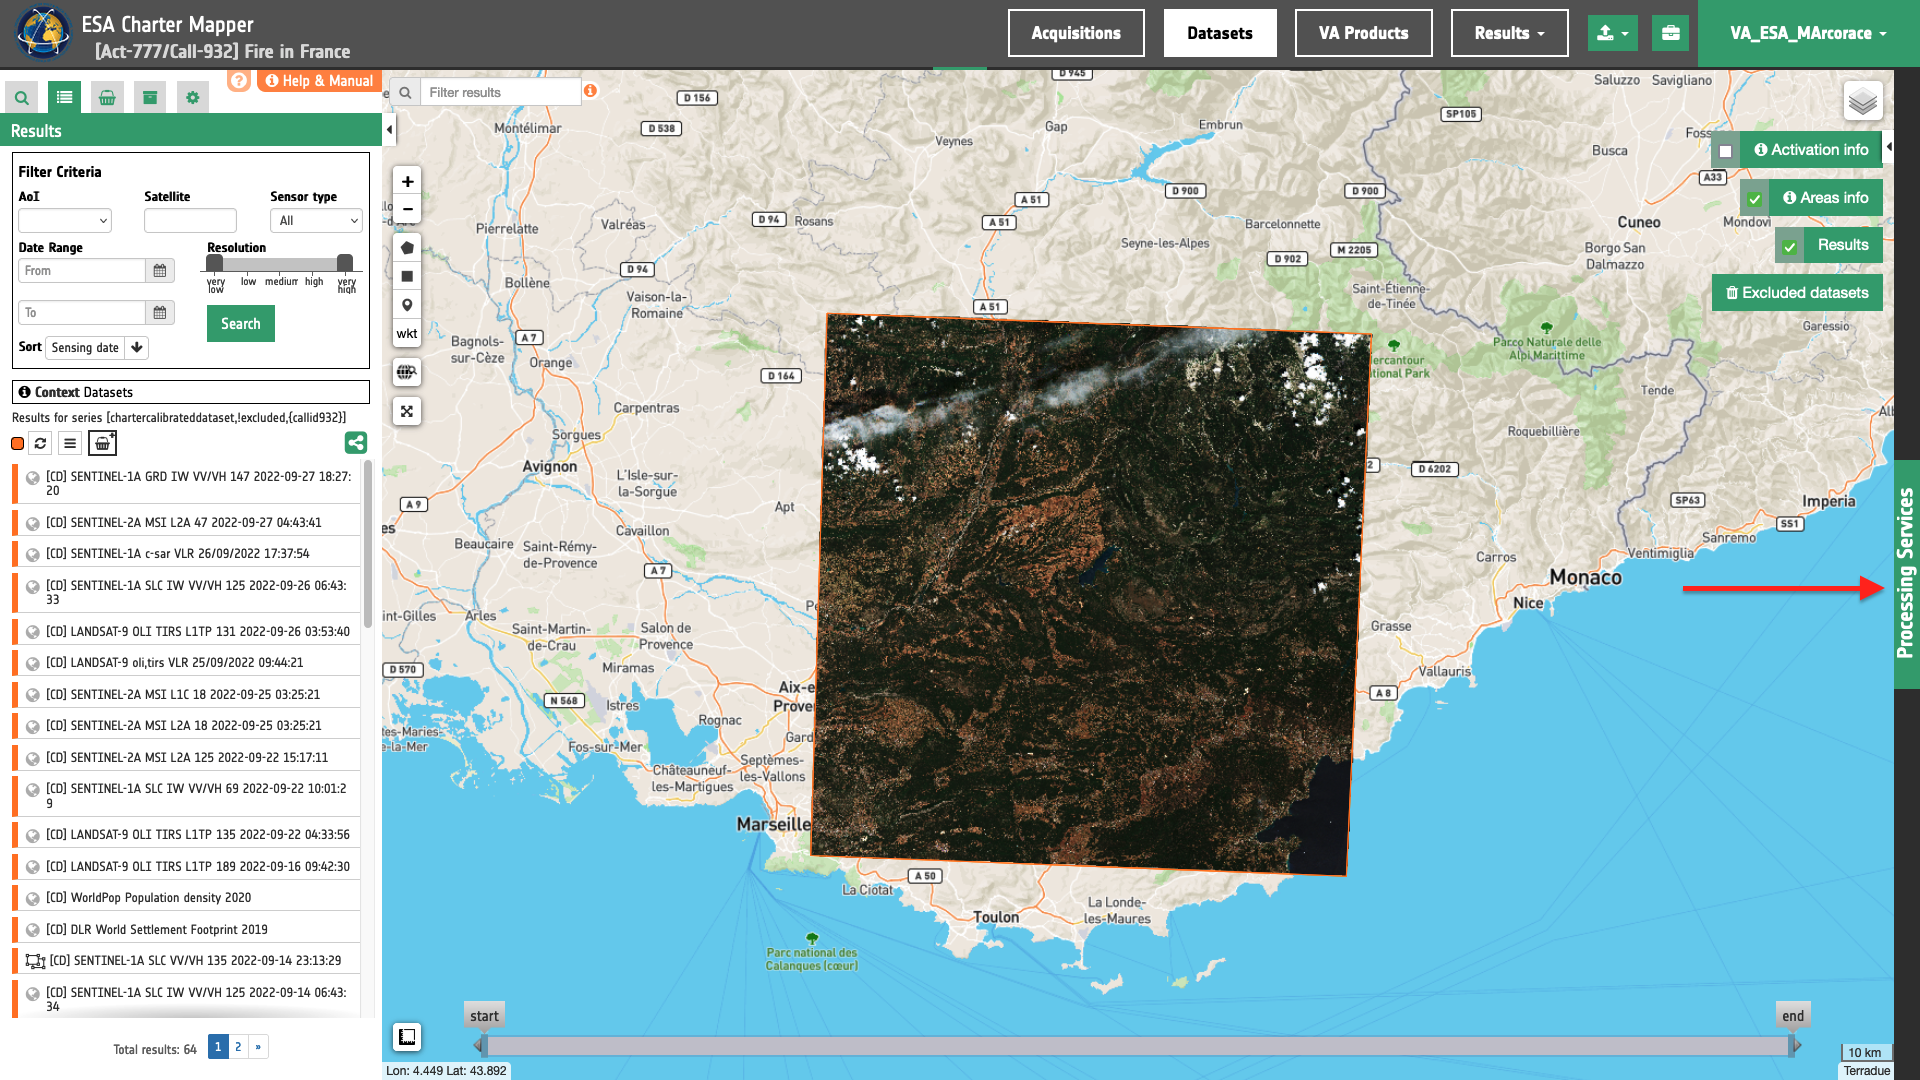
Select the processing service Change Detection Analysis (IRIS).
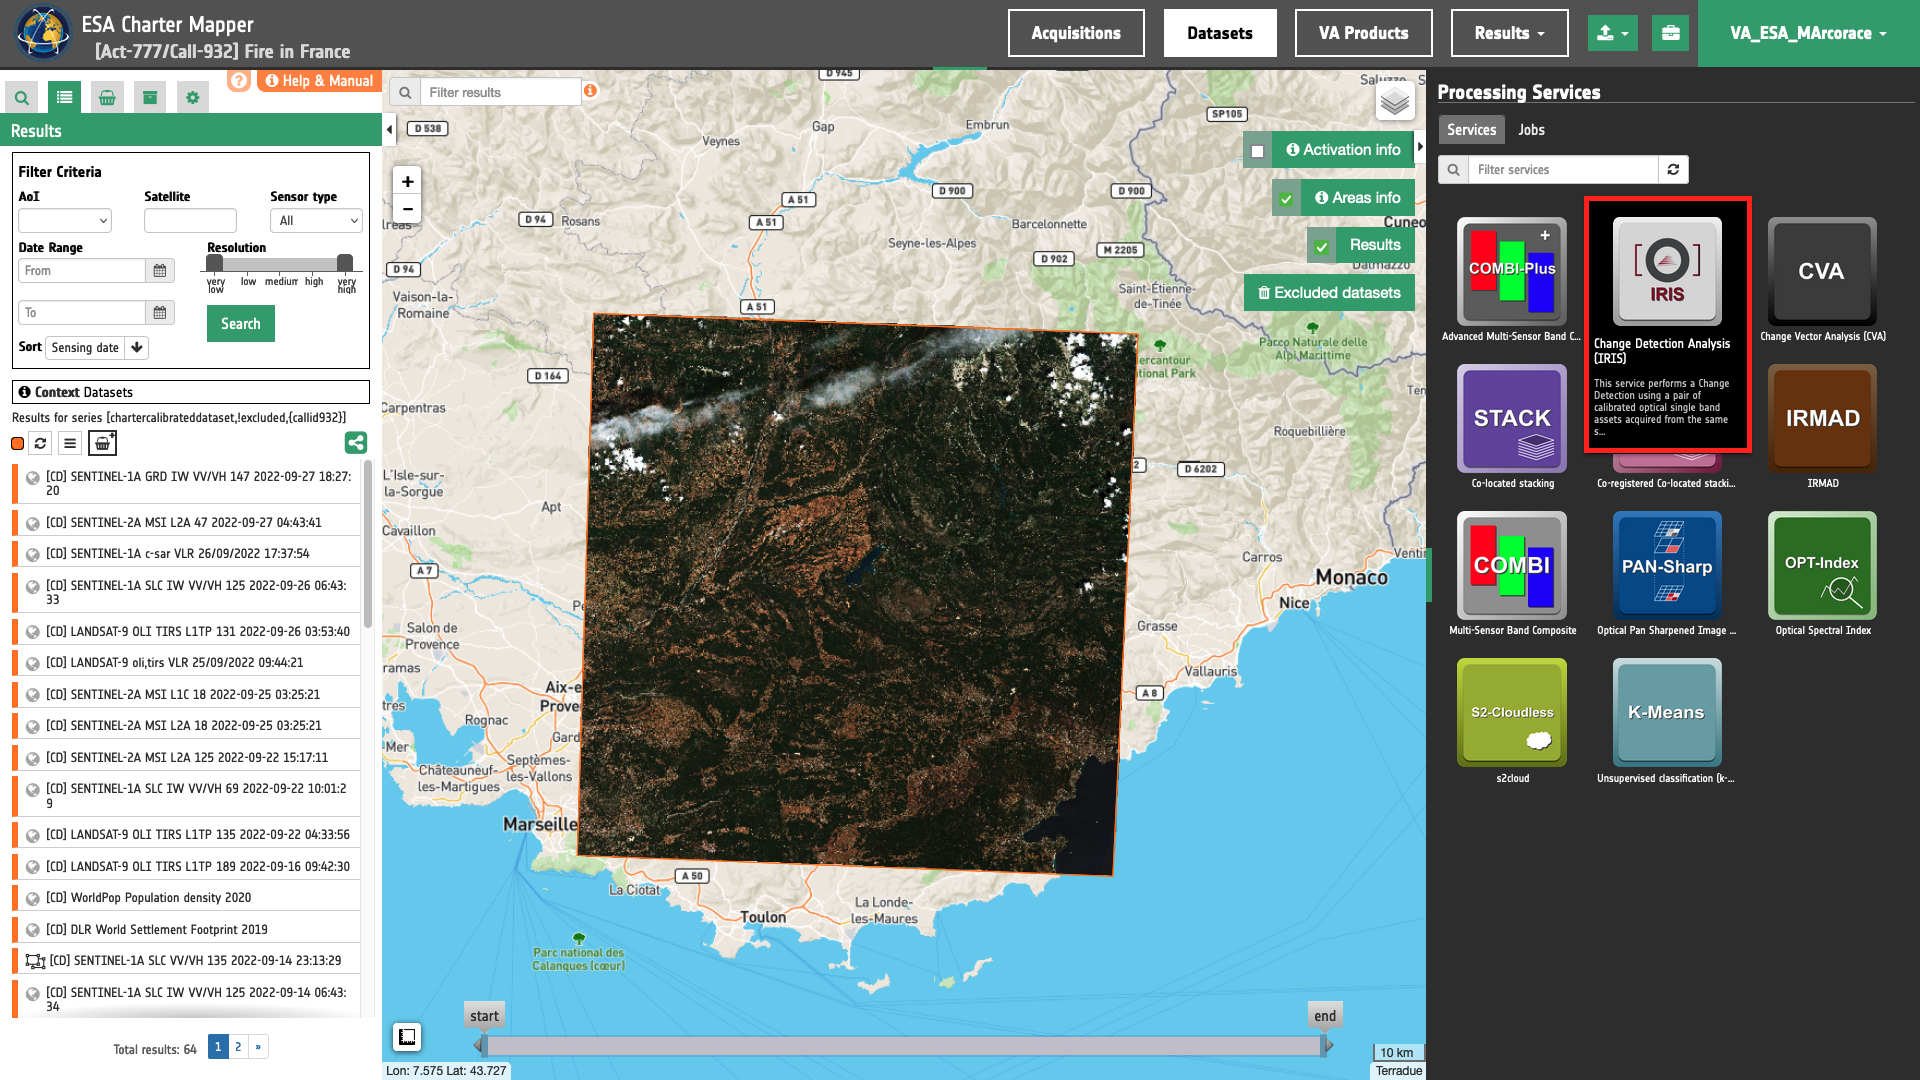
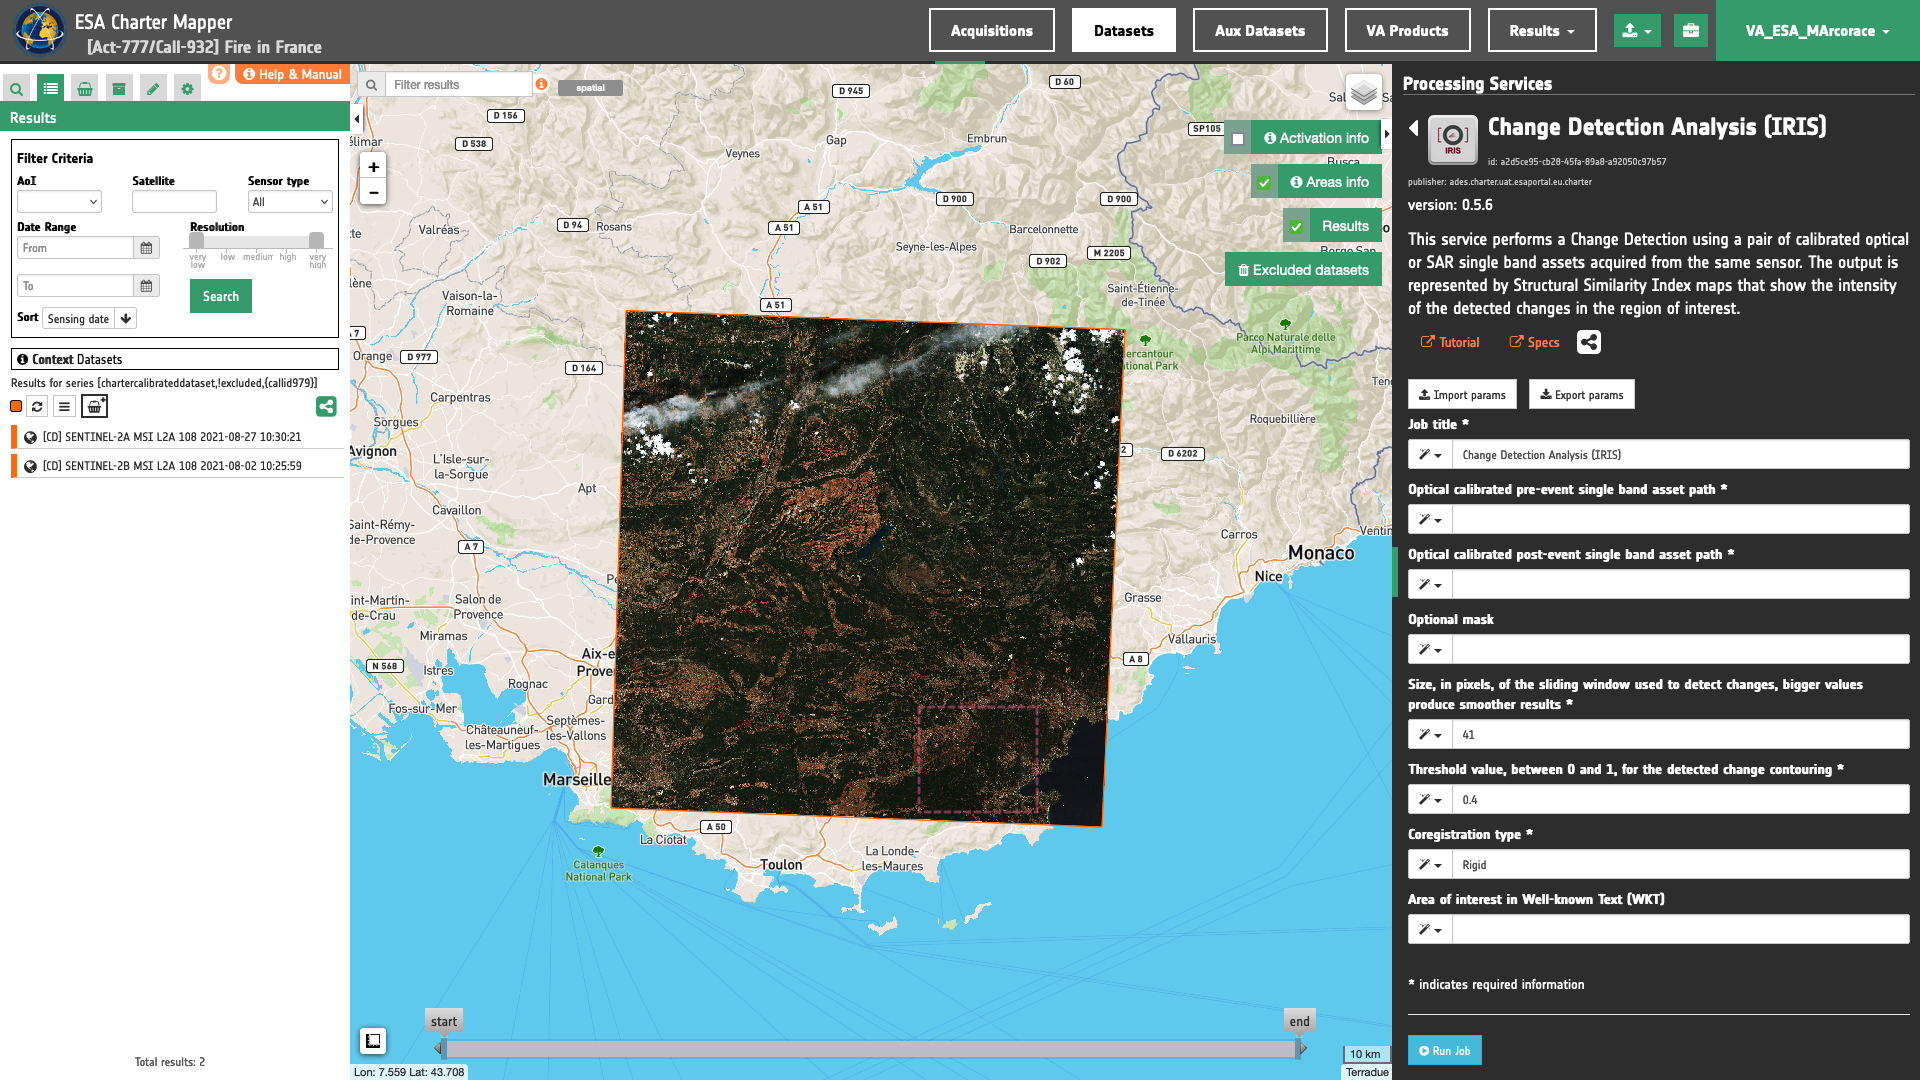
The "Change Detection Analysis (IRIS)" panel is displayed with parameters values to be filled-in.
Use case 1: change detection analysis using a pair of reflectance single band assets
Abstract
This first use case explains how to make change detection analysis with IRIS using a pair of NIR BOA reflectance single band assets from Optical Calibrated Datasets acquired by the same sensor before and after a wildfire event.
Find the data using multiple filter criteria
Select the area for which you want to do an analysis, e.g over South-eastern France. From the Navigation and Search toolbar (located in the upper left side of the map), click on the Spatial Filter and draw a square AOI over the Riviera resort of Saint Tropez in the Var Department, France. This spatial filter allows you to select only the EO data acquired over this area.
Now it is possible to choose a pair of pre- and post-event reflectance images from Optical Calibrated Datasets to be used for the change detection analysis. This pair must come from the same sensor.
From the top of the left panel, use Filter Criteria to search for Optical and sentinel-2 data collections from the list.
In this example the selected pair of calibrated datasets are:
-
Pre-event calibrated dataset: [CD] SENTINEL-2B MSI L2A 108 2021/08/02 10:25:59
-
Post-event calibrated dataset: [CD] SENTINEL-2A MSI L2A 108 2021/08/27 10:30:21
Fill the parameters
After the definition of spatial and time filters, you can employ IRIS, by using a suitable pair of Calibrated Datasets from Sentinel-2 data.
To do so you can fill the parameters as described in the following sections.
Job name
- Insert as job name:
IRIS Sentinel-2 02/08 - 27/08 2021 Wildfire Var France
Input pair of single-band geophysical assets
First two mandatory parameters are input "Reference" and "Secondary" single band assets from Optical/Radar Calibrated Datasets, or Results from on-demand processing. This parameter is required to specify both the reference to the Calibrated Dataset and the single band asset (e.g. nir) to be used for the change detection analysis.
Hint
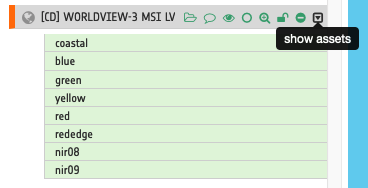
To consults the bands of a Calibrated Dataset just Click on Show assets button available near the feature title. After the click a list with all single-band assets (CBNs) included within the Calibrated Dataset will appear under the feature title.
Thus, drag and Drop the selected assets:
-
single band reflectance asset from a pre-event Calibrated Dataset for CBN =
nir -
single band reflectance asset from a post-event Calibrated Dataset for CBN =
nir
in the Pre-event single band asset and Post-event single band asset fields respectively.
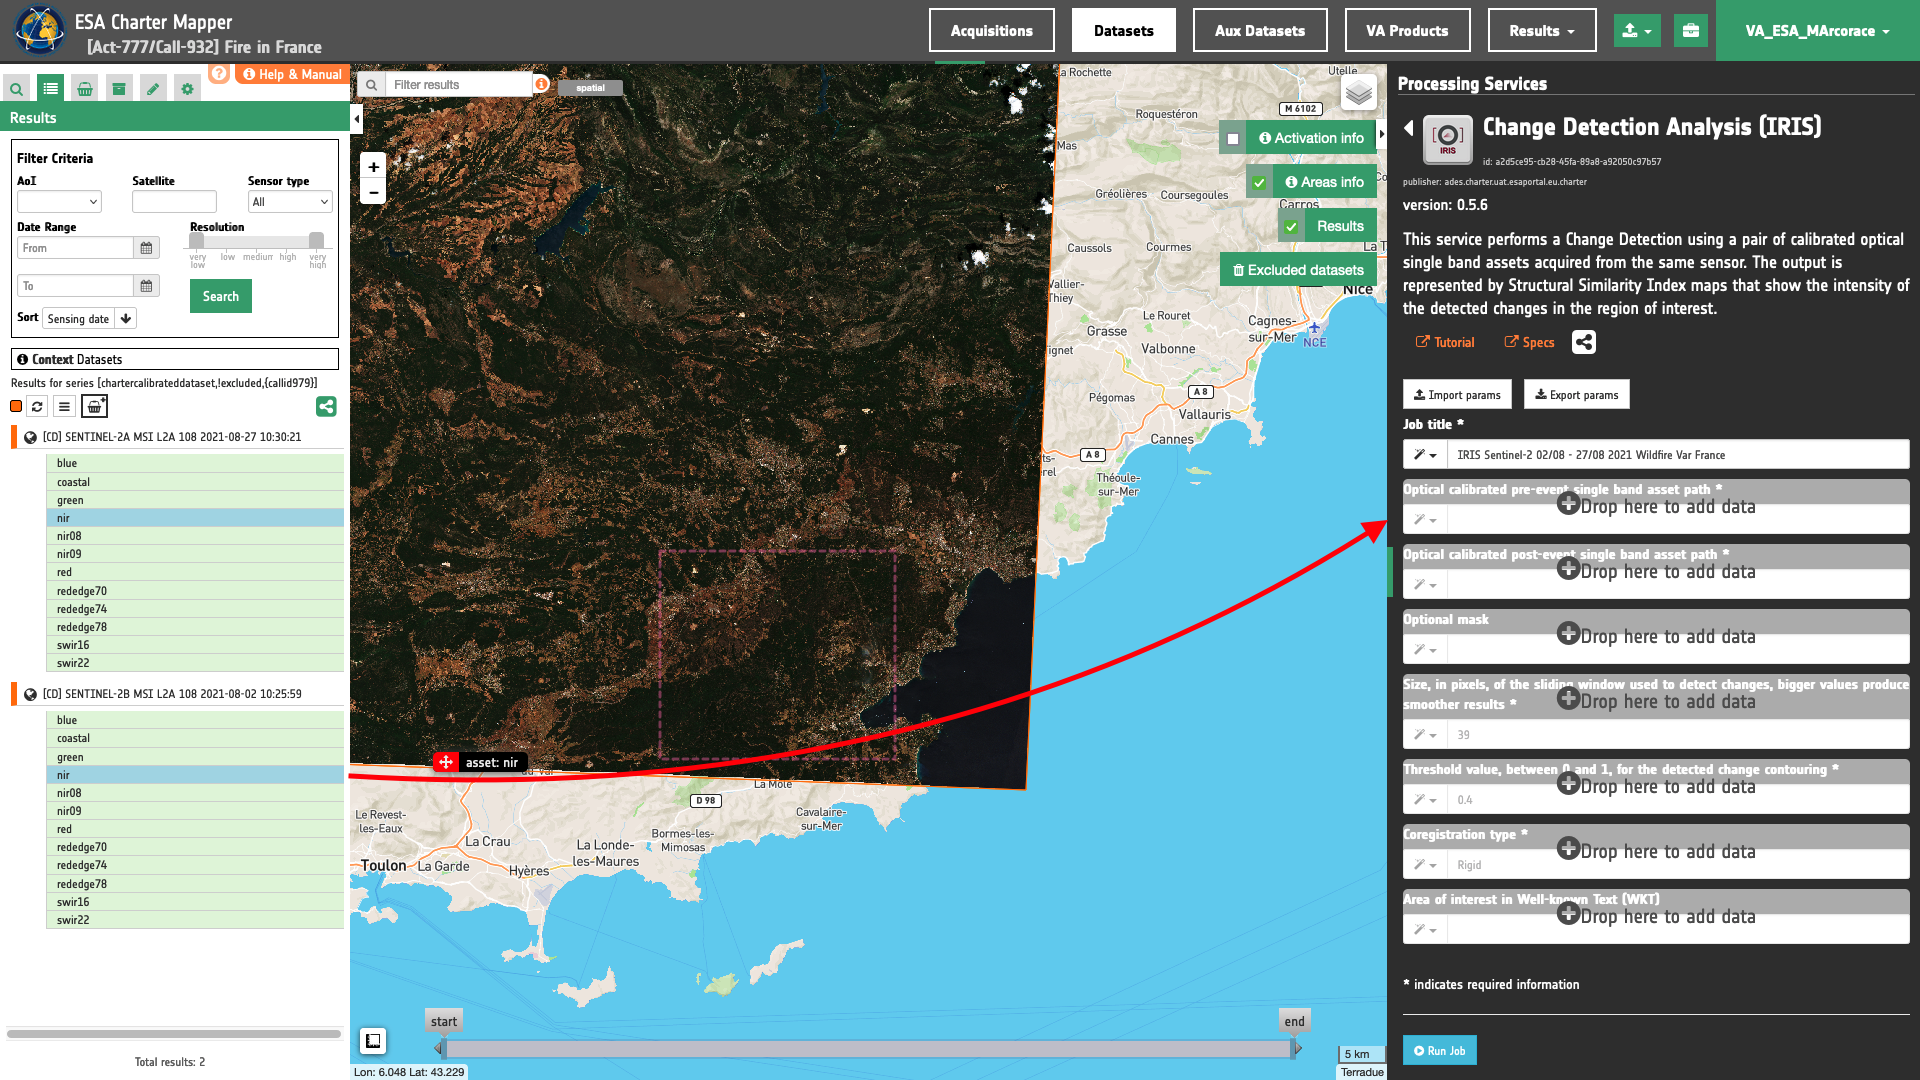
Warning
Users must drag and drop the single-band asset (e.g. red) into both Optical calibrated pre-event single band asset and Optical calibrated post-event single band asset fields. The drag and drop of the Calibrated Dataset (e.g. [CD] SENTINEL-2A MSI L2A 46 2021/12/11 02:31:11) is not enough.
Optional mask
If needed a single band asset representing a binary mask can be employed here to mask out IRIS results (e.g. a cloud mask to make IRIS change detection only over cloud free pixels). In this use case this parameter is not employed. Before using this parameter see this section of the IRIS service specifications
Window size
Insert as a value for the window size the value of 39.
Note
This value defines the size of the sliding window in pixels, this parameter can highly influence the result of the analysis. The higher this parameter is set, the more averaged the change map will be, while the smaller and the more detailed changes can be identified at the cost of potentially noisier results. This is due to the SSIM value for each pixel being computed using the information present in the whole sliding window, thus obtaining a more localized value of the index in case of a smaller window.
Warning
The dimension of the window should be set in a range between 9 and 71. Inserted value must be odd. If the inserted value is even or is outside this range, a warning will be given to the user.
Threshold
Insert as a threshold the value of 0.4. This value will be used by the processor in the binarization of SSI to estimate the binary change mask and generate the contours overview.
Co-registration method
In this mandatory parameter the user shall choose the co-registration method to employ. Under Co-registration type a list of selectable options are available. Find specifications of each option here.
Insert, for example, the value Rigid to employ a rigid co-registration of secondary and reference input assets. The full-field displacement measured is used to estimate an Affine transformation matrix which is then applied to the secondary image.
Area of interest expressed as Well-known text (optional)
The “Area of interest as Well Known Text” can be defined by using the drawn polygon defined with the area filter.
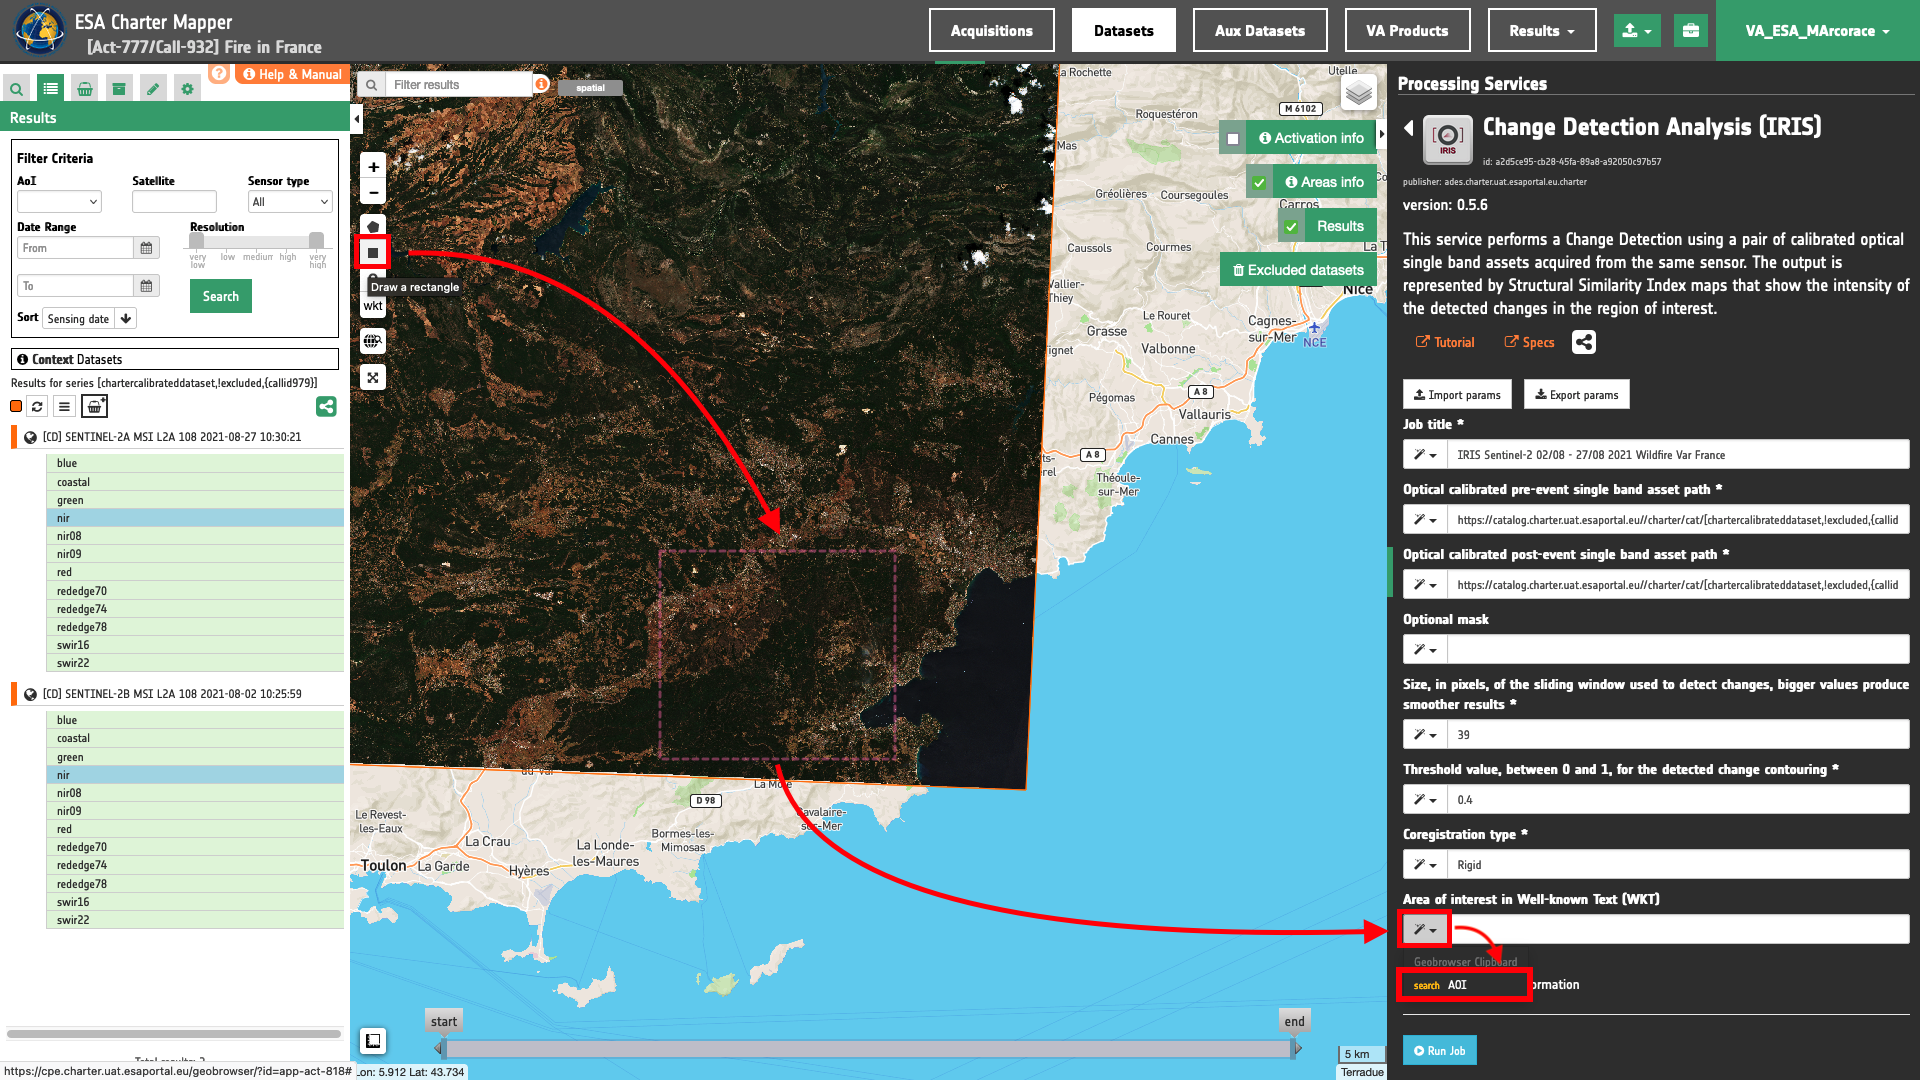
Tip
In the definition of “Area of interest as Well Known Text” it is possible to apply as AOI the drawn polygon defined with the area filter. To do so, click on the button in the left side of the "Area of interest expressed as Well-known text" box and select the option AOI from the list. The platform will automatically fill the parameter value with the rectangular bounding box taken the from current search area in WKT format.
Note
This parameter is optional.
Run the job
Click on the button Run Job and see the Running Job
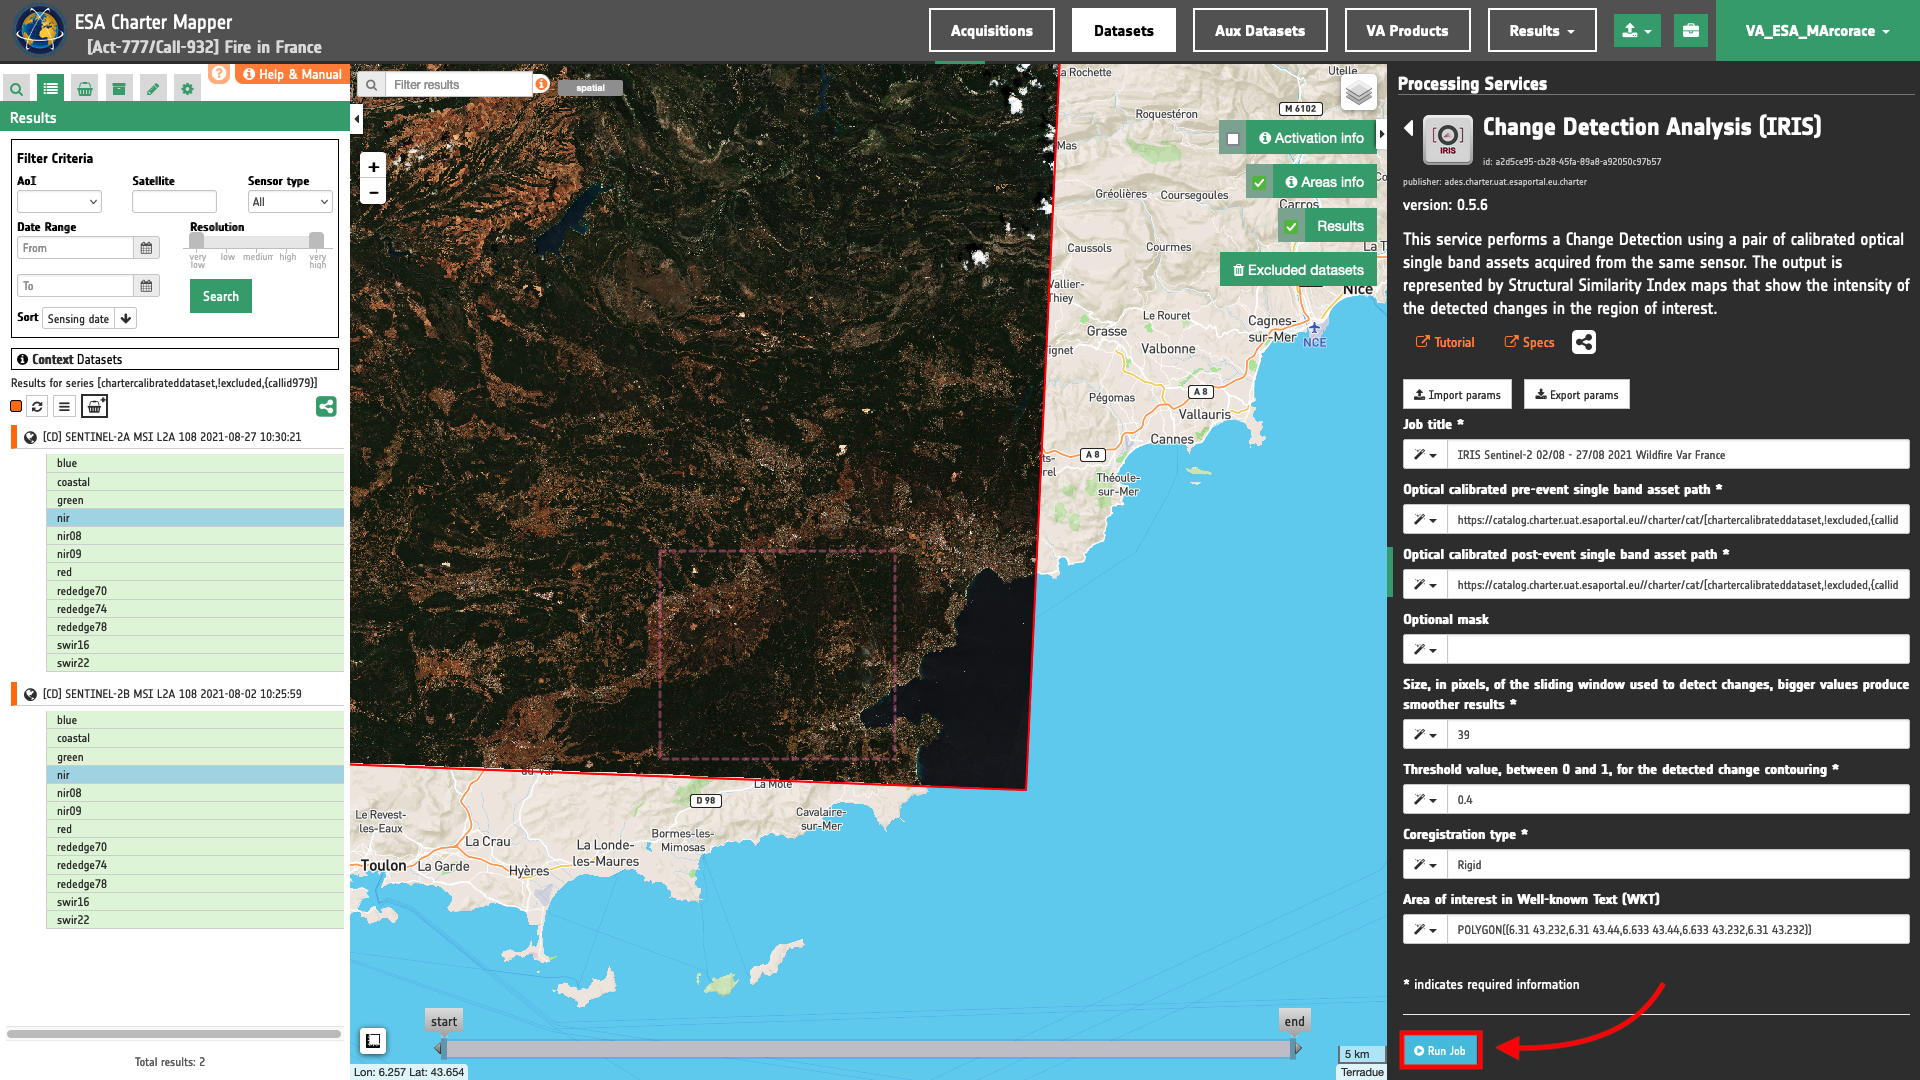
You can monitor job progress through the progress bar.
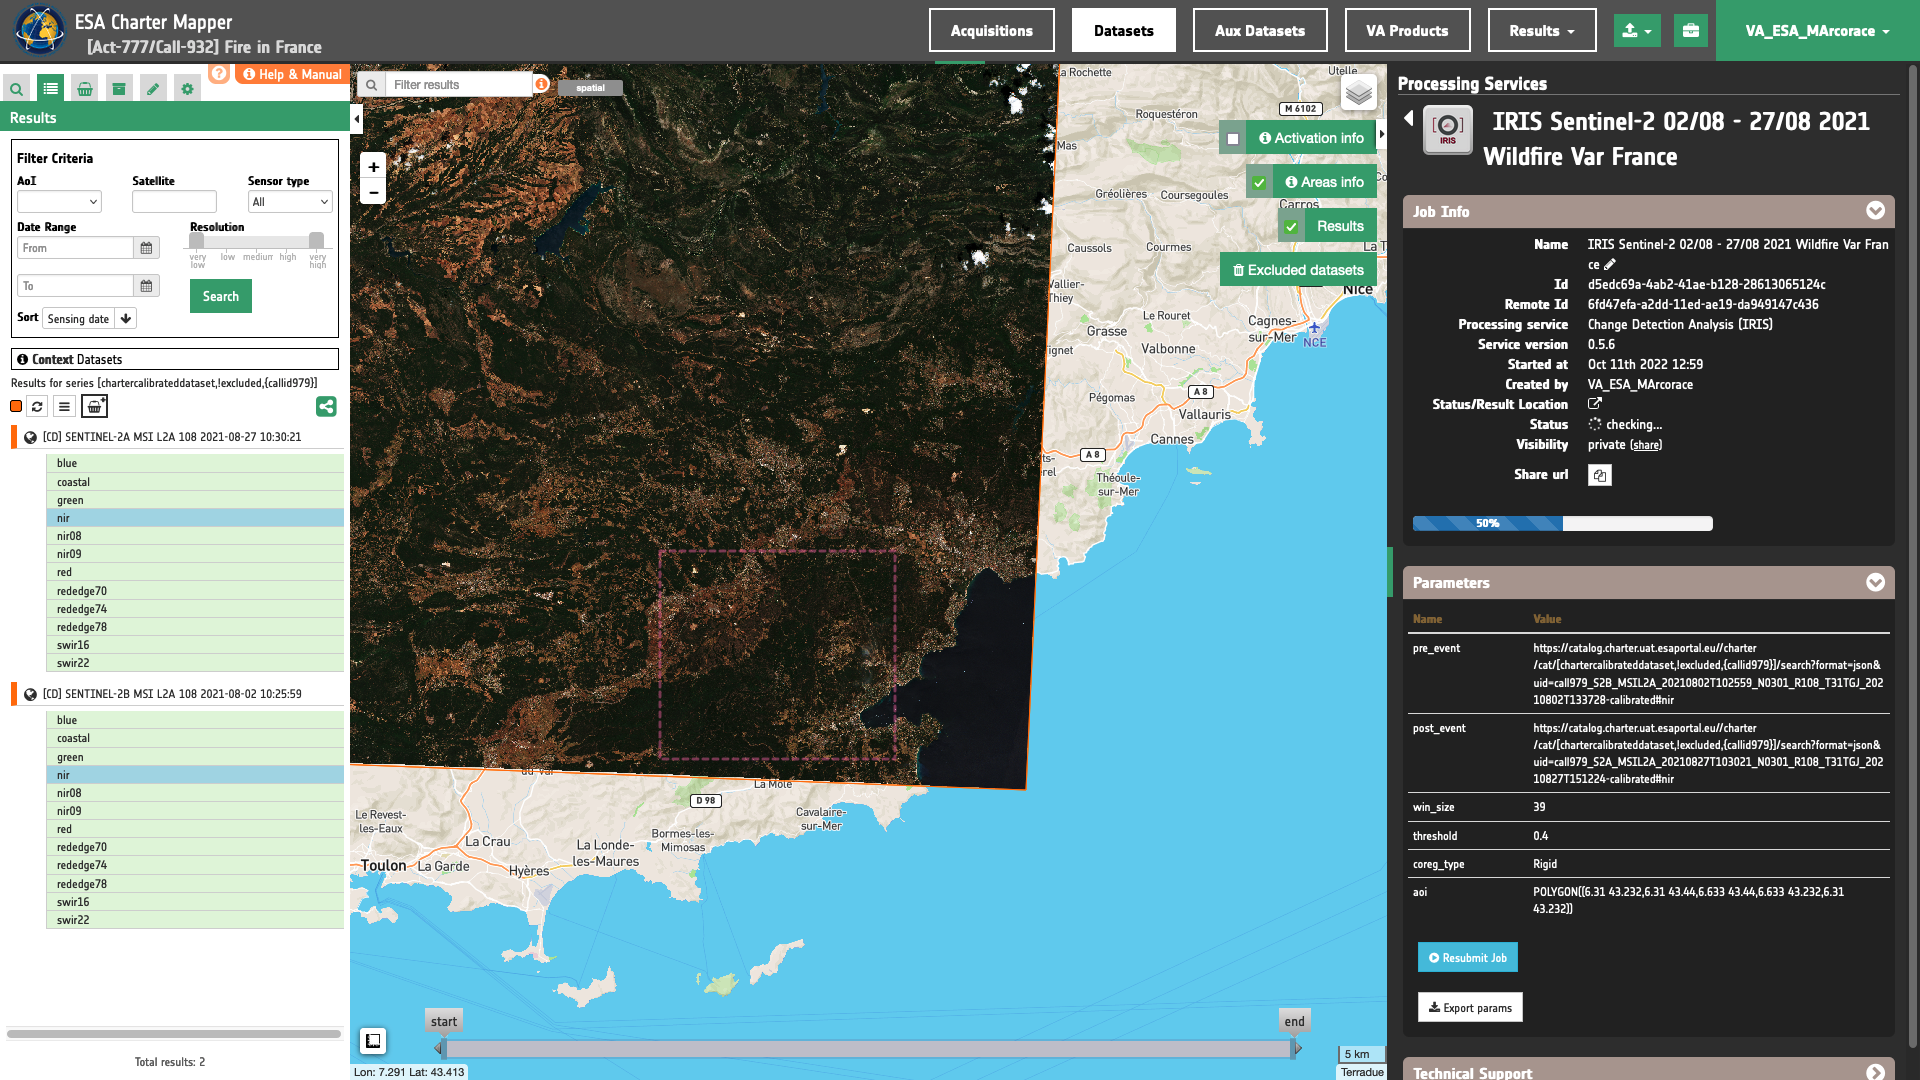
Results: download and visualization
Once the job is completed, click on the Show results button located at the bottom of the processing service panel.
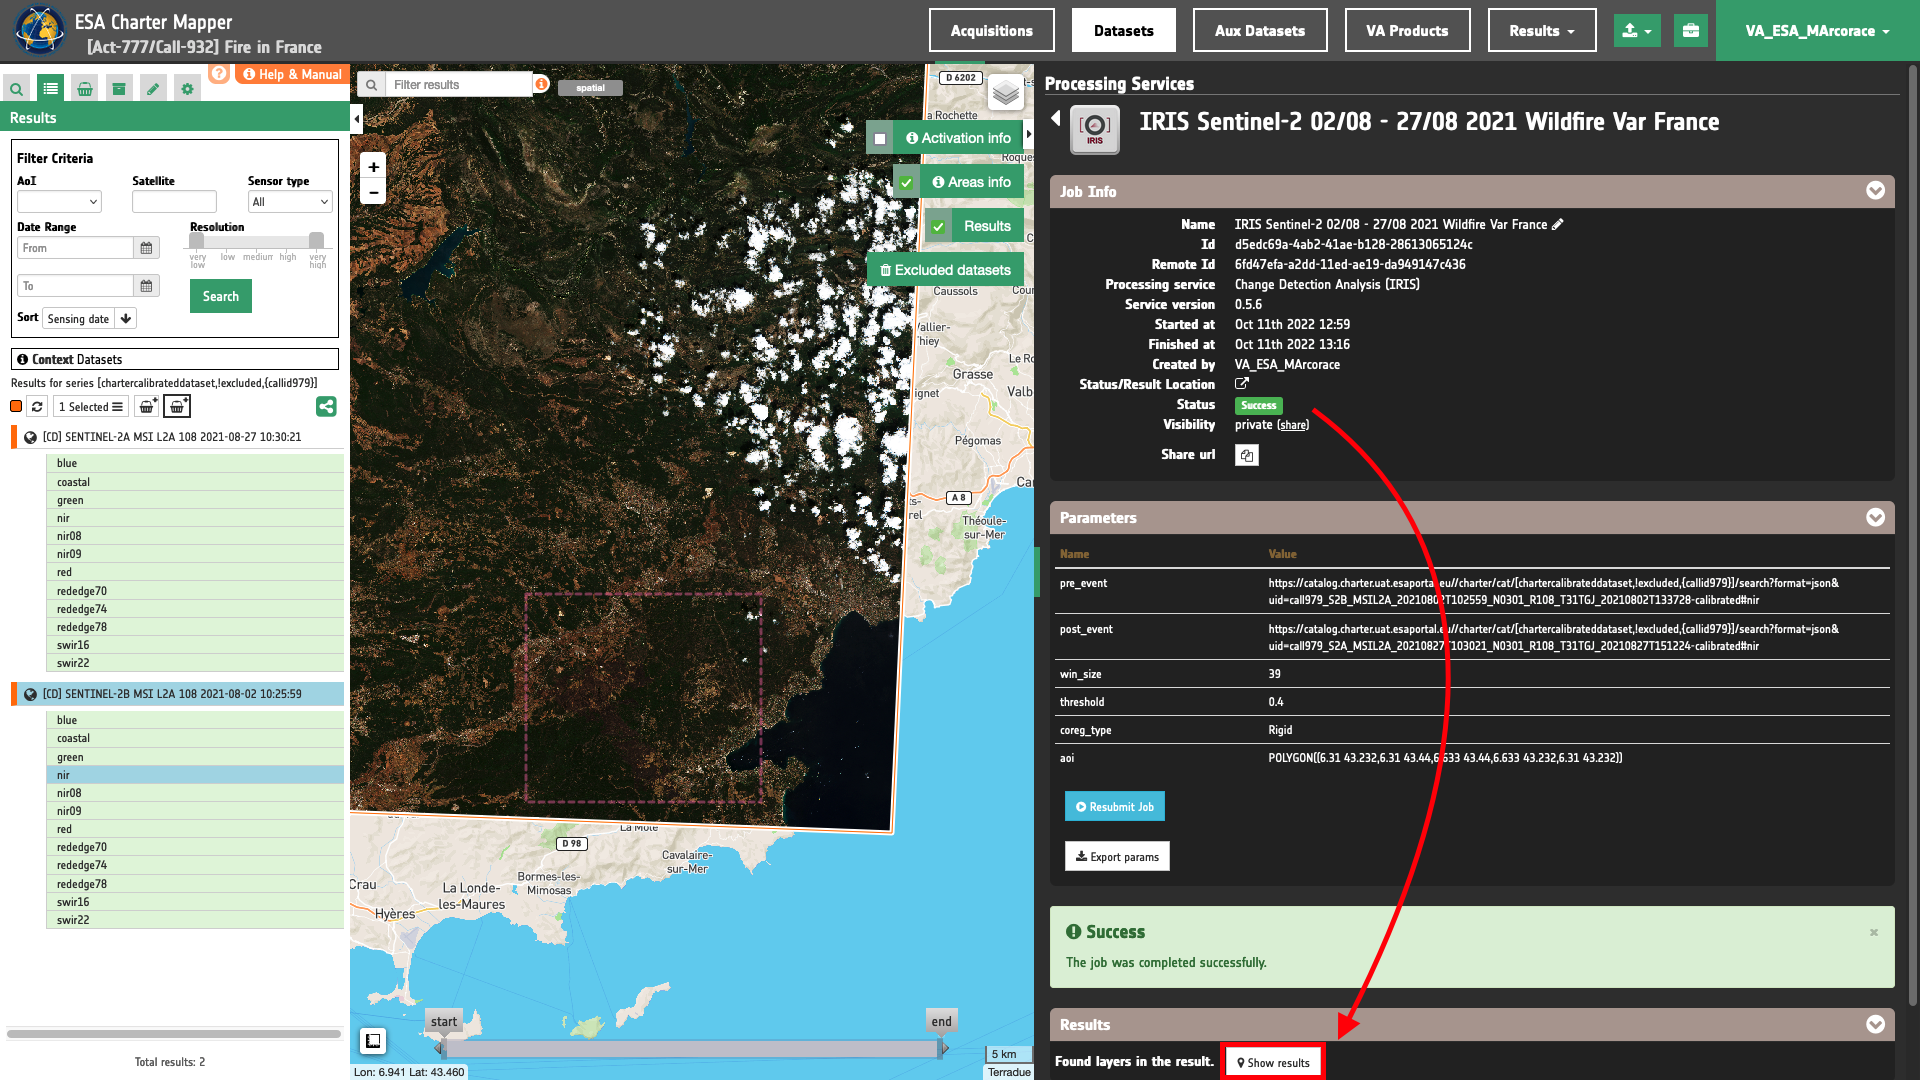
Tip
You can also save the parameters employed in this job by clicking on the Export params button in the right panel. This allows you to copy all your entries to the clipboard. This is meant to be used for a quick re-submission of a similar job after a fine tuning of the parameters (e.g. to add a color formula later).
Below is reported the syntax which includes all the parameters employed in this example.
{
   "pre_event": "https://catalog.disasterscharter.org//charter/cat/[chartercalibrateddataset,!excluded,{callid932}]/search?format=json&uid=call932_S2B_MSIL2A_20210802T102559_N0301_R108_T31TGJ_20210802T133728-calibrated#nir",
   "post_event": "https://catalog.disasterscharter.org//charter/cat/[chartercalibrateddataset,!excluded,{callid932}]/search?format=json&uid=call932_S2A_MSIL2A_20210827T103021_N0301_R108_T31TGJ_20210827T151224-calibrated#nir",
   "win_size": "39",
   "threshold": "0.4",
   "coreg_type": "Rigid",
   "aoi": "POLYGON((6.31 43.232,6.31 43.44,6.633 43.44,6.633 43.232,6.31 43.232))"
}
Visualization
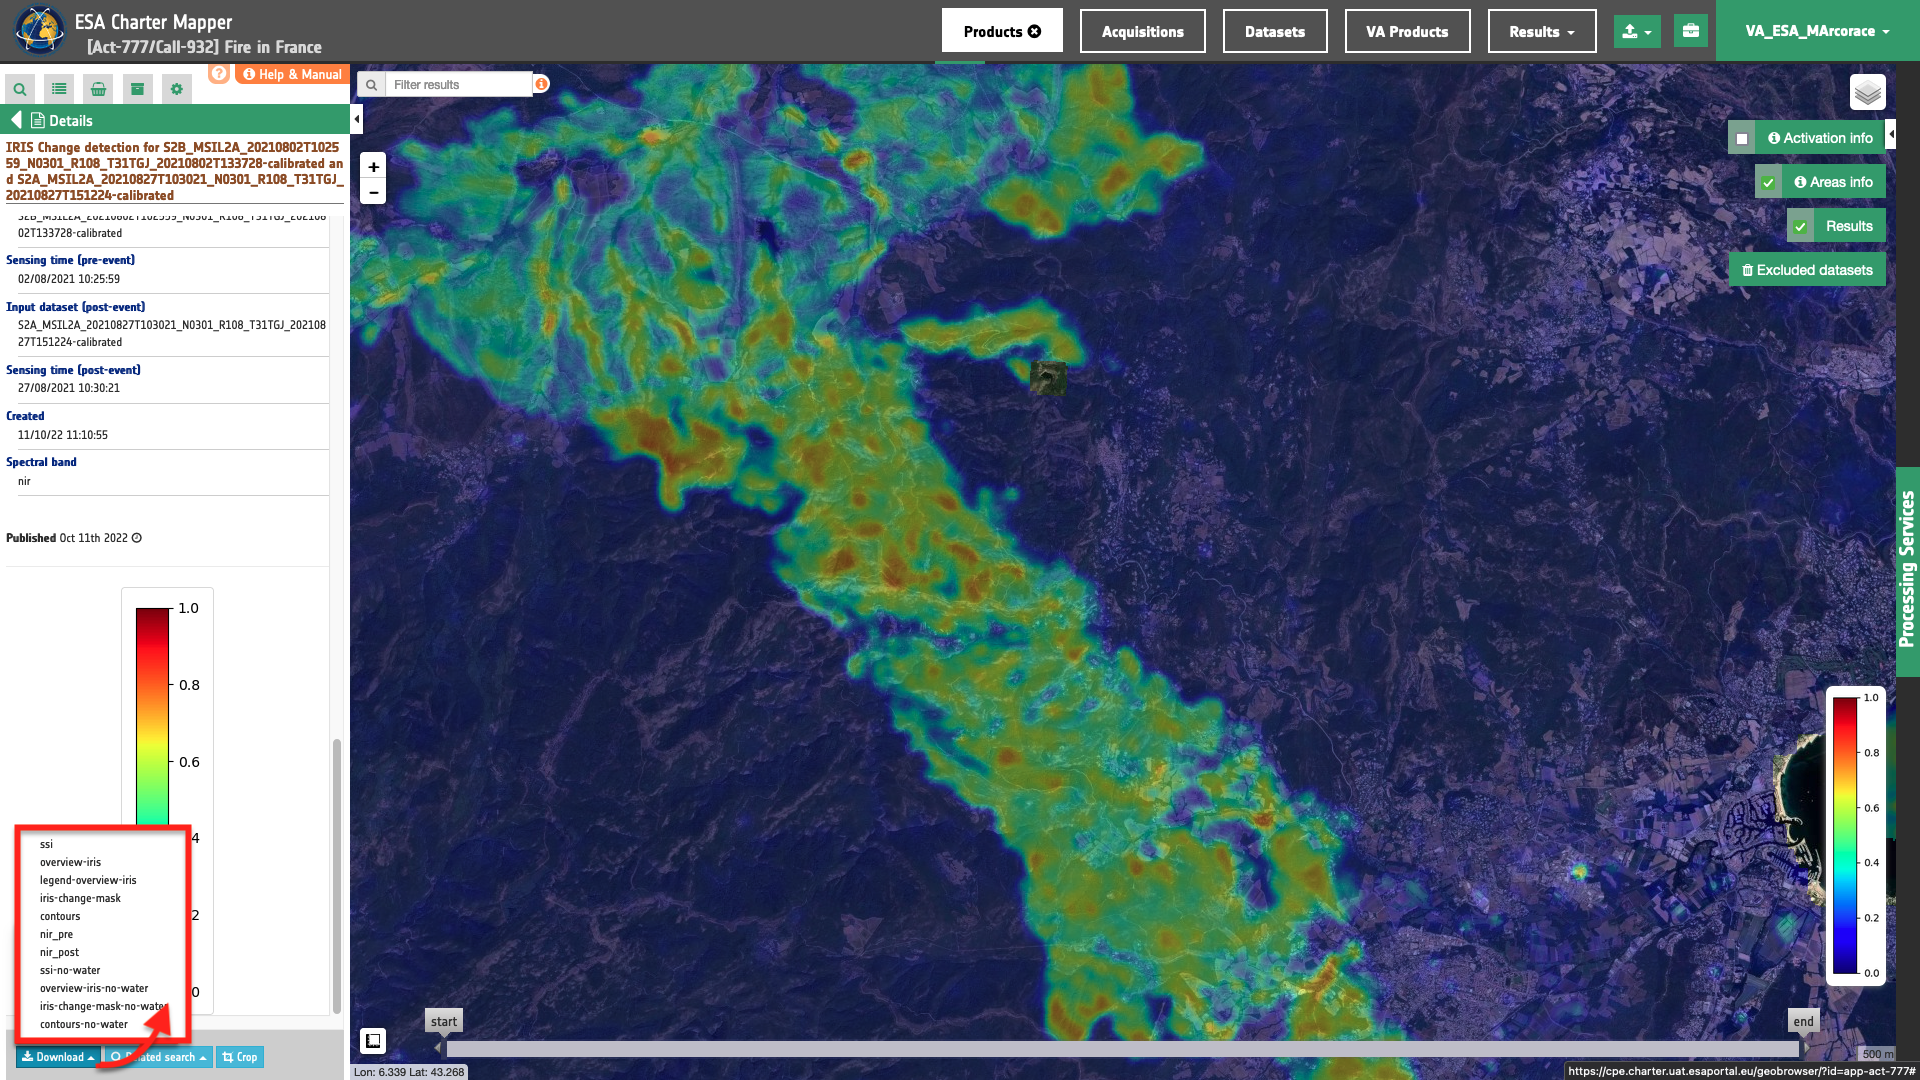
See the result on the map. The preview appears within the area defined in the spatial filter.
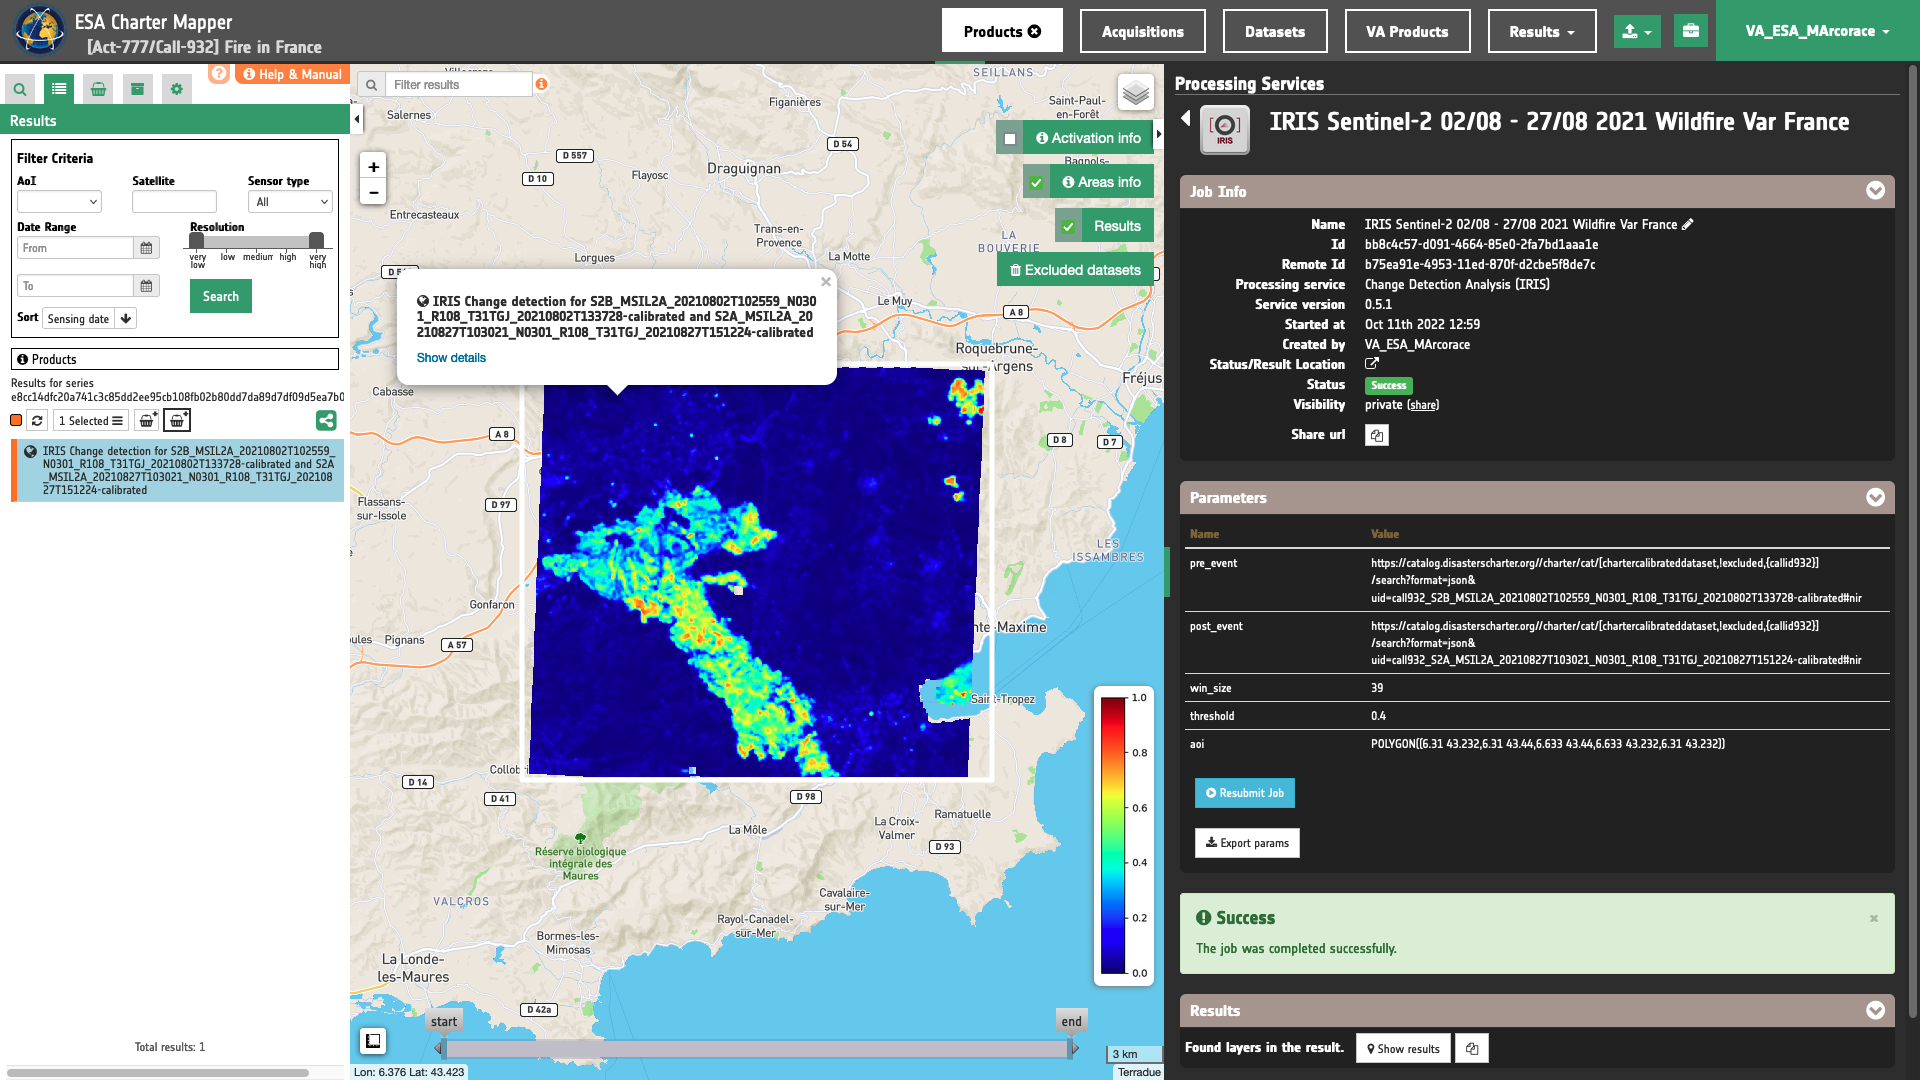
To get more information about the product just click on the preview in the map, a bubble showing the name of the layer IRIS Change detection for S2B_MSIL2A_20210802T102559_N0301_R108_T31TGJ_20210802T133728-calibrated and S2A_MSIL2A_20210827T103021_N0301_R108_T31TGJ_20210827T151224-calibrated will appear and then click on the Show details button.
Tip
To quickly access Product Details double click on the layer from the Results list.
In the left panel of the interface, the details of Job Result will appear with Product metadata. Furthermore by clicking on Layer styling you can also access to the View options.
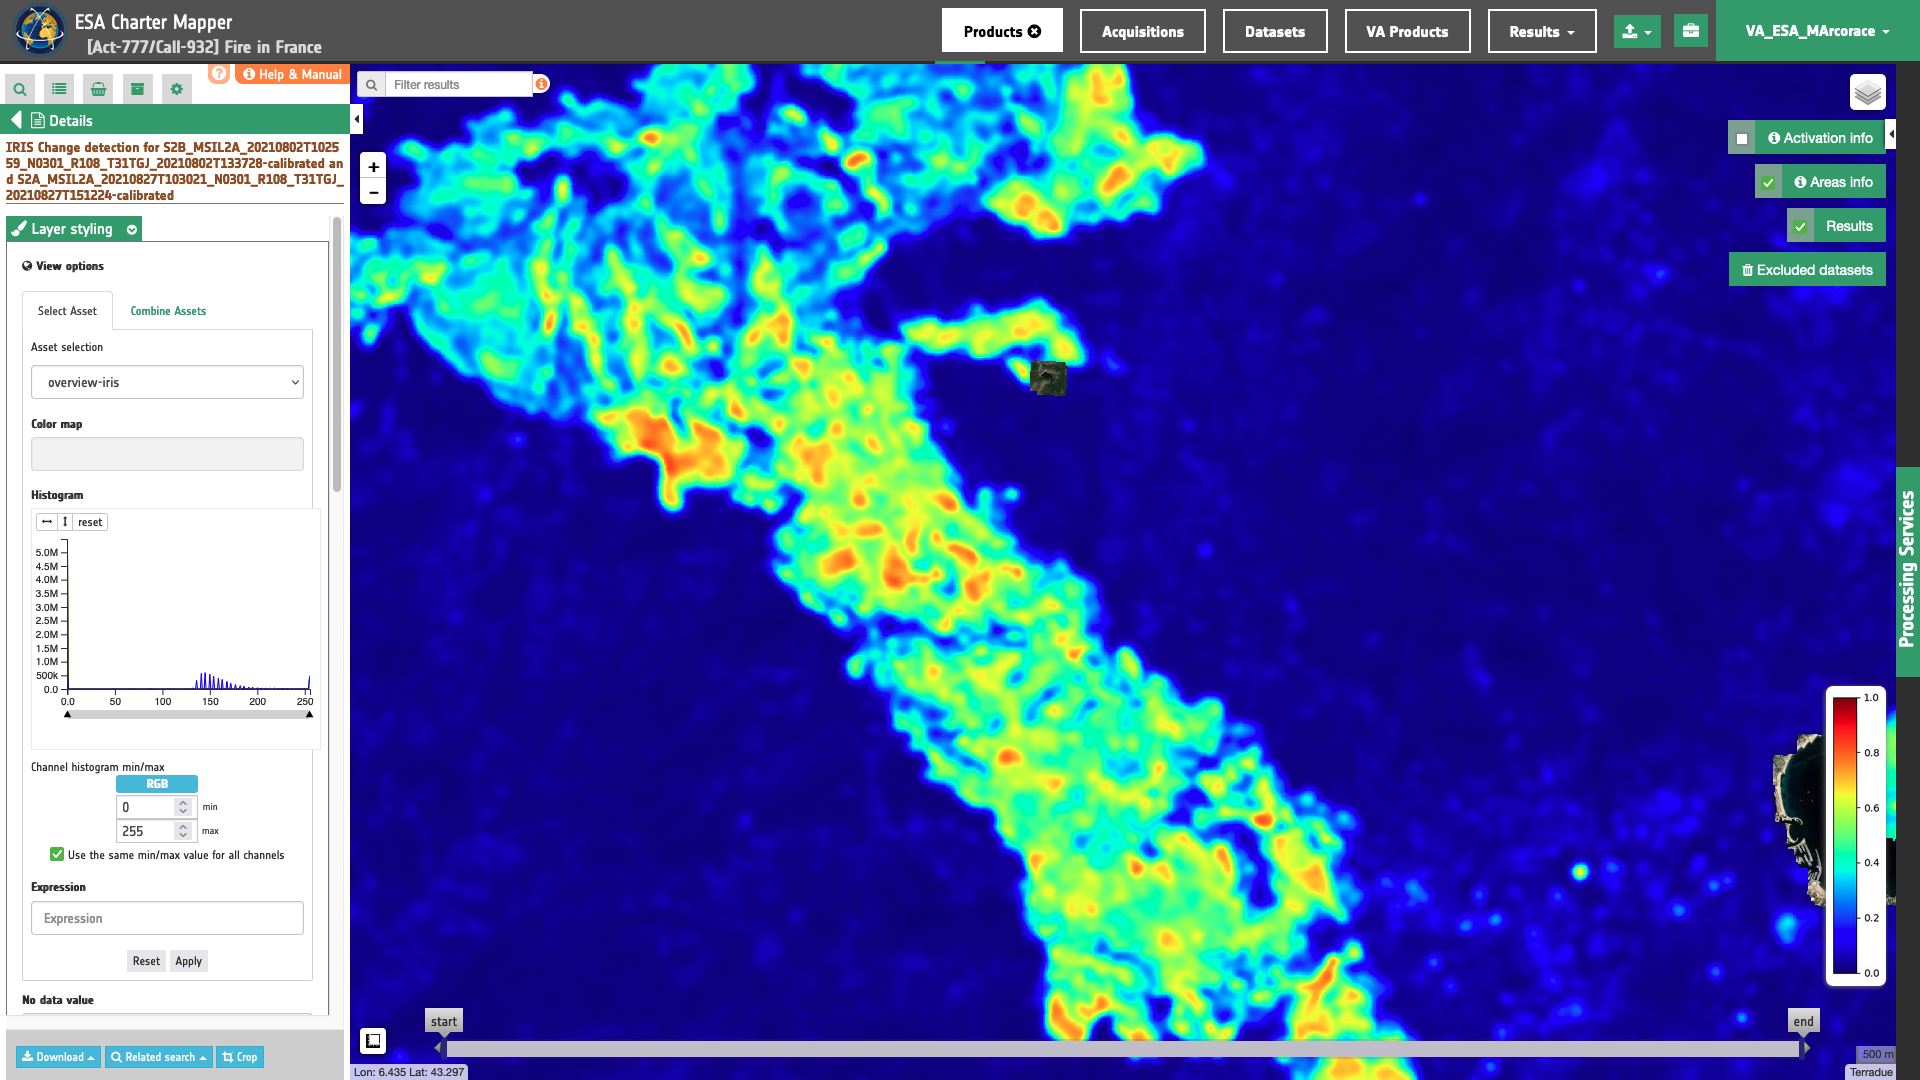
In here it is possible to see histogram/s of the Product which is visible in the map, set color formula, change Filters (e.g. Brightness, Opacity).
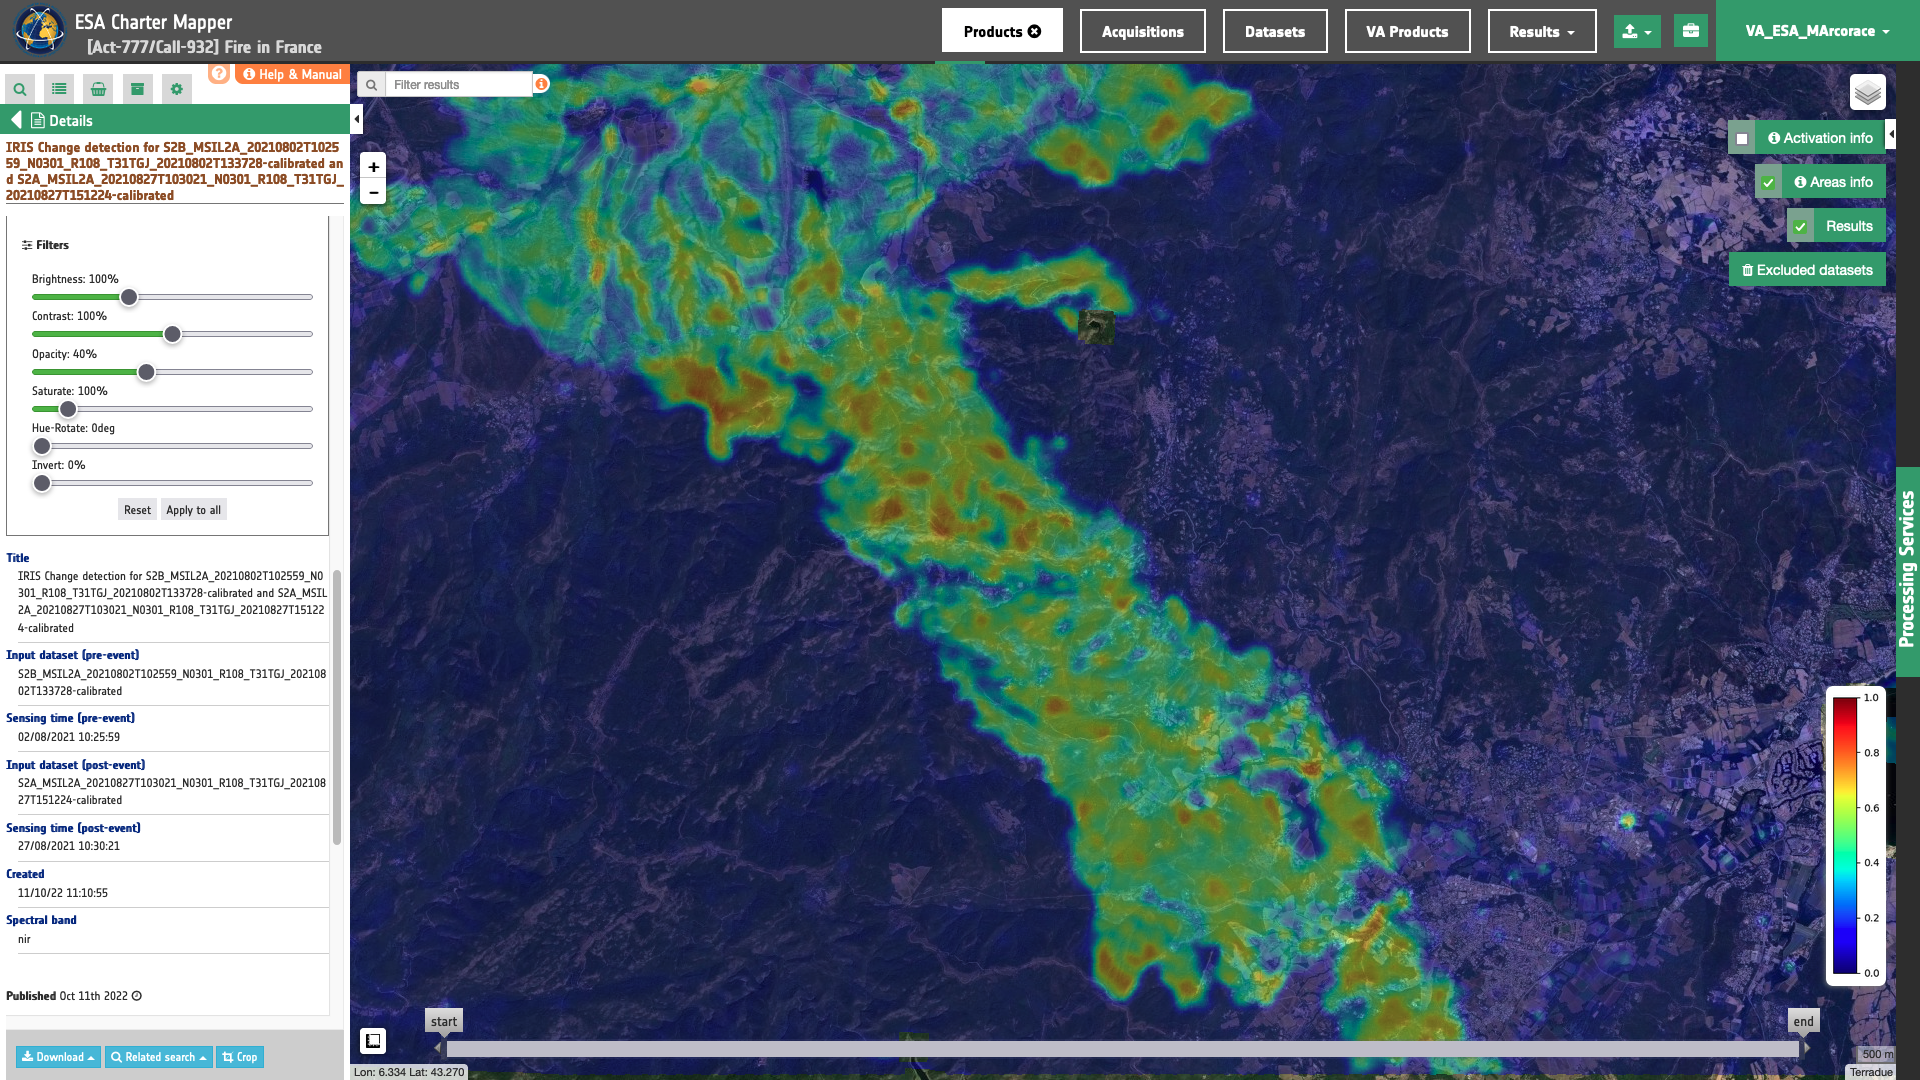
Tip
To visually compare the SSI overview product with the underlying base layer (e.g. Natural Earth or Dark map) you can set the Opacity filter under View options as 40%.
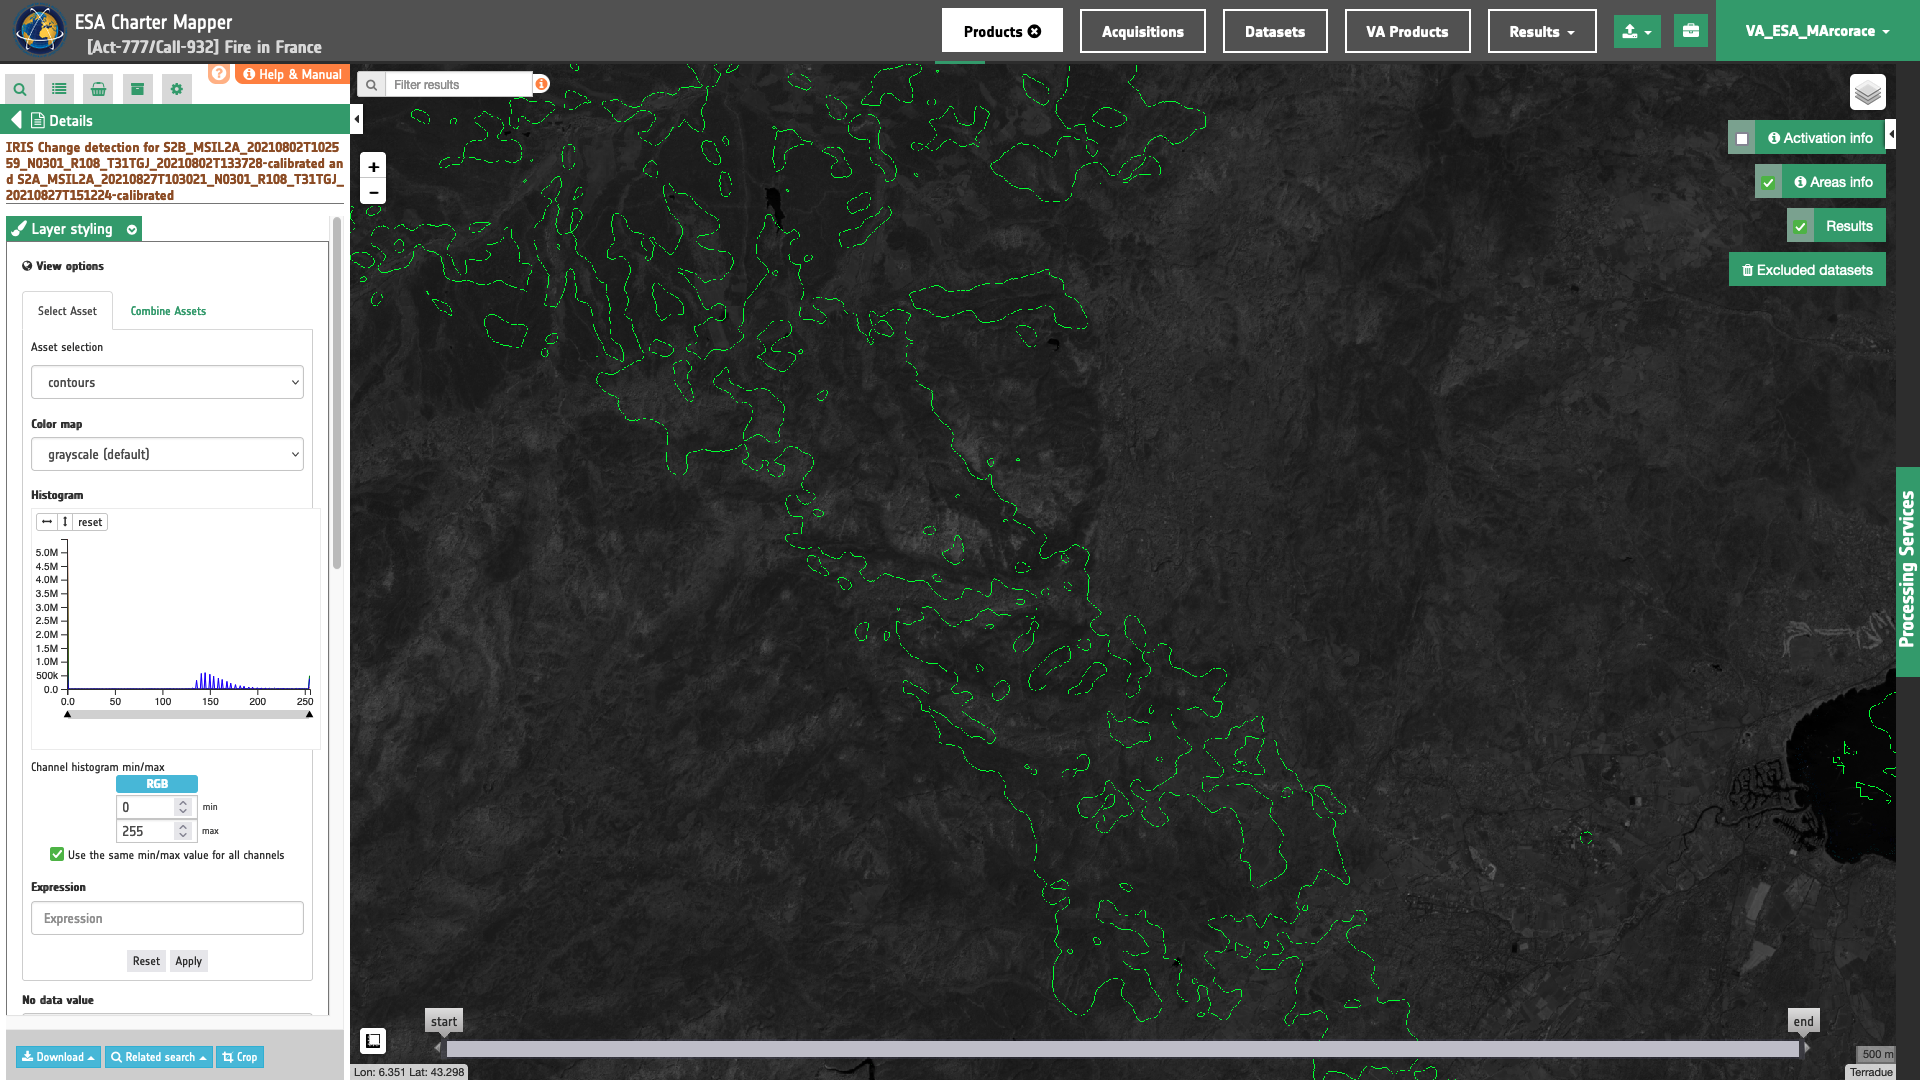
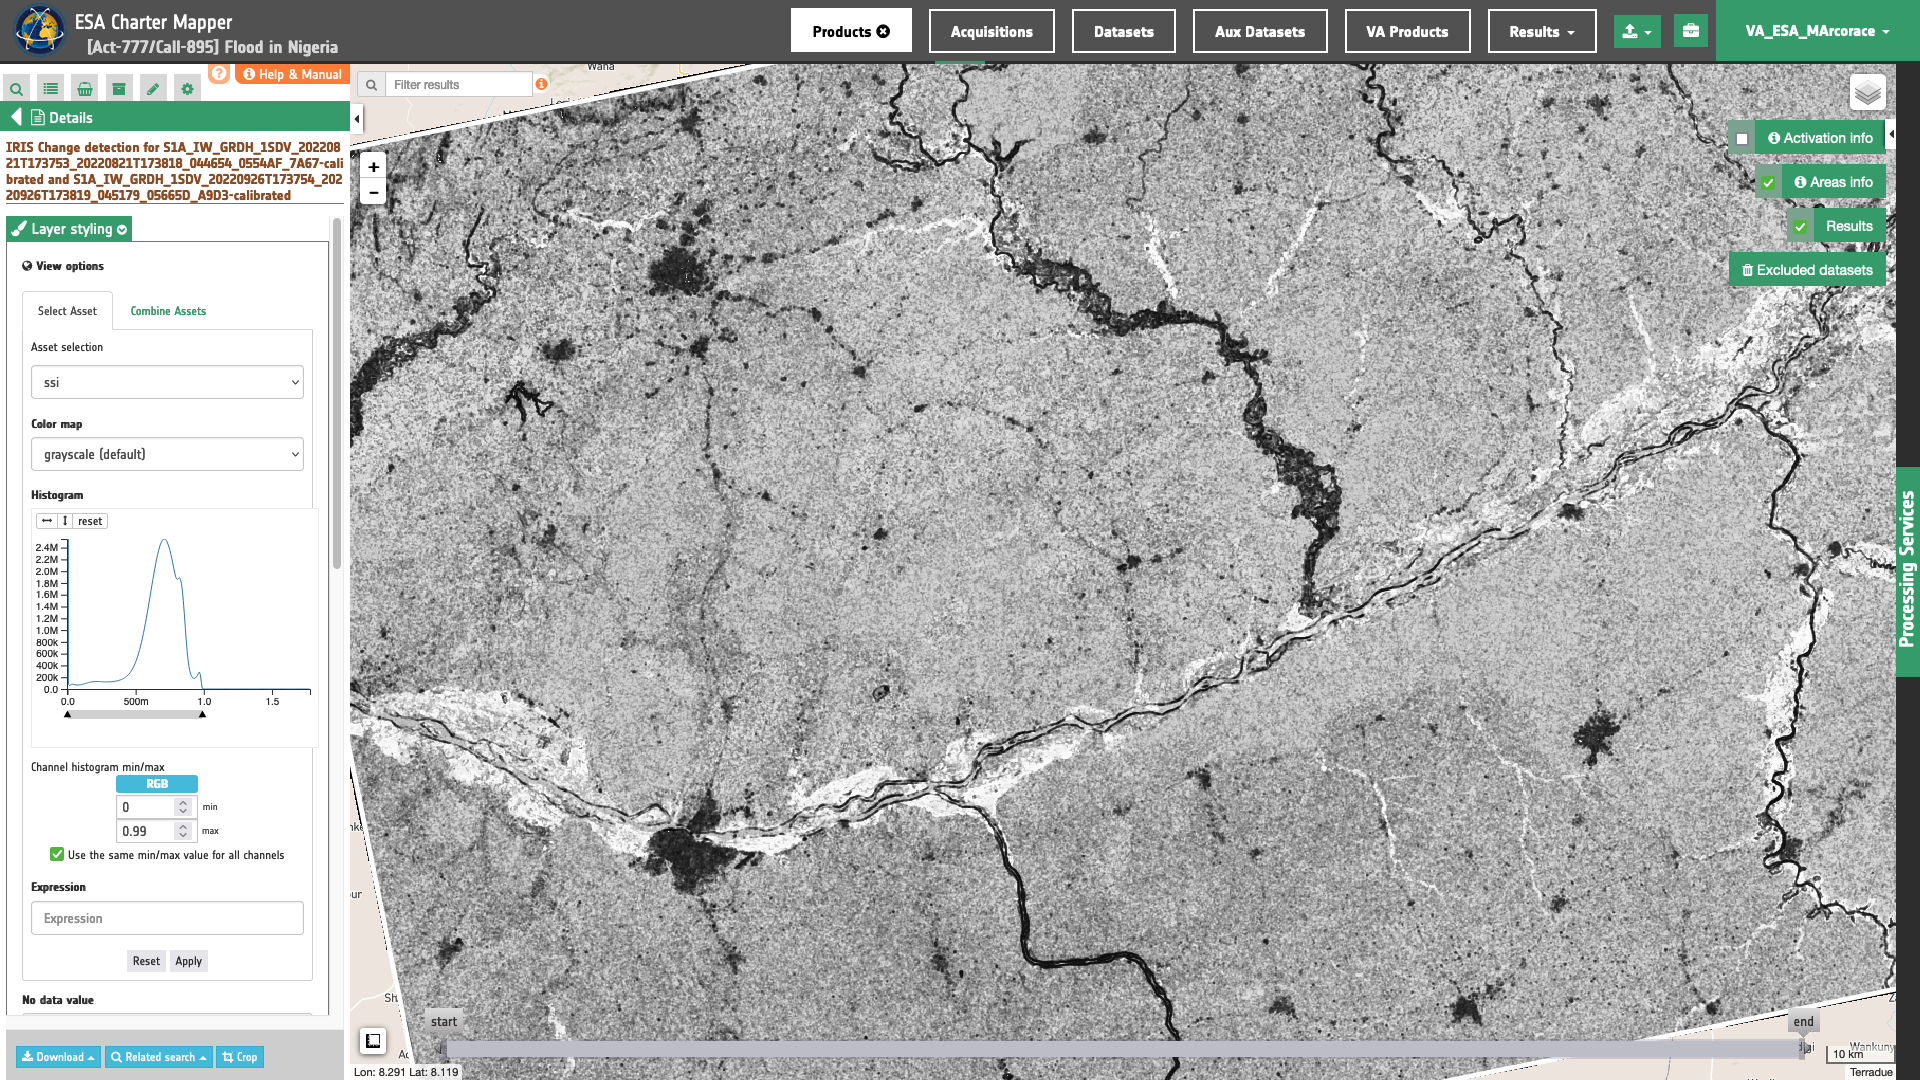
In the left panel under the result Details is possible to switch from the default asset to another one included into the IRIS results by clicking on Layer Styling and Select Assets. To visualize another asset on the map just select another asset:
ssi asset
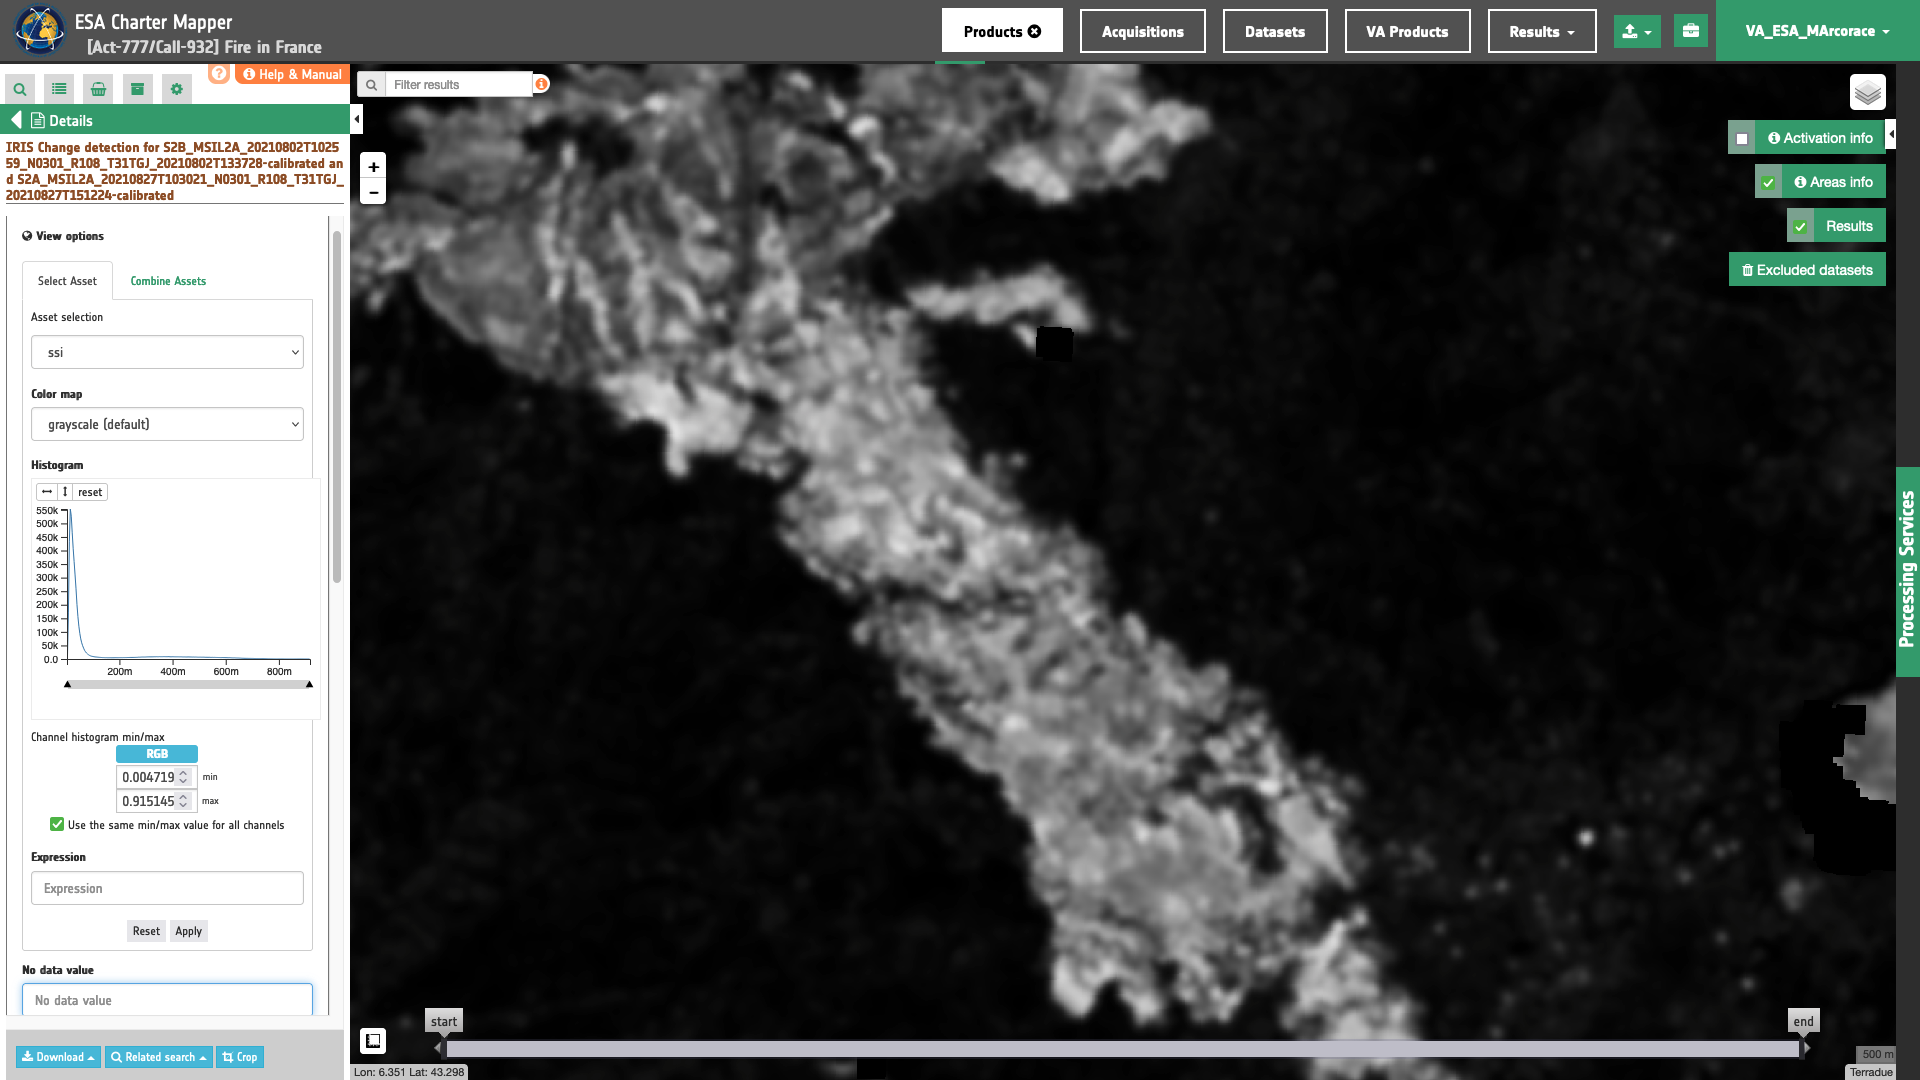
iris-change-mask asset
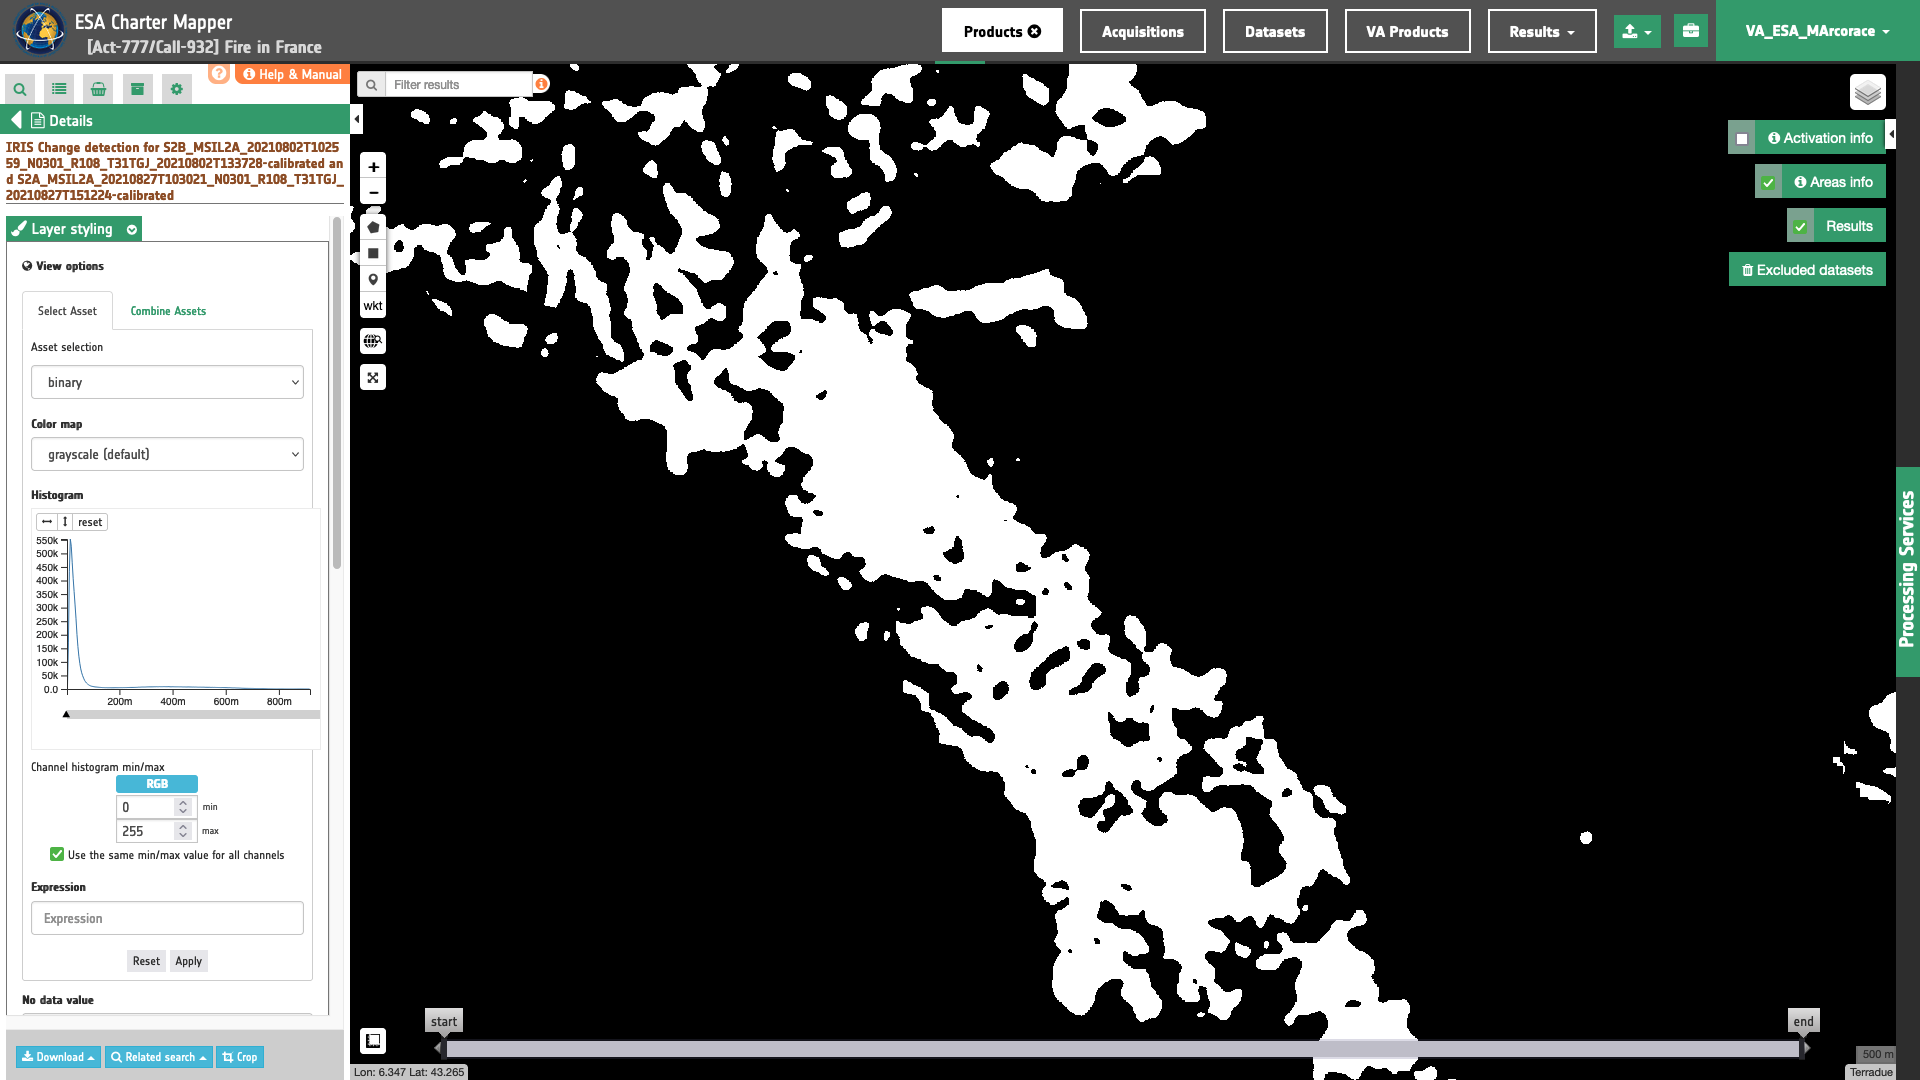
contours asset
In the left panel under the result Details is possible to create customized overview on the fly by clicking on Layer Styling and Combine Assets. As an example under Combine Assets you can create on the fly a Red-Cyan band composite by setting the nir_pre single-band asset in the RED channel, and the co-registered nir_post one in the GREEN and BLUE channels.
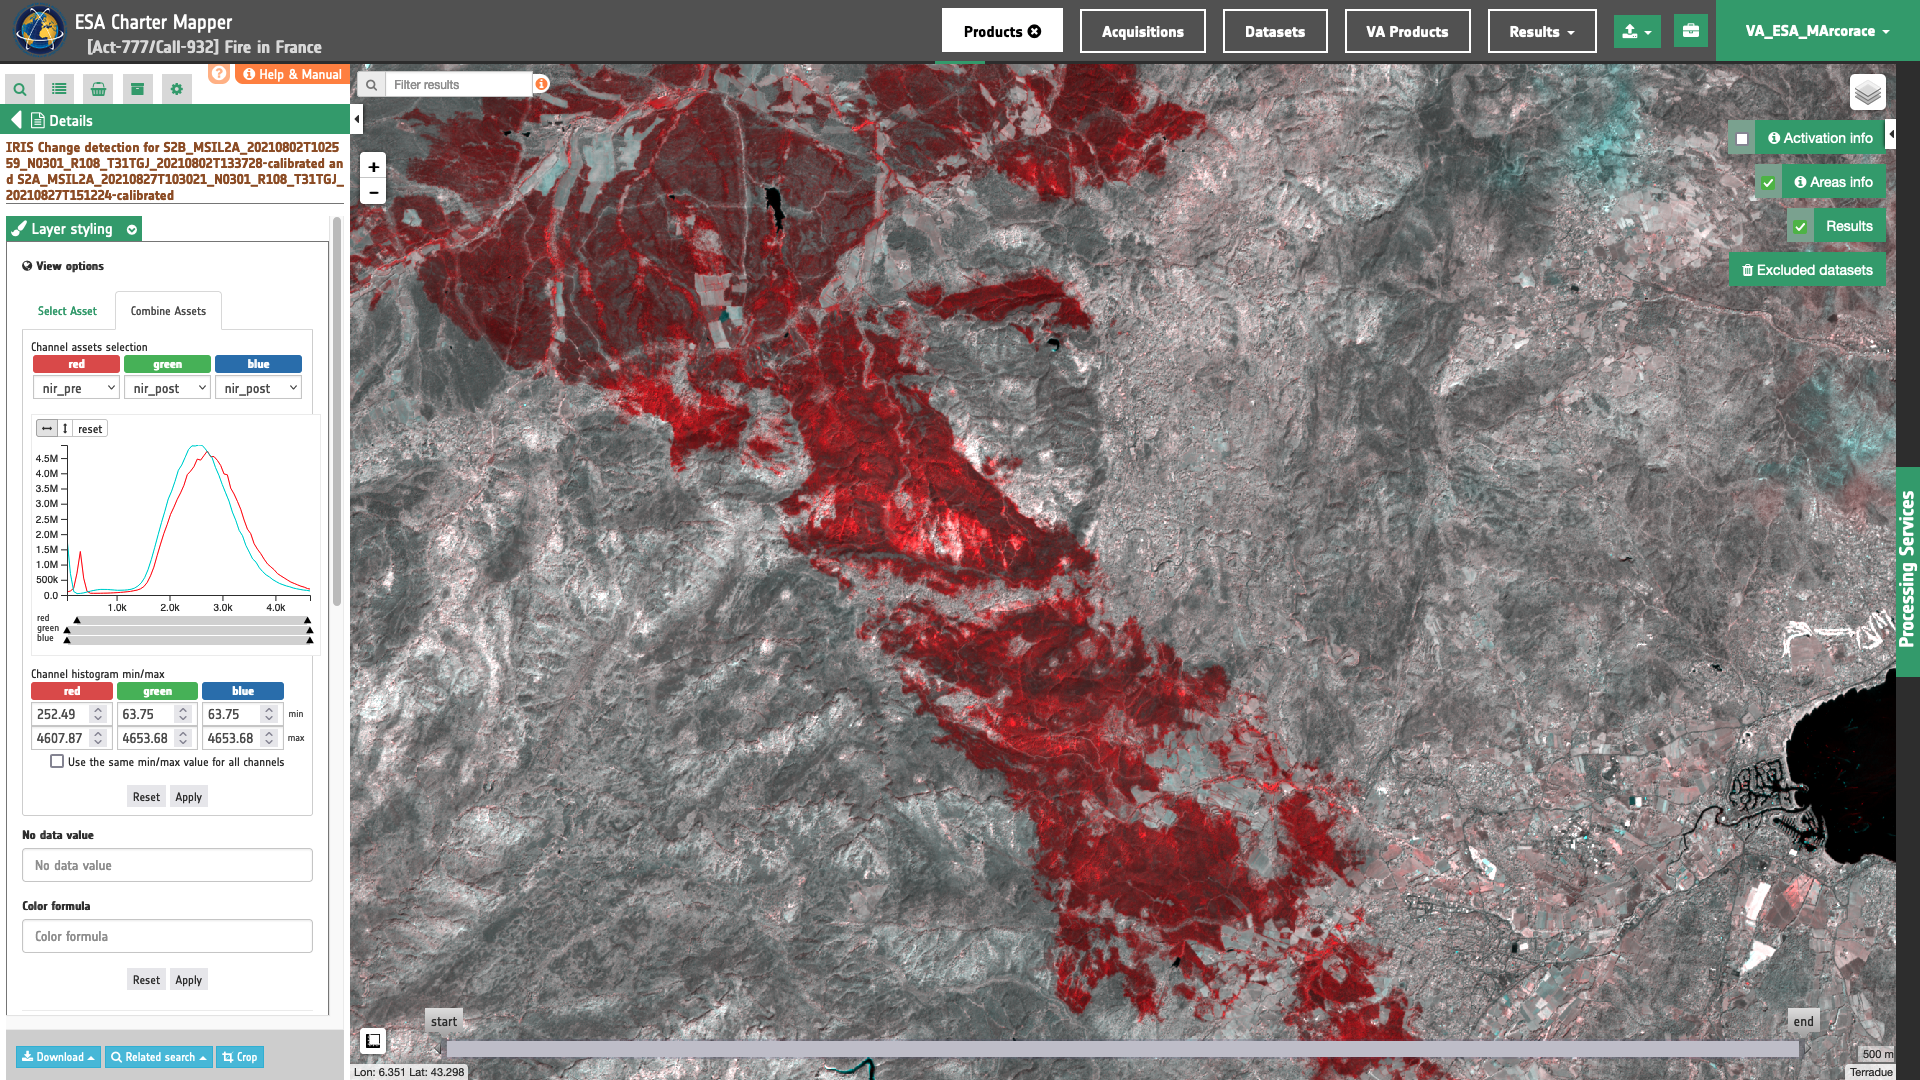
This Red-Cyan band composite highlights vegetation changes derived from Sentinel-2 data. In red is shown the loss of vegetation due to wildfires.
Download
In this first use case the Change Detection Analysis (IRIS) service offers the following products:
- nir_pre: single band asset product from pre-event
nirreflectance given as single band raster in COG format, - nir_post: single band asset product from post-event
nirreflectance given as single band raster in COG format, - ssi: single band asset for the SSI index given as single band raster in COG format,
- ssi-no-water: single band asset for the SSI index, after the masking of permanent waters, given as single band raster in COG format,
- overview-iris: default overview (RGBA) derived from the
ssiasset given as 4-band raster in COG format, - overview-iris-no-water: overview (RGBA) derived from the
ssiasset, after the masking of permanent waters, given as 4-band raster in COG format, - iris-change-mask: single band asset from thresholding of the SSI index given as UInt8 single band raster in COG format,
- iris-change-mask-no-water: single band asset from thresholding of the SSI index, after the masking of permanent waters, given as UInt8 single band raster in COG format,
- contours: overview (RGBA) showing the pre-event single band asset in gray scale and superimposed detected change contours in yellow given as 4-band raster in COG format,
- contours-no-water: overview (RGBA) showing the pre-event single band asset in gray scale and superimposed detected change contours in yellow, after the masking of permanent waters, given as 4-band raster in COG format.
These products can be downloaded by clicking on the Download button located at the bottom of the Product Details tab in the left panel.
Use case 2: change detection analysis using a pair of backscatter single band assets from the same mission
Abstract
This second use case explains how to make change detection analysis with IRIS using a pair of co-pol Sigma Nought single band assets from Radar Calibrated Datasets acquired by the same sensor before and after a flood event.
Find the data using multiple filter criteria
Select the area for which you want to do an analysis, e.g over Makurdi, Nigeria. From the Navigation and Search toolbar (located in the upper left side of the map), click on the Spatial Filter and draw a square AOI over Makurdi area along the Benue river, Nigeria. This spatial filter allows you to select only the EO data acquired over this area.
Now it is possible to choose a pair of pre- and post-event reflectance images from Radar Calibrated Datasets to be used for the change detection analysis. This pair must come from the same sensor.
From the top of the left panel, use Filter Criteria to search for Radar and sentinel-1 data collections from the list.
In this example the selected pair of calibrated datasets are:
-
Pre-event calibrated dataset: [CD] SENTINEL-1A GRD IW VV/VH 132 2022-08-21 17:37:53
-
Post-event calibrated dataset: [CD] SENTINEL-1A GRD IW VV/VH 132 2022-09-26 17:37:54
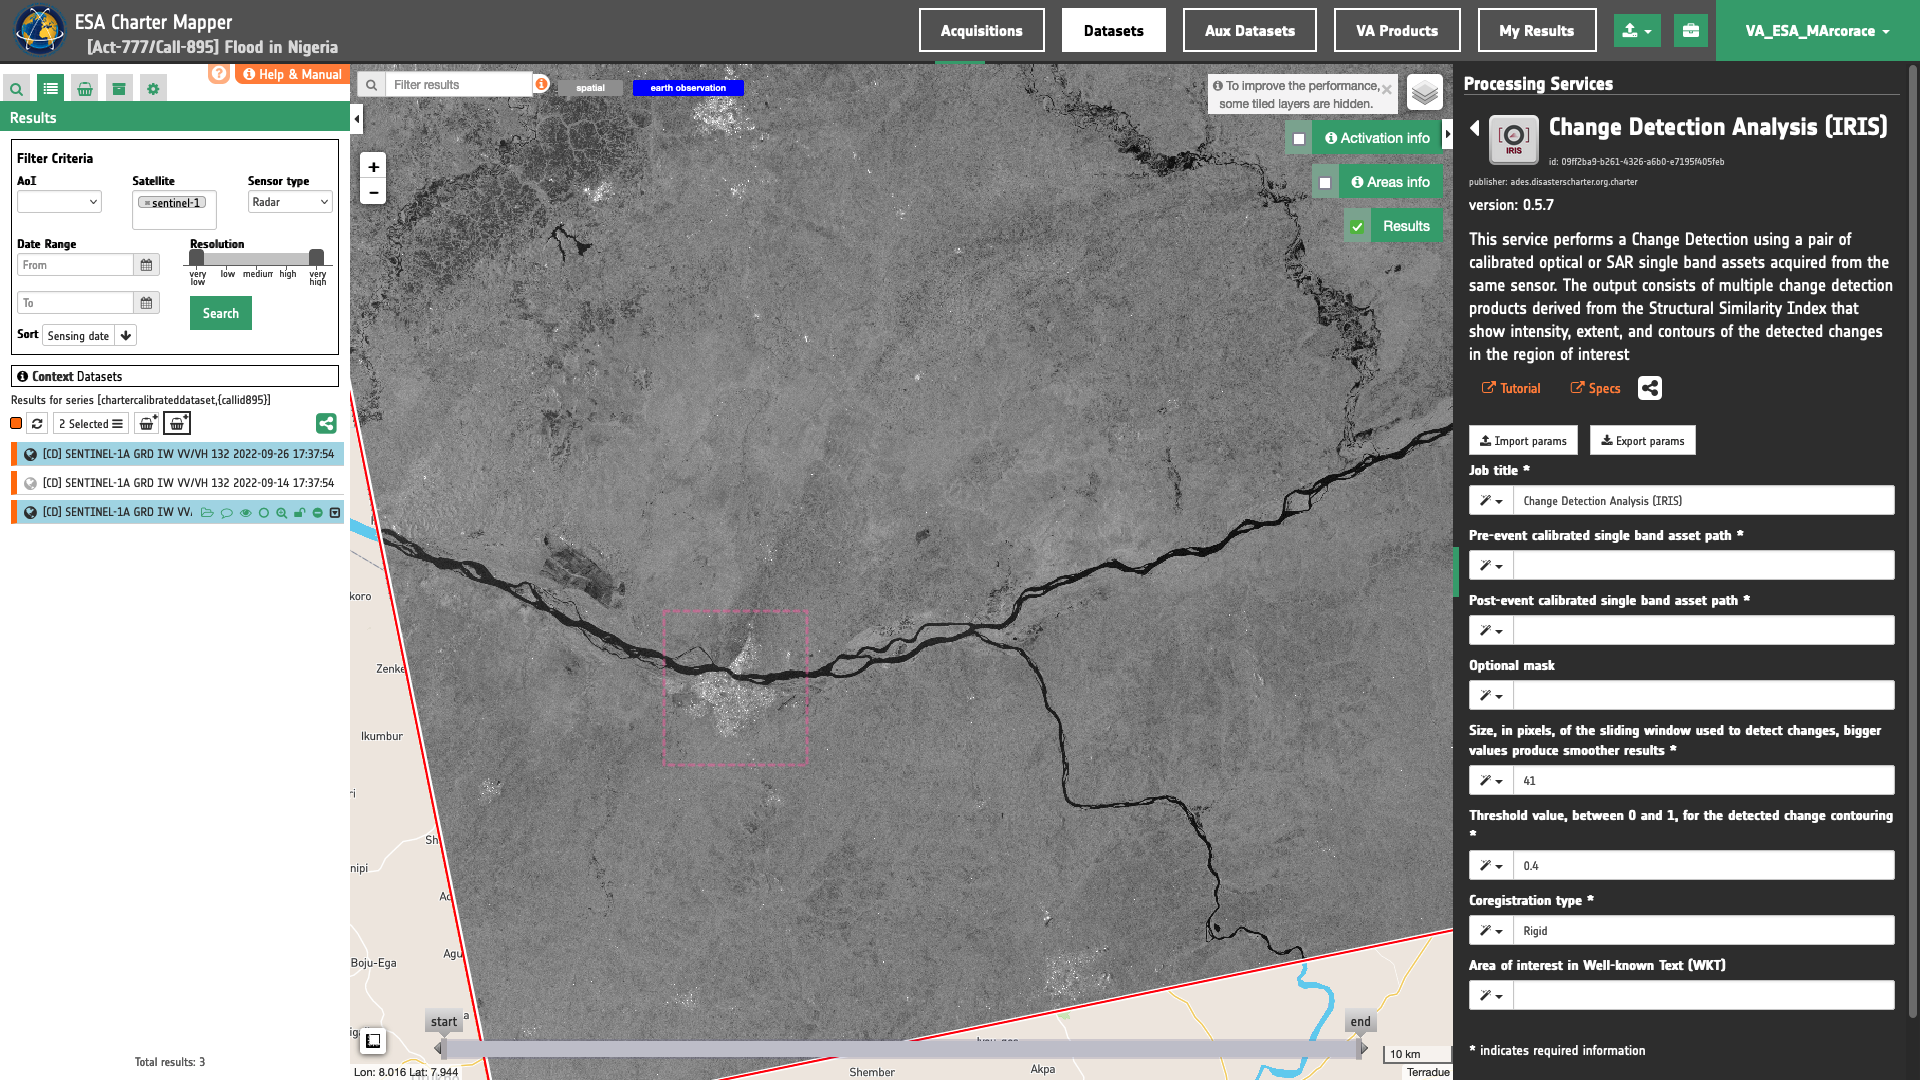
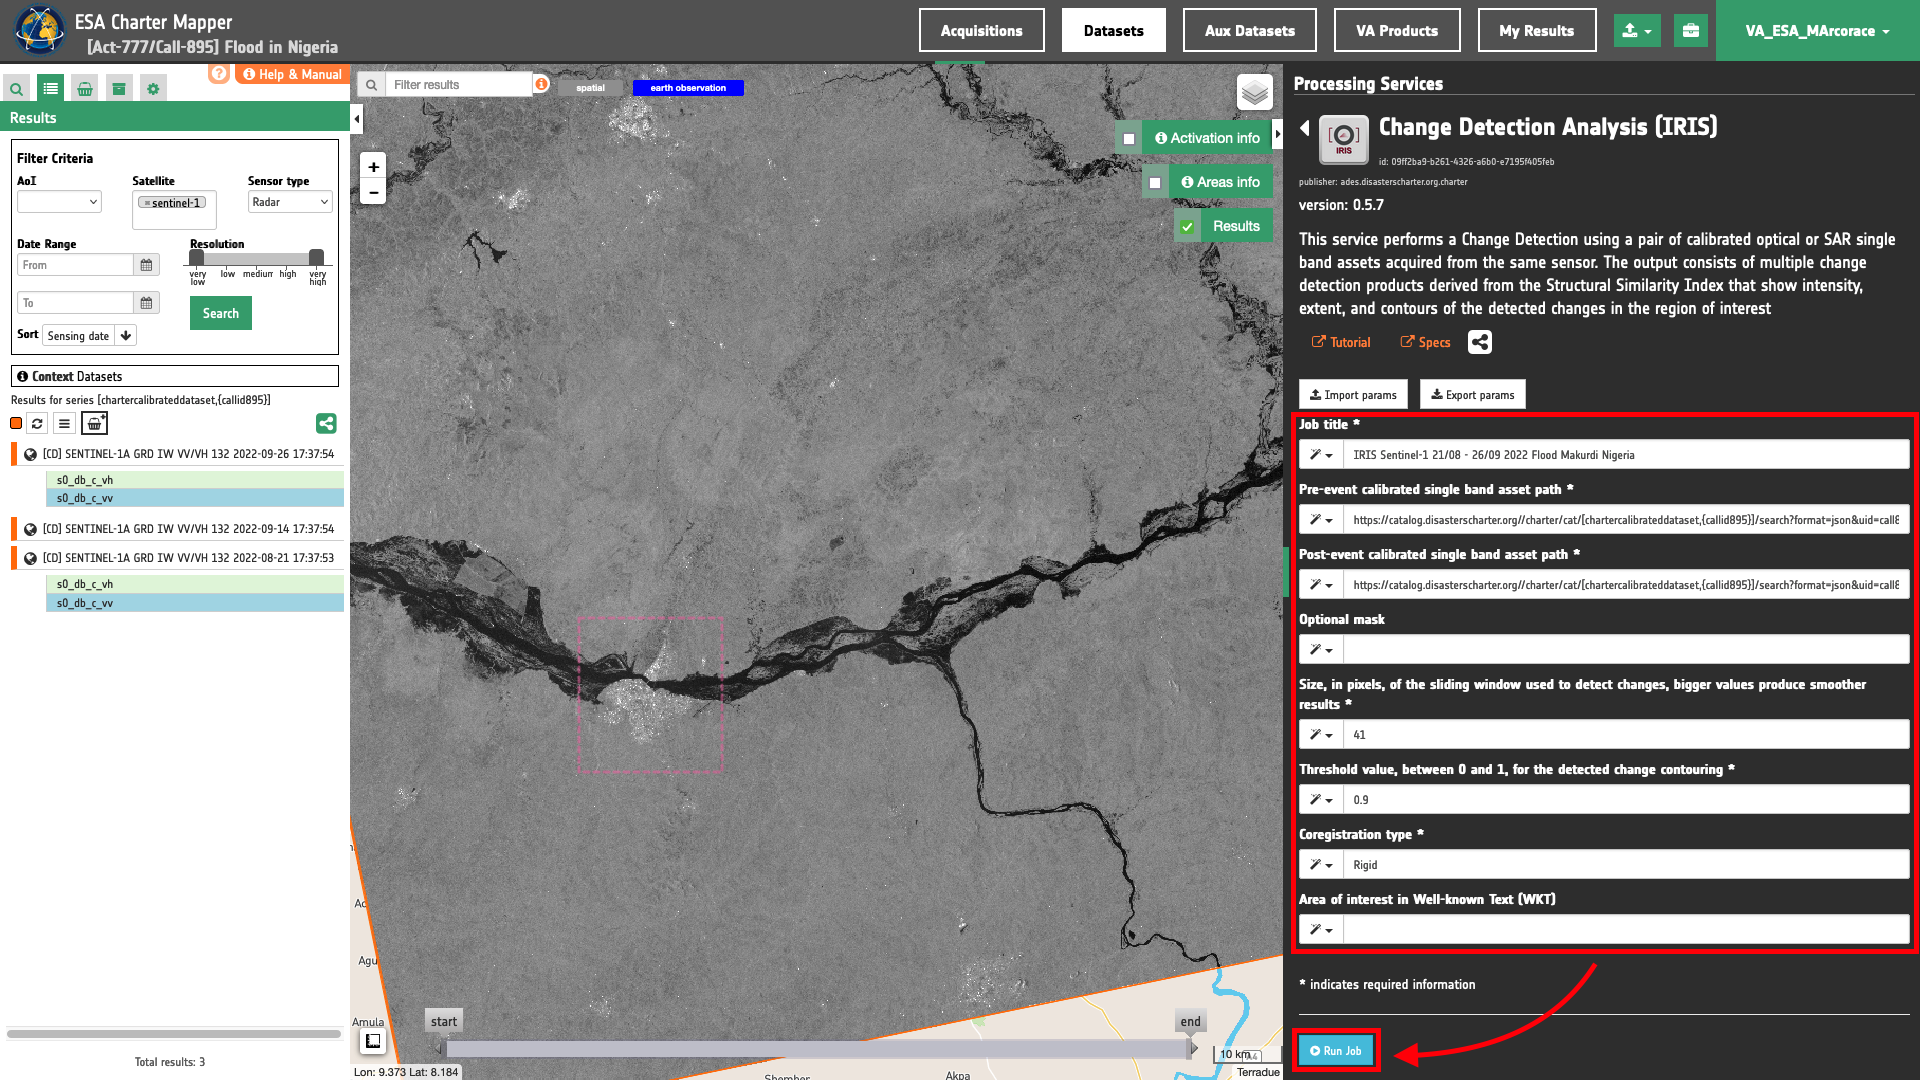
Fill the parameters
After the definition of spatial and time filters, you can employ IRIS, by using a suitable pair of Calibrated Datasets from Sentinel-1 data.
To do so you can fill the parameters as described in the following sections.
Job name
- Insert as job name:
IRIS Sentinel-1 21/08 - 26/09 2022 Flood Makurdi Nigeria
Input pair of single-band geophysical assets
First two mandatory parameters are input "Reference" and "Secondary" single band assets from Optical or Radar Calibrated Datasets, or Results from on-demand processing. This parameter is required to specify both the reference to the Calibrated Dataset and the single band asset (e.g. s0_db_c_vv) to be used for the change detection analysis.
Hint
To consults the bands of a Calibrated Dataset just Click on Show assets button available near the feature title. After the click a list with all single-band assets (CBNs) included within the Calibrated Dataset will appear under the feature title.
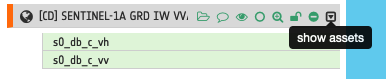
Thus, drag and Drop the selected assets:
-
single band backscatter asset from a pre-event Calibrated Dataset for CBN =
s0_db_c_vv -
single band backscatter asset from a post-event Calibrated Dataset for CBN =
s0_db_c_vv
in the Pre-event single band asset and Post-event single band asset fields respectively.
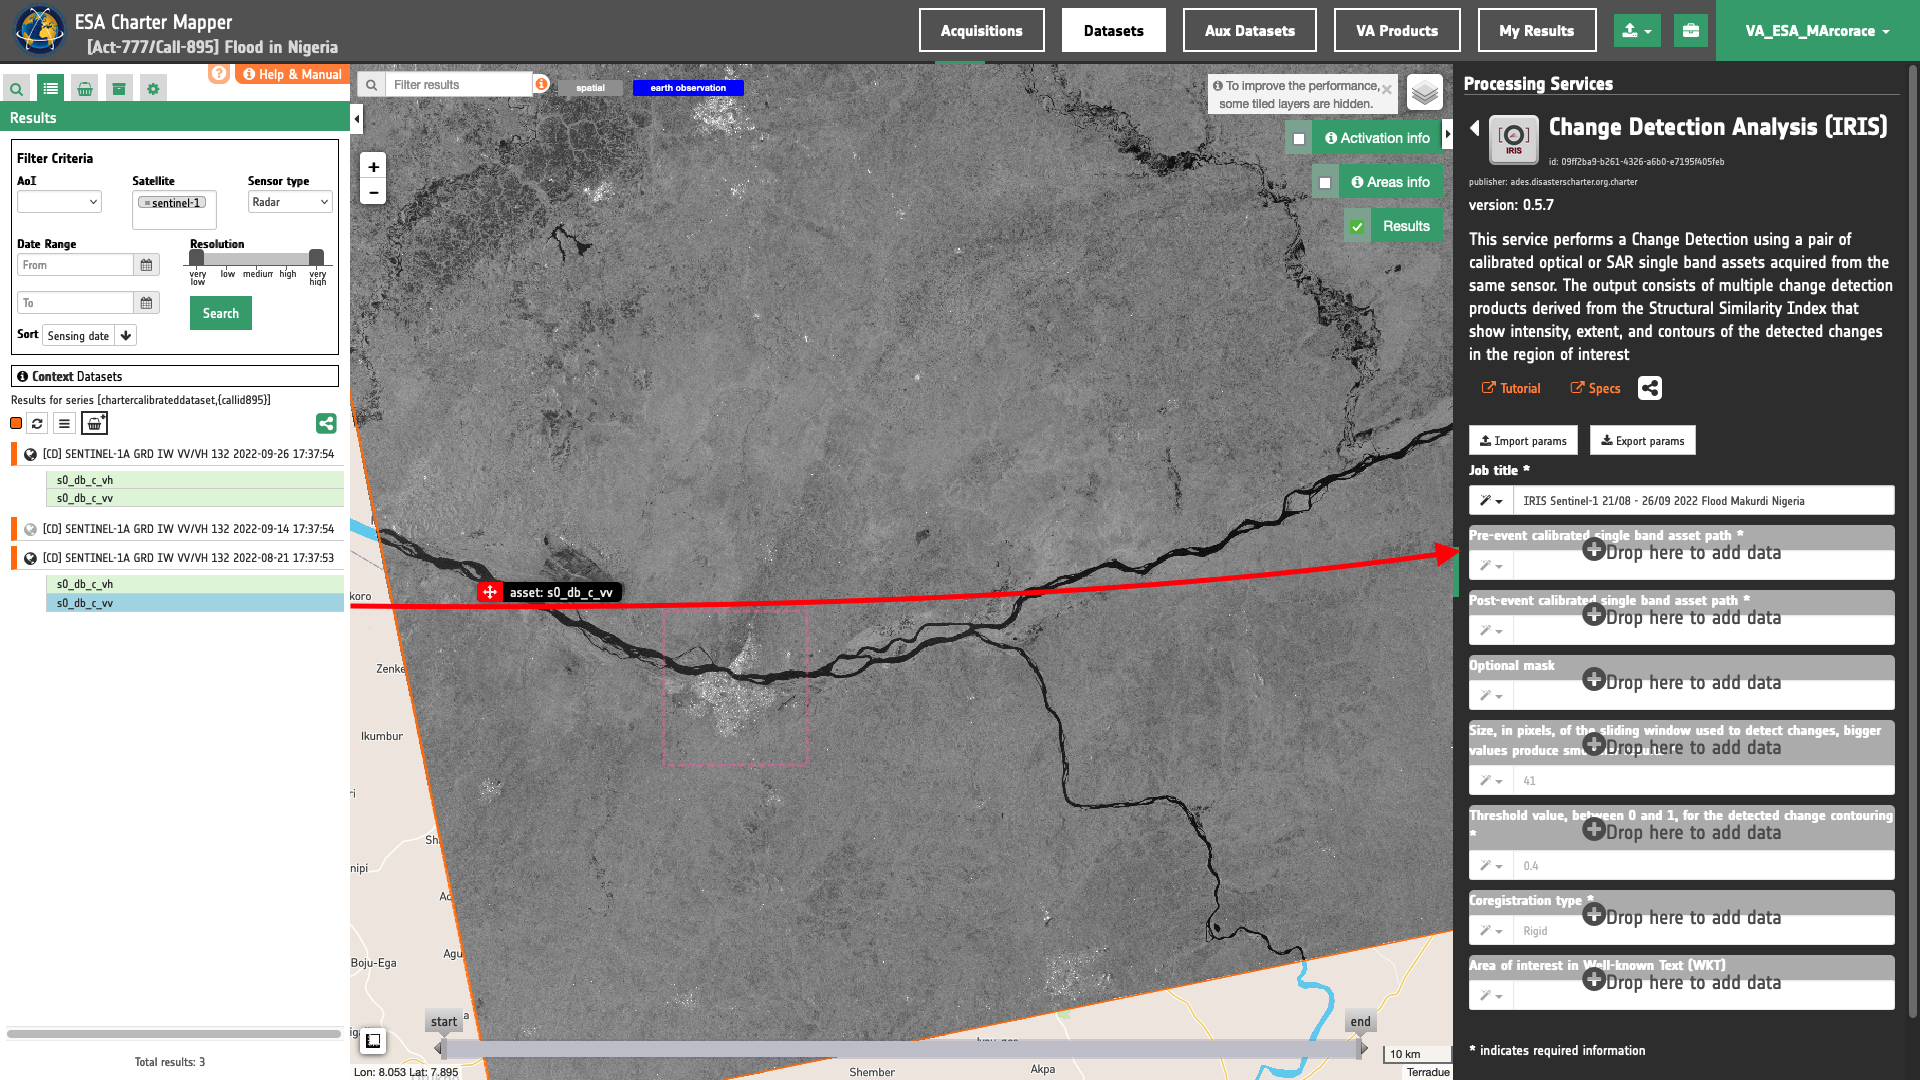
Warning
Users must drag and drop the single-band asset (e.g. s0_db_c_vv) into both Pre-event calibrated single band asset and Post-event calibrated single band asset fields. The drag and drop of the Calibrated Dataset (e.g. [CD] SENTINEL-1A GRD IW VV/VH 132 2022-08-21 17:37:53) is not enough.
Window size
Insert as a value for the window size the value of 41.
Threshold
Insert as a threshold the value of 0.9. This value will be used by the processor in the binarization of SSI to estimate the binary change mask and generate the contours overview.
Co-registration method
In this mandatory parameter the user shall choose the co-registration method to employ. Under Co-registration type a list of selectable options are available. Find specifications of each option here. Insert, for example, the default value Rigid to employ a rigid co-registration of secondary and reference input assets. The full-field displacement measured is used to estimate an Affine transformation matrix which is then applied to the secondary image.
Run the job
Click on the button Run Job and see the Running Job. You can monitor job progress through the progress bar.
Results: download and visualization
Once the job is completed, click on the Show results button located at the bottom of the processing service panel.
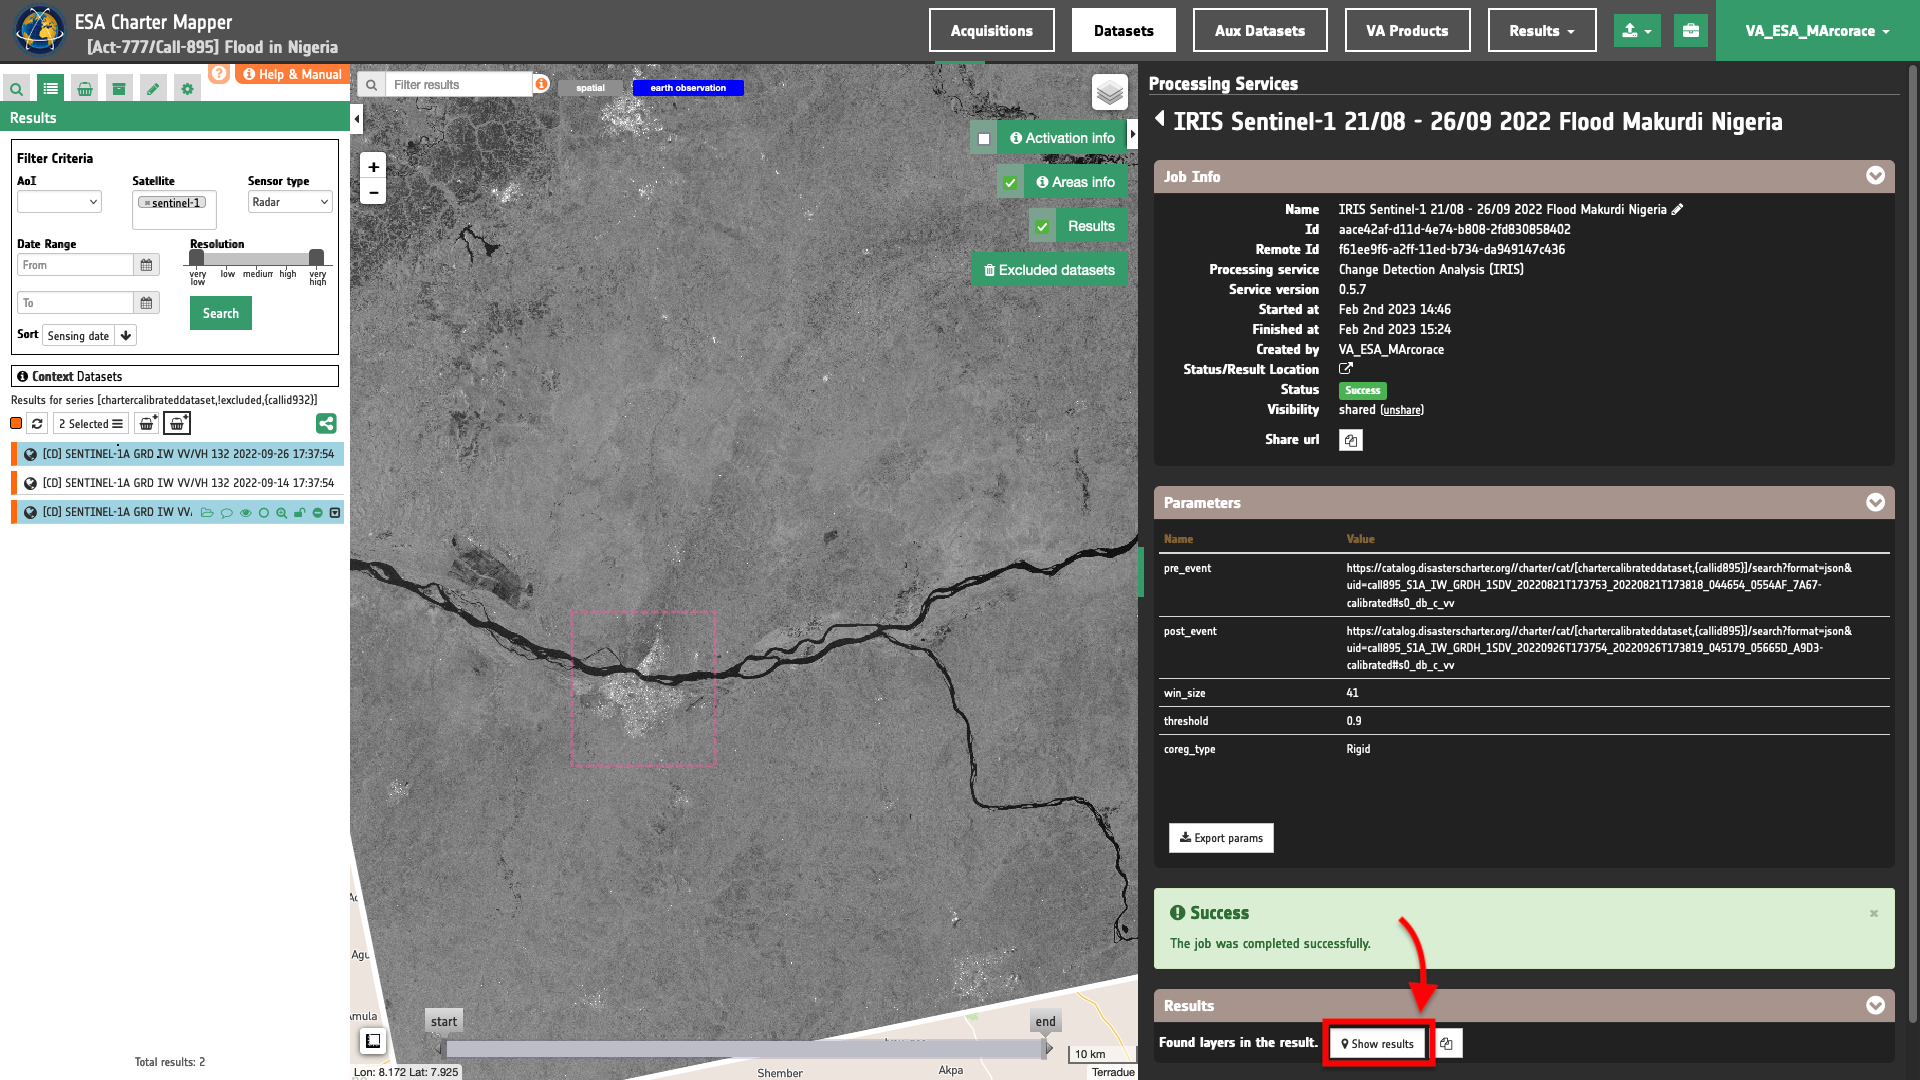
Tip
You can also save the parameters employed in this job by clicking on the Export params button in the right panel. This allows you to copy all your entries to the clipboard. This is meant to be used for a quick re-submission of a similar job after a fine tuning of the parameters (e.g. to add a color formula later).
Below is reported the syntax which includes all the parameters employed in this example.
{
   "pre_event": "https://catalog.disasterscharter.org//charter/cat/[chartercalibrateddataset,{callid895}]/search?format=json&uid=call895_S1A_IW_GRDH_1SDV_20220821T173753_20220821T173818_044654_0554AF_7A67-calibrated#s0_db_c_vv",
   "post_event": "https://catalog.disasterscharter.org//charter/cat/[chartercalibrateddataset,{callid895}]/search?format=json&uid=call895_S1A_IW_GRDH_1SDV_20220926T173754_20220926T173819_045179_05665D_A9D3-calibrated#s0_db_c_vv",
   "win_size": "41",
   "threshold": "0.9",
   "coreg_type": "Rigid"
}
Visualization
See the result on the map. The preview appears within the area defined in the spatial filter.
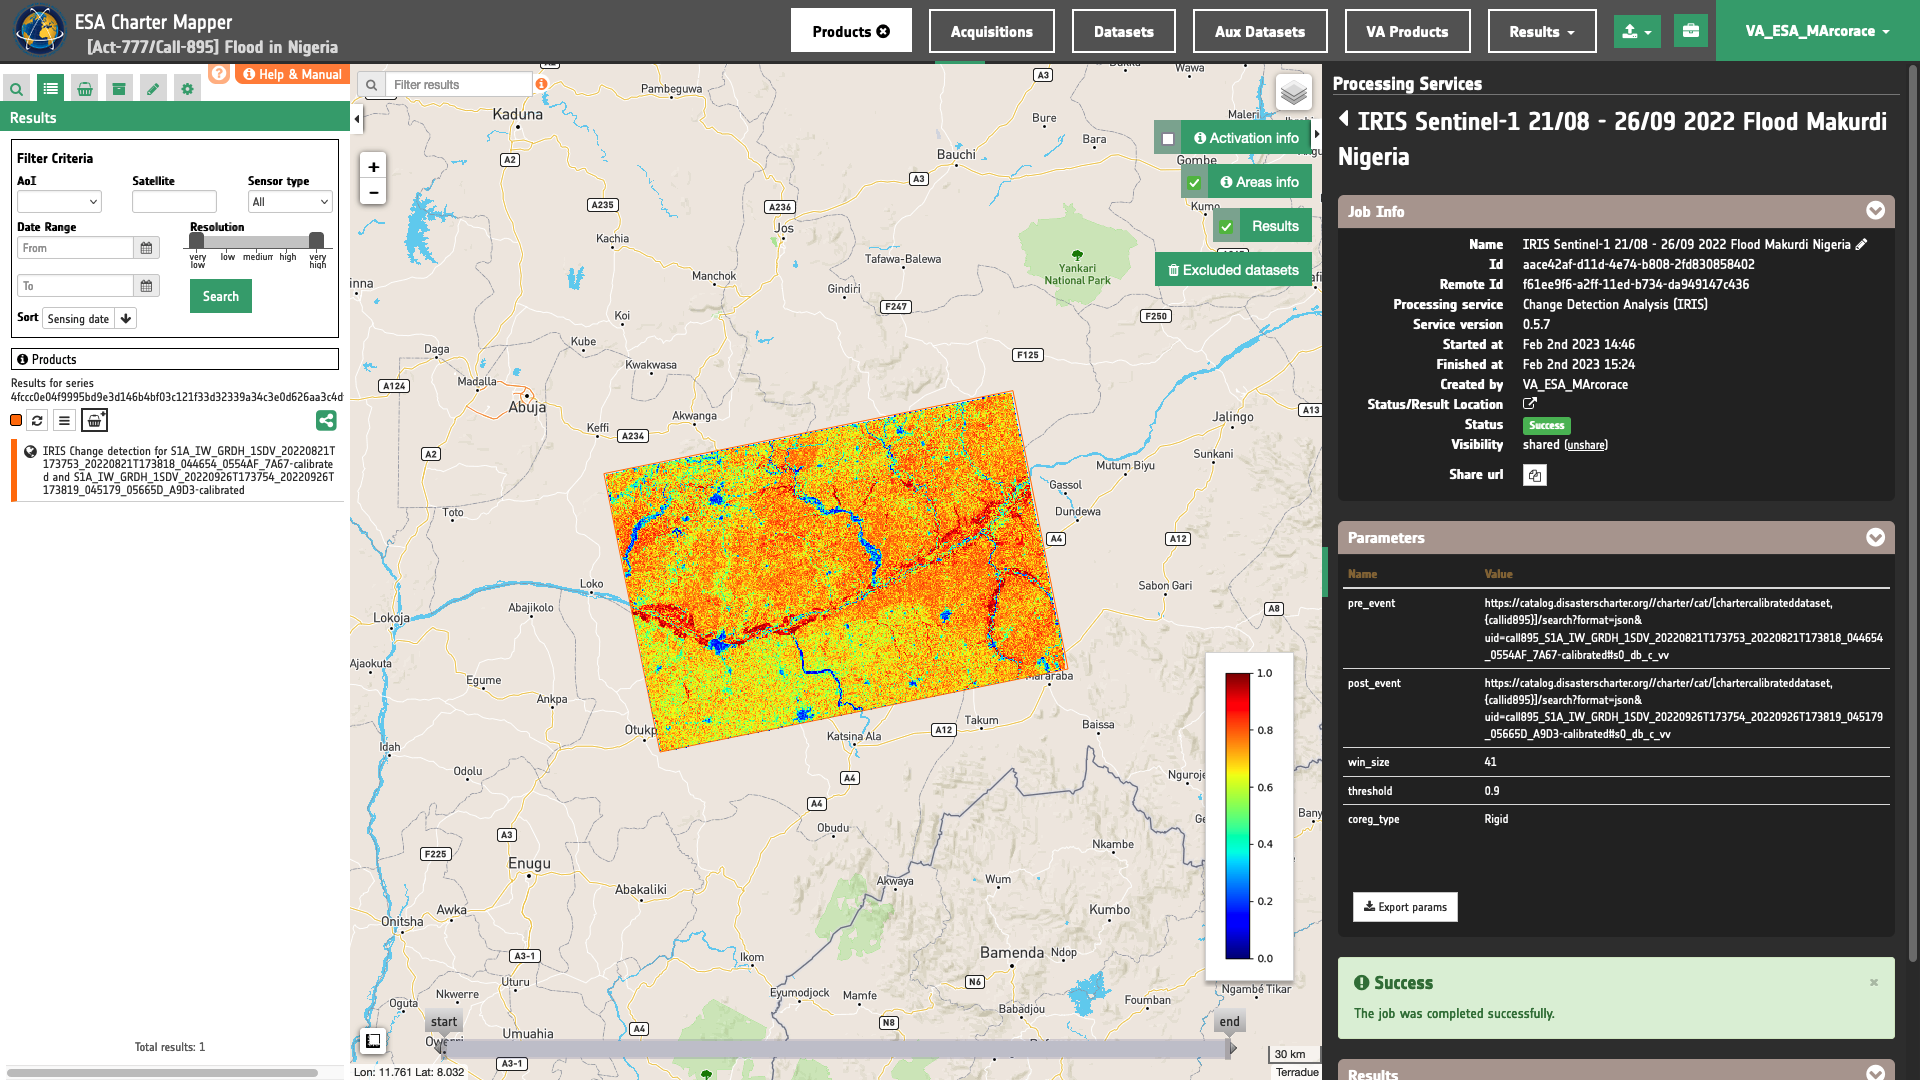
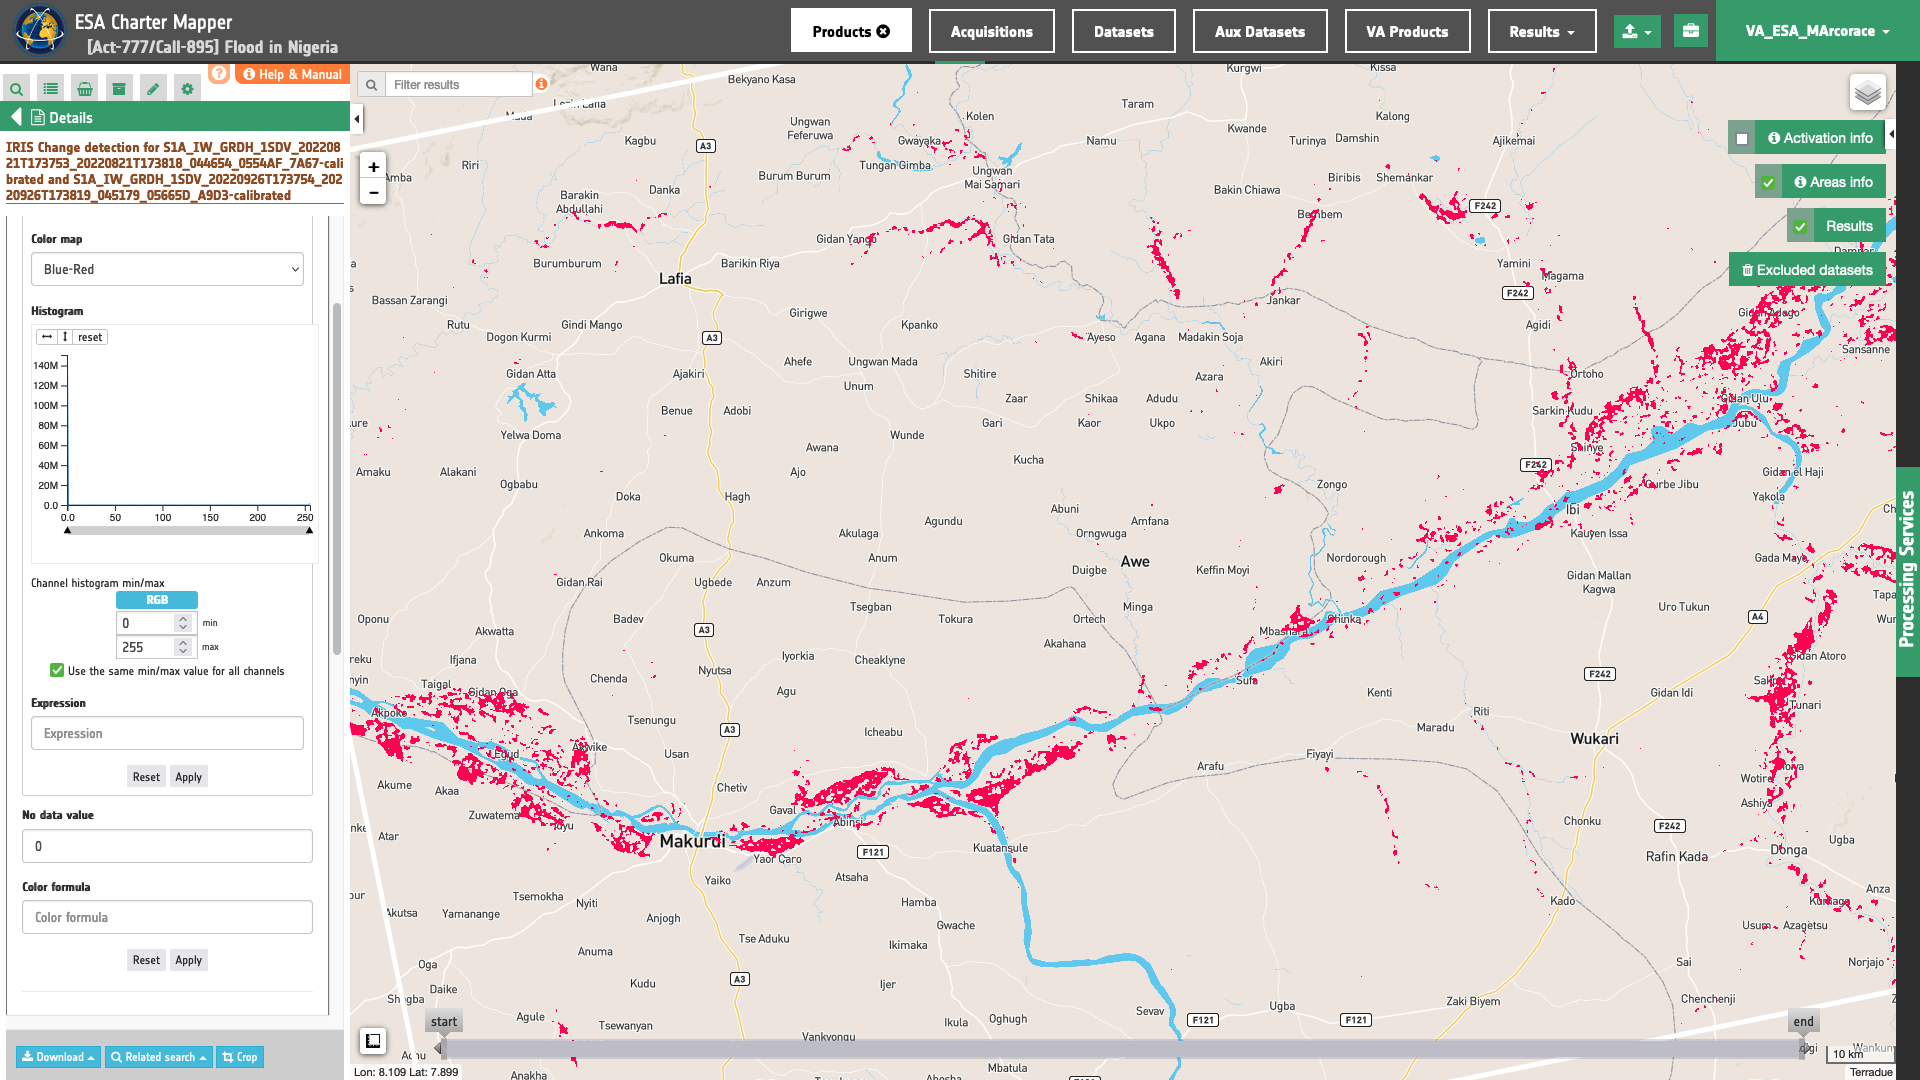
To get more information about the product just click on the preview in the map, a bubble showing the name of the layer IRIS Change detection for S1A_IW_GRDH_1SDV_20220821T173753_20220821T173818_044654_0554AF_7A67-calibrated and S1A_IW_GRDH_1SDV_20220926T173754_20220926T173819_045179_05665D_A9D3-calibrated will appear and then click on the Show details button.
Tip
To quickly access Product Details double click on the layer from the Results list.
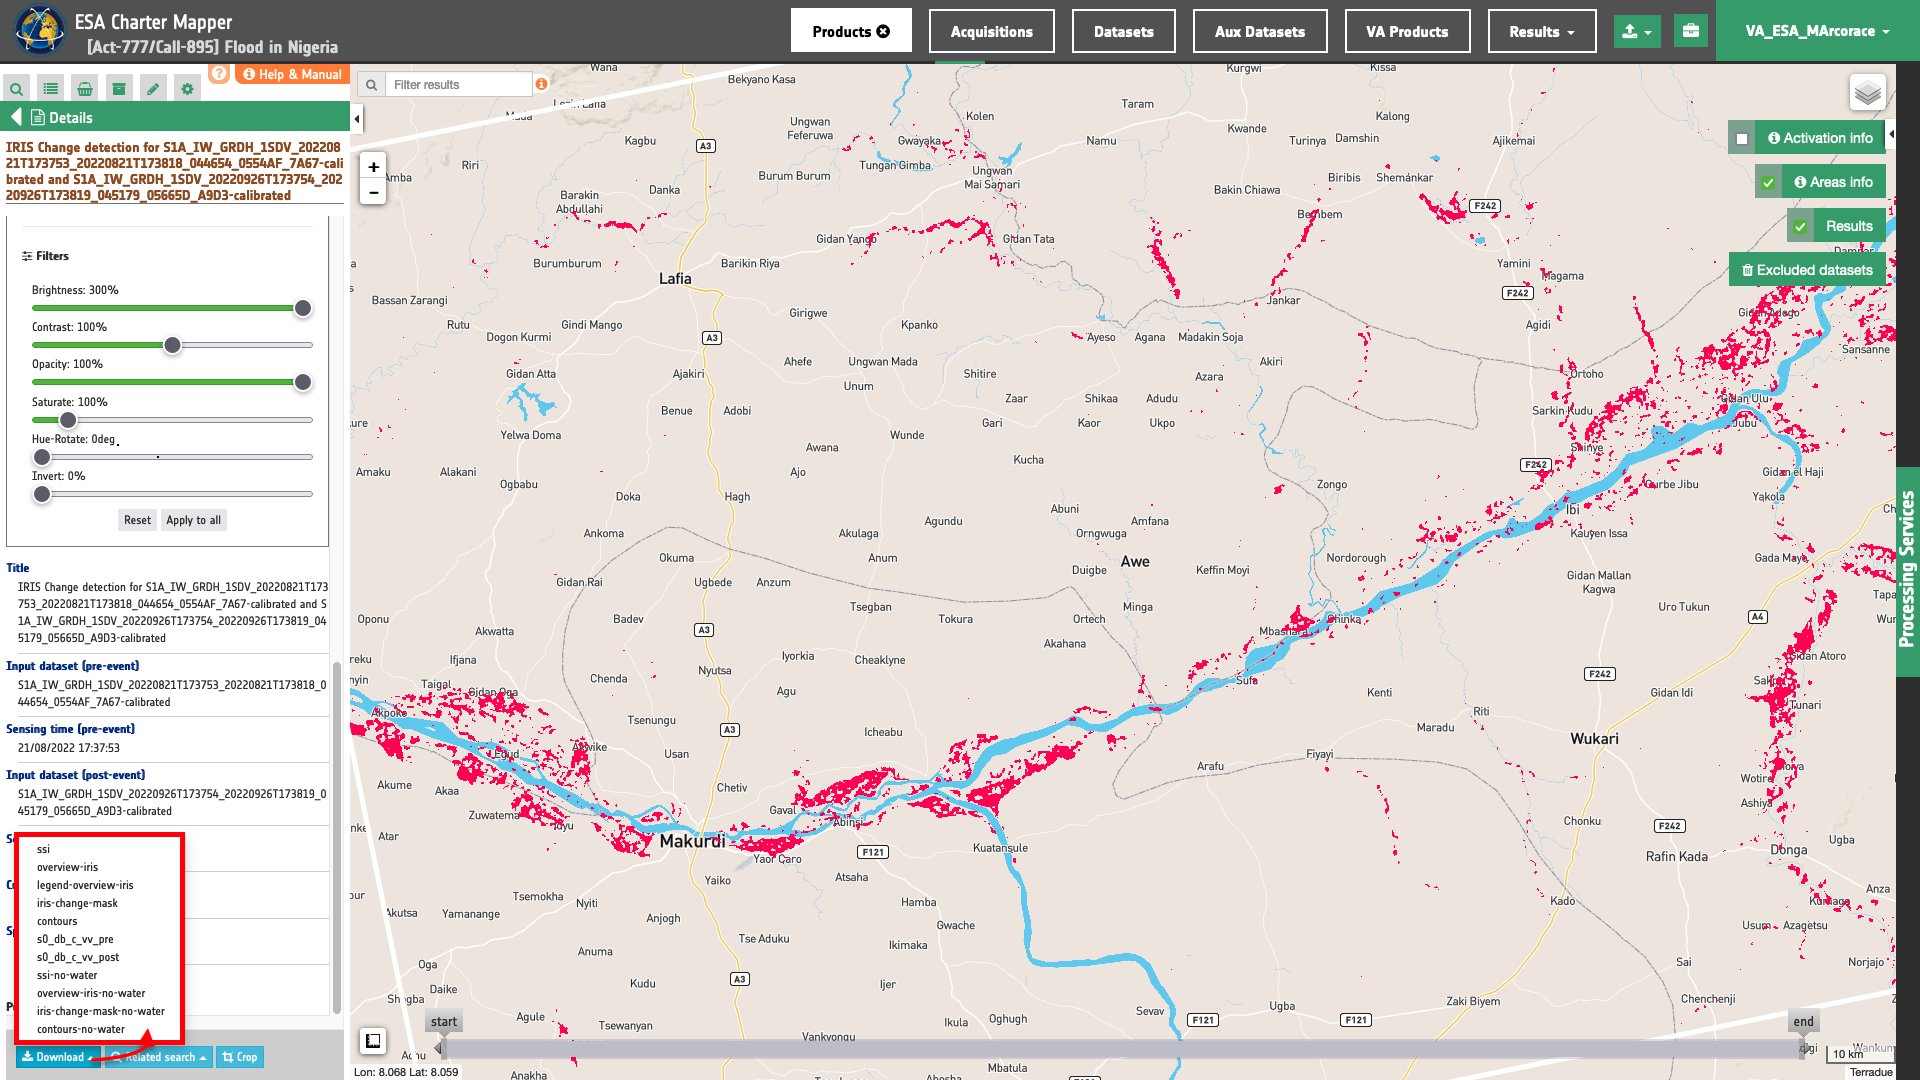
In the left panel of the interface, the details of Job Result will appear with Product metadata. Furthermore by clicking on Layer styling you can also access to the View options.
In here it is possible to see histogram/s of the Product which is visible in the map, set color formula, change Filters (e.g. Brightness, Opacity).
overview-iris asset
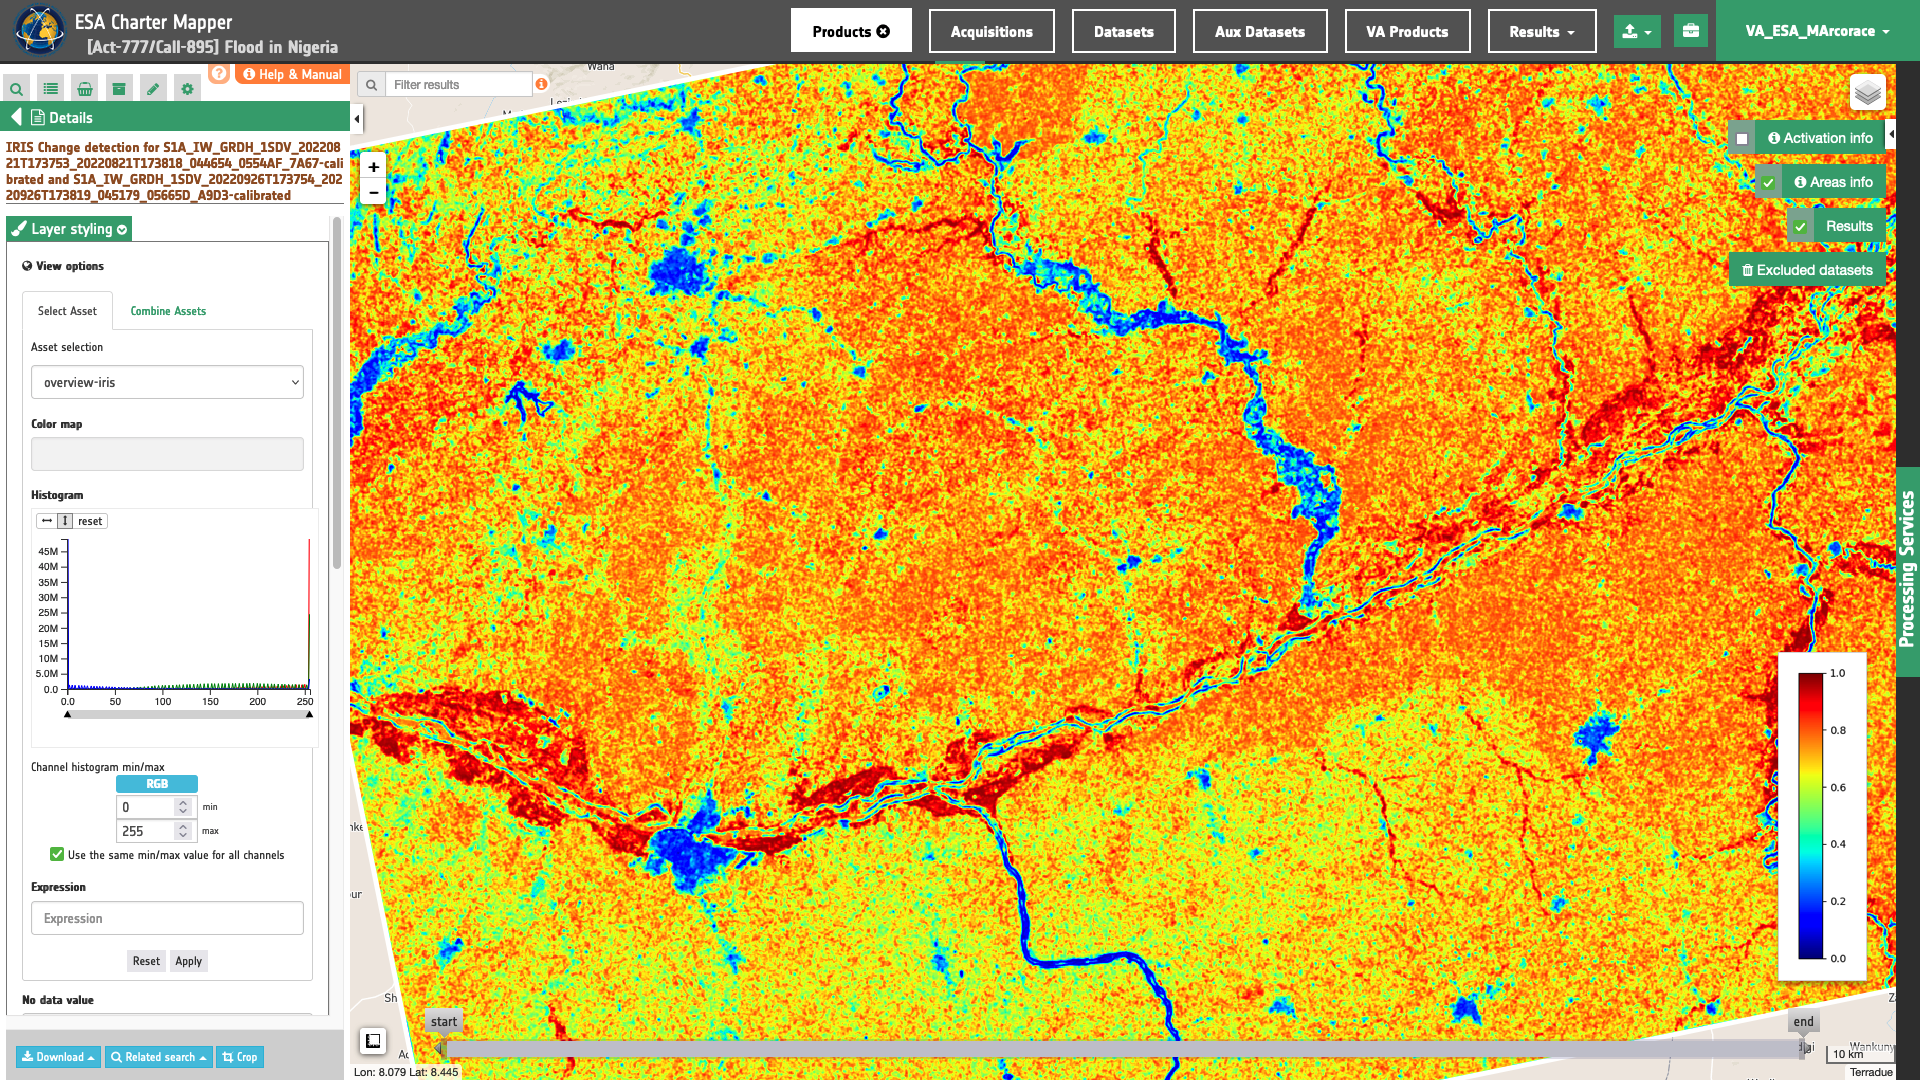
In the left panel under the result Details is possible to switch from the default asset to another one included into the IRIS results by clicking on Layer Styling and Select Assets. To visualize another asset on the map just select another asset:
ssi asset
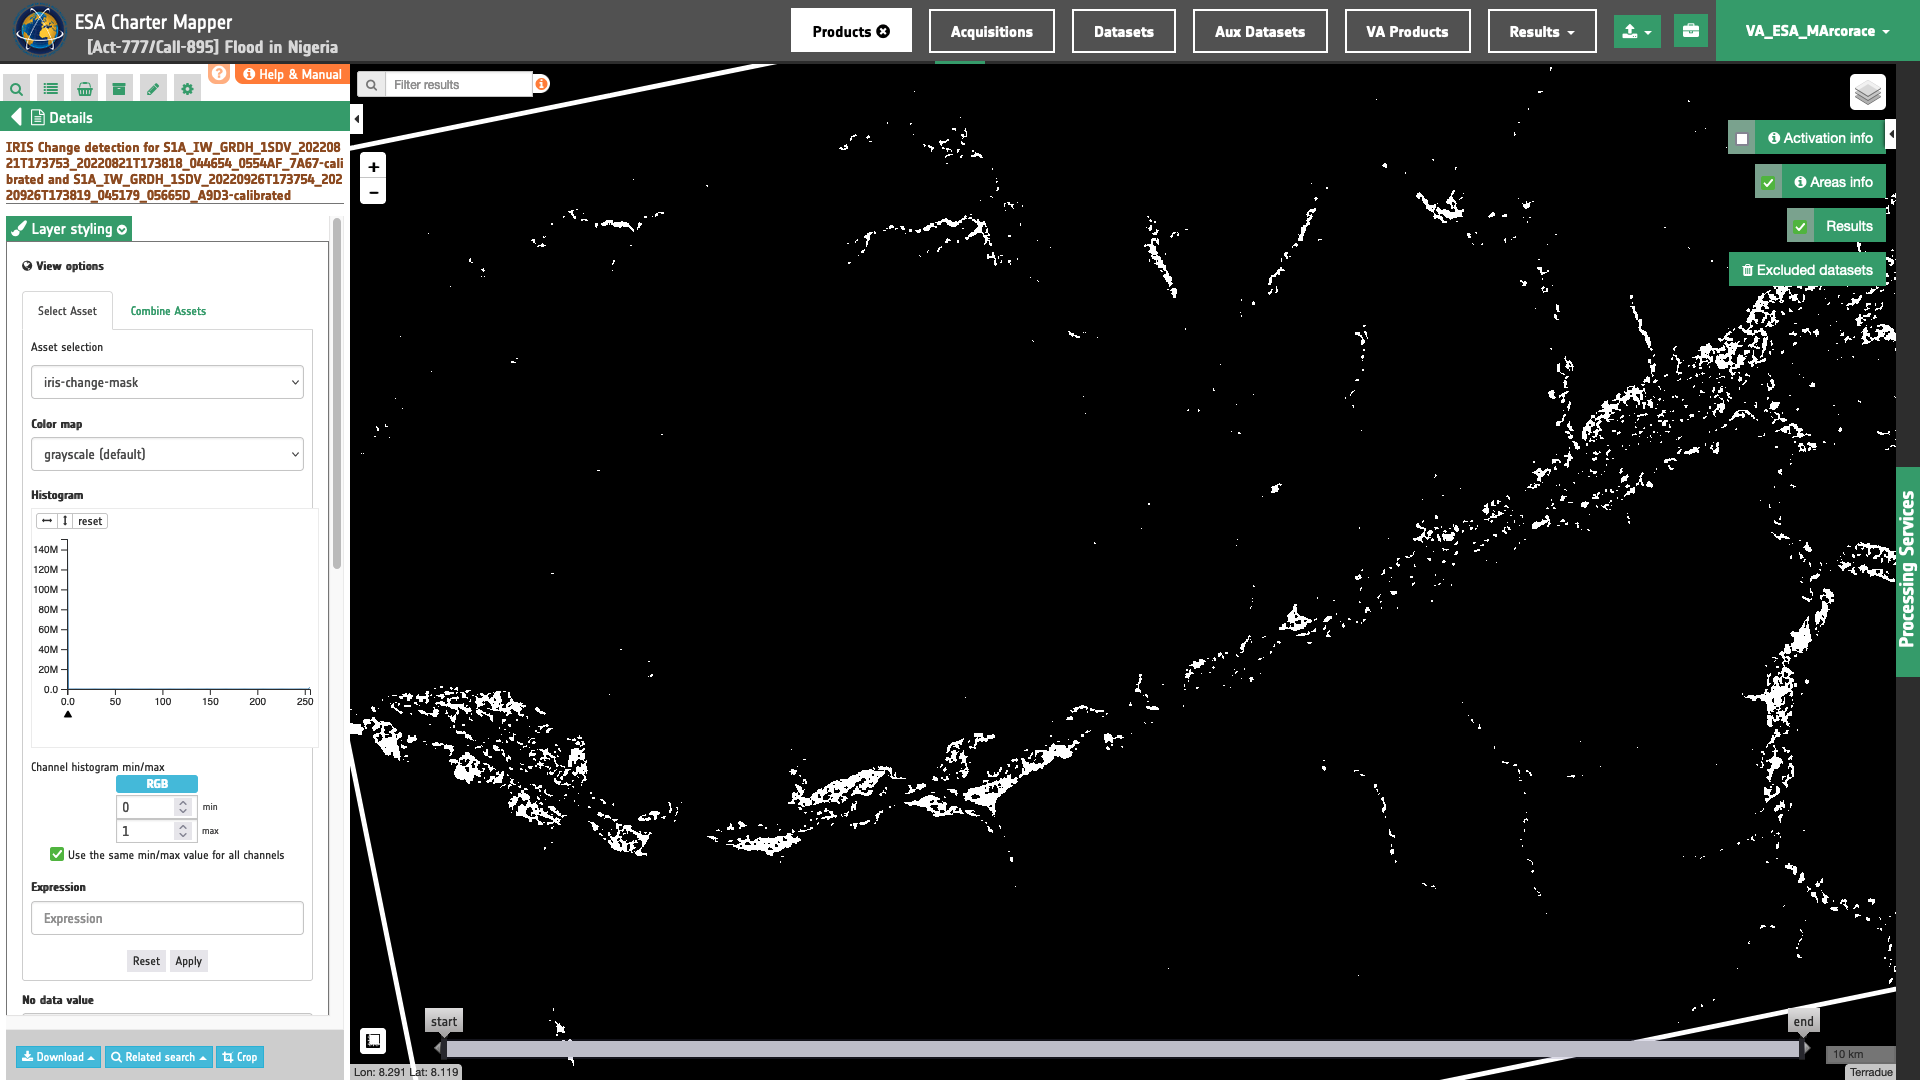
iris-change-mask asset
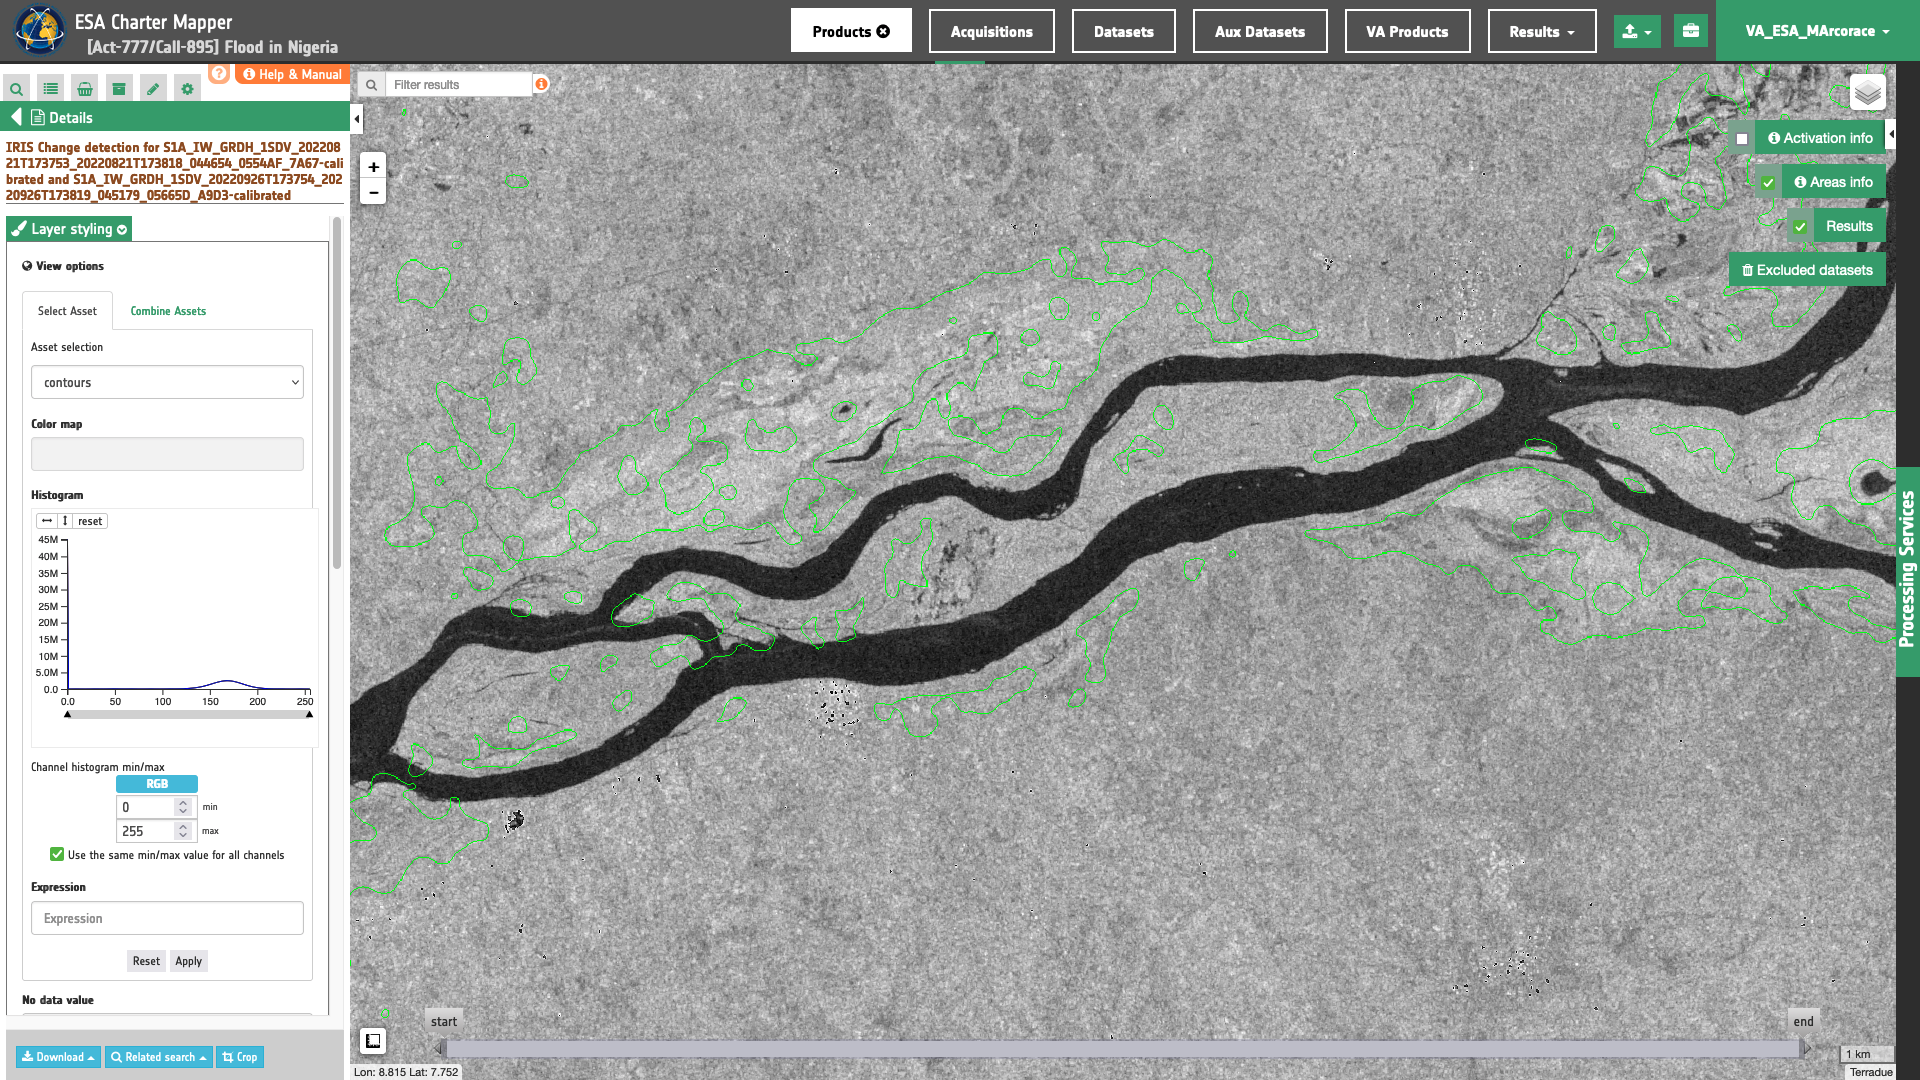
contours asset
In the left panel under the result Details is possible to create customized overview on the fly by clicking on Layer Styling and Combine Assets. As an example under Combine Assets you can create on the fly a Red-Cyan band composite by setting the s0_db_c_vv_pre single-band asset in the RED channel, and the co-registered s0_db_c_vv_post one in the GREEN and BLUE channels.
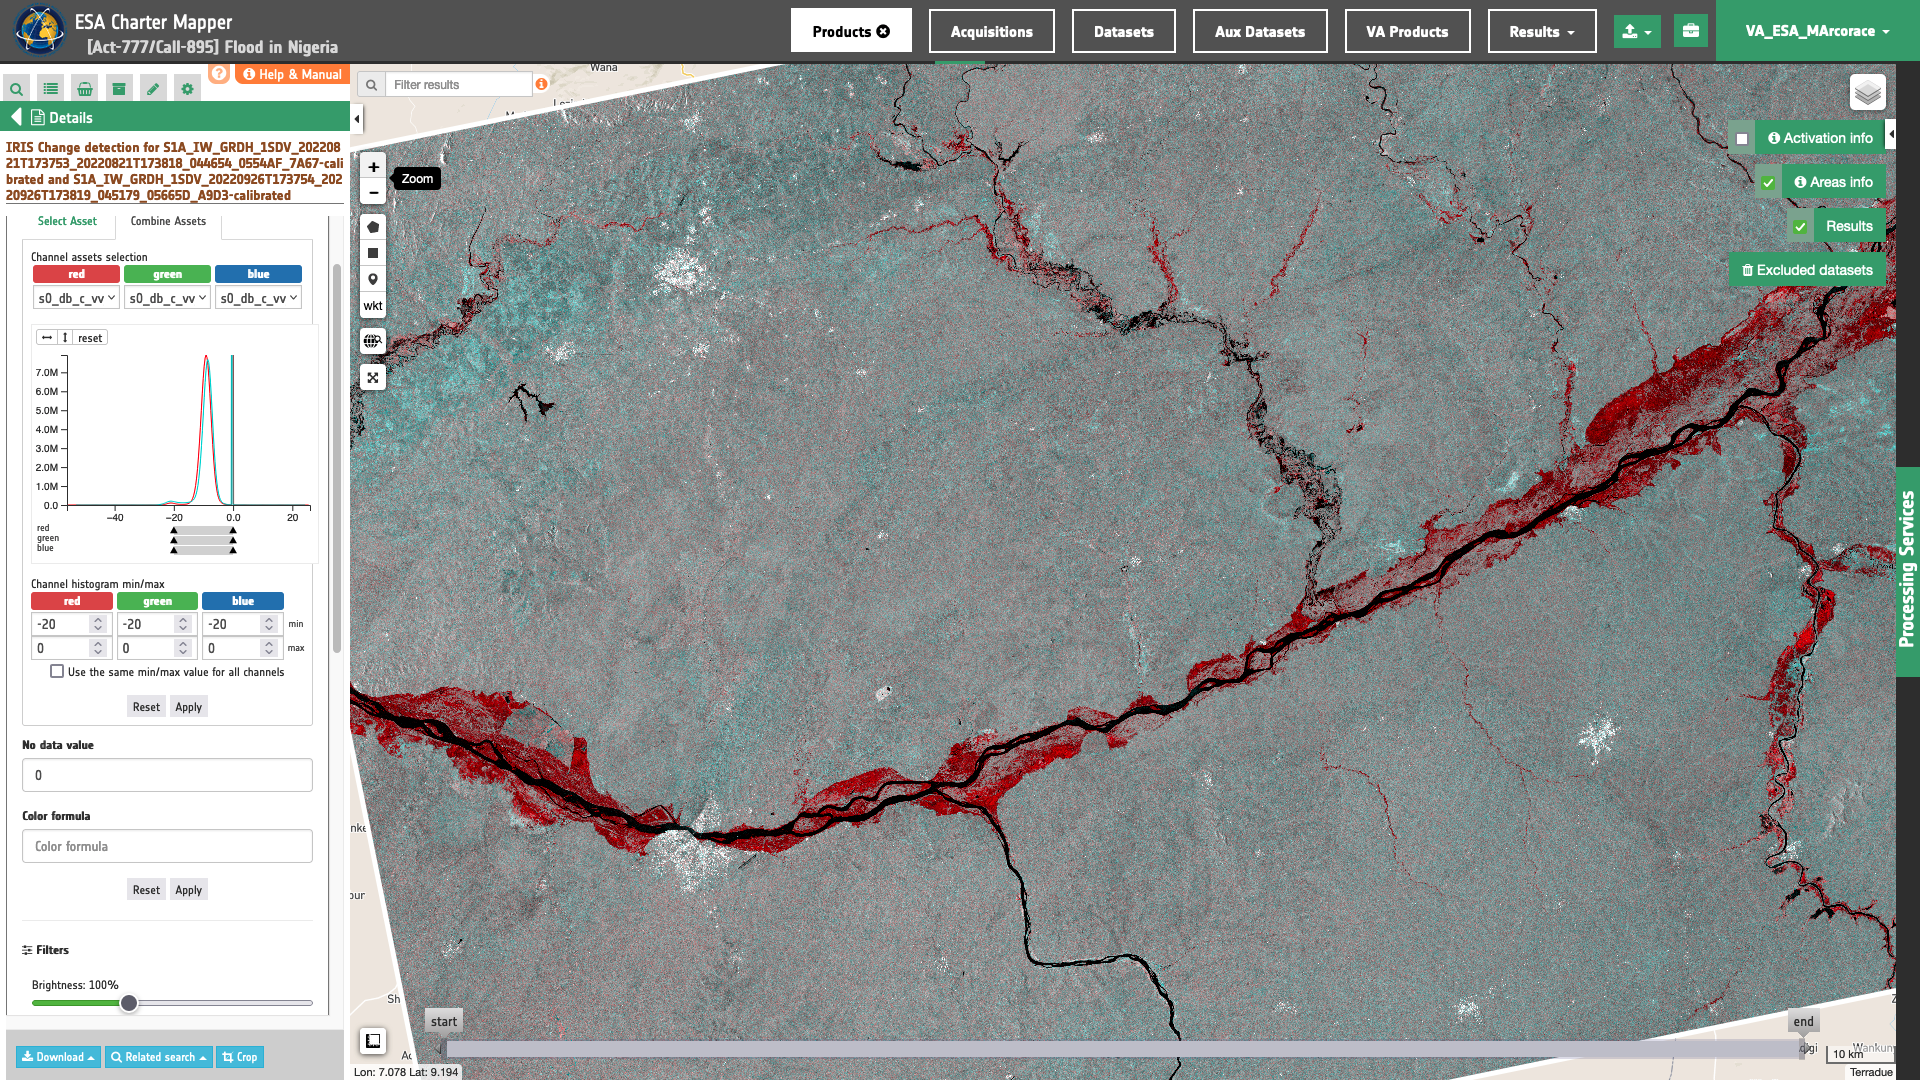
This Red-Cyan band composite highlights backscatter changes derived from Sentinel-1 data. In red are highlighted flood areas.
To better visualize the iris-change-mask asset in the map, under Layer Styling and Select Assets set the Color map as Blue-Red No Data value equal to 0 and set Brightness to 300%.
Download
In this second use case the Change Detection Analysis (IRIS) service offers the following products:
- s0_db_c_vv_pre: single band asset product from pre-event C-band Sigma Nought (dB) in VV polarization given as single band raster in COG format,
- s0_db_c_vv_post: single band asset product from post-event C-band Sigma Nought (dB) in VV polarization given as single band raster in COG format,
- ssi: single band asset for the SSI index given as single band raster in COG format,
- ssi-no-water: single band asset for the SSI index, after the masking of permanent waters, given as single band raster in COG format,
- overview-iris: default overview (RGBA) derived from the
ssiasset given as 4-band raster in COG format, - overview-iris-no-water: overview (RGBA) derived from the
ssiasset, after the masking of permanent waters, given as 4-band raster in COG format, - iris-change-mask: single band asset from thresholding of the SSI index given as UInt8 single band raster in COG format,
- iris-change-mask-no-water: single band asset from thresholding of the SSI index, after the masking of permanent waters, given as UInt8 single band raster in COG format,
- contours: overview (RGBA) showing the pre-event single band asset in gray scale and superimposed detected change contours in yellow given as 4-band raster in COG format,
- contours-no-water: overview (RGBA) showing the pre-event single band asset in gray scale and superimposed detected change contours in yellow, after the masking of permanent waters, given as 4-band raster in COG format.
These products can be downloaded by clicking on the Download button located at the bottom of the Product Details tab in the left panel.
Use case 3: change detection analysis using a multi-sensor pair of reflectance single band assets
Abstract
This second use case explains how to make change detection analysis with IRIS using a pair of reflectance single band assets from Optical Calibrated Datasets acquired by different sensors before and after a flood event.
Find the data using multiple filter criteria
Select the area for which you want to do an analysis (e.g. post-earthquake damage assessment), e.g over Gaziantep Province in southeastern Turkey. From the Navigation and Search toolbar (located in the upper left side of the map), click on the Spatial Filter and draw a square AOI over the Islahiye town, Gaziantep Province in southeastern Turkey. This spatial filter allows you to select only the EO data acquired over this area.
Now it is possible to choose a pair of pre- and post-event reflectance images from Optical Calibrated Datasets to be used for the change detection analysis. This pair must come from the same sensor.
From the top of the left panel, use Filter Criteria to search for Optical data collections from the list. Employ as satellite filter worldview-2 and worldview-3. Set as a temporal filter the time range from 01/12/2022 to 07/02/2023.
After the query the list will be updated as the one shown in the next image.
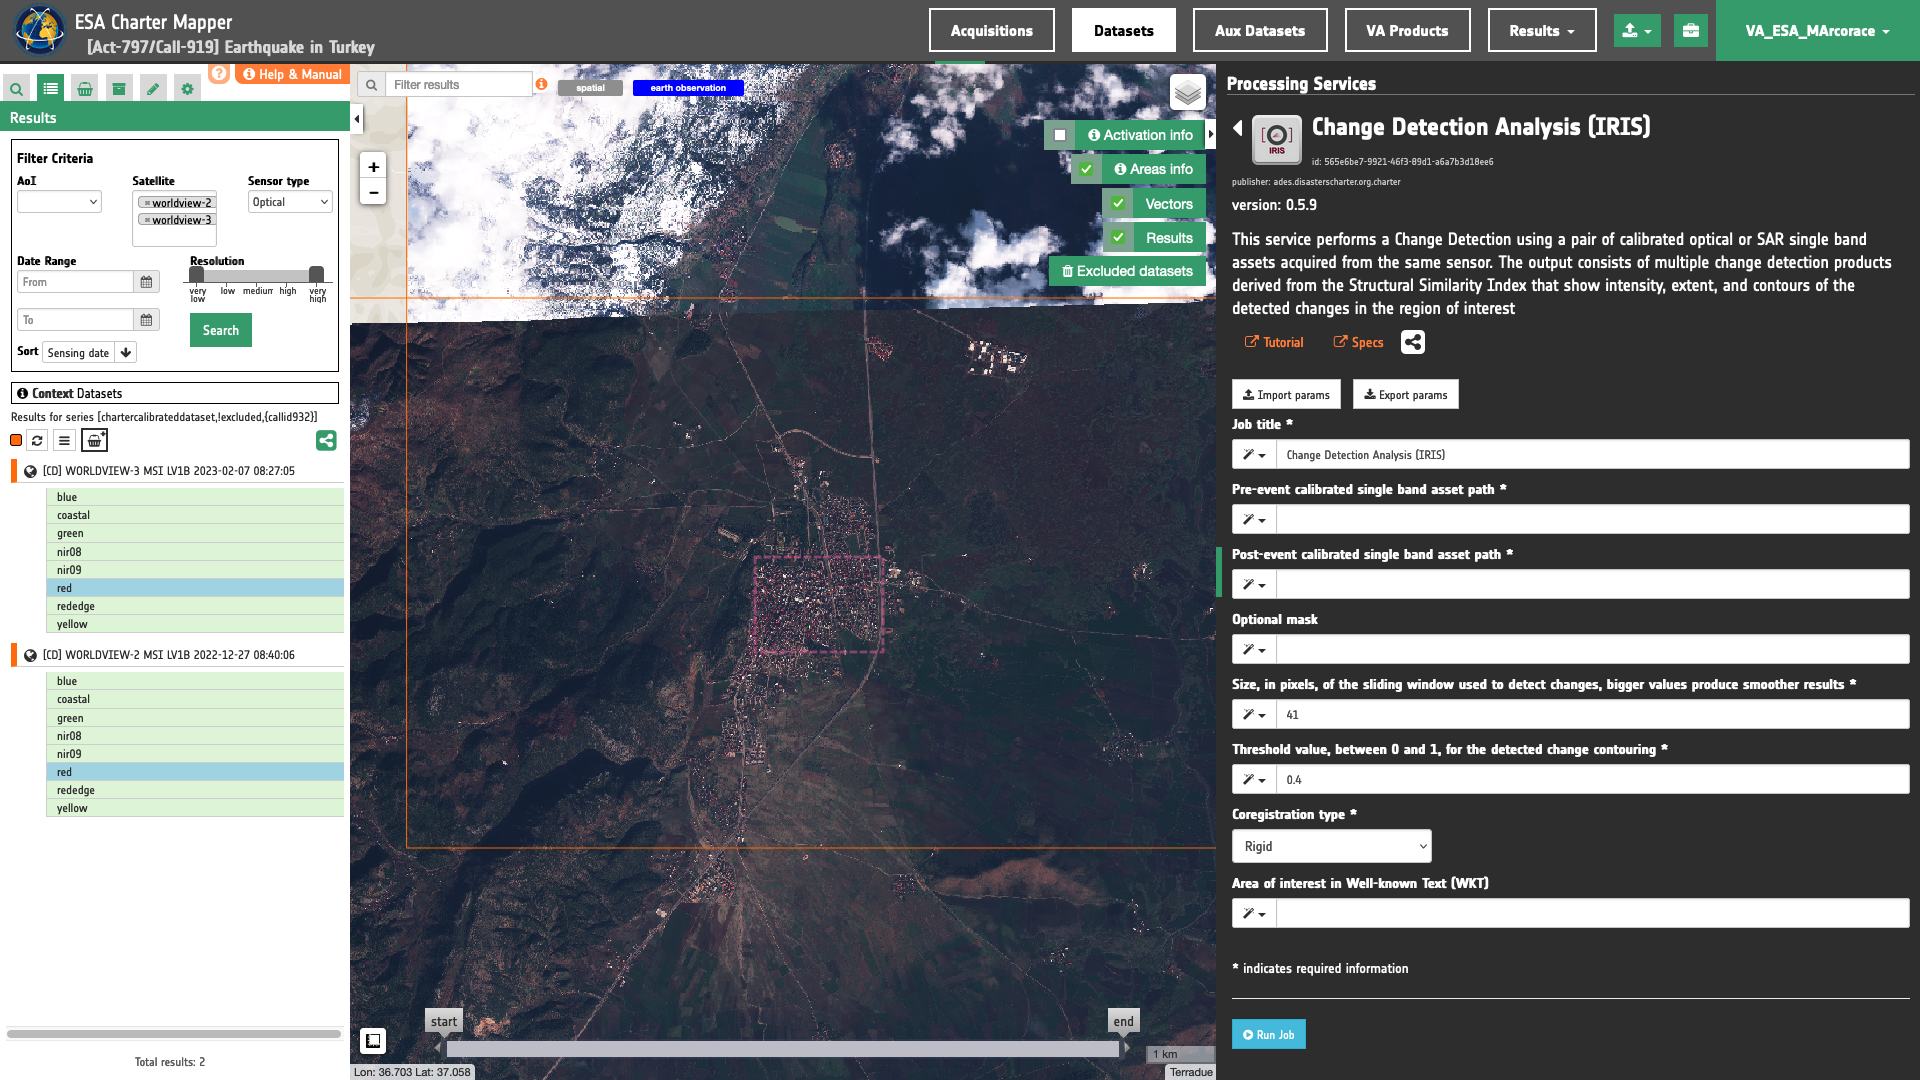
In this example the selected pair of calibrated datasets are:
-
Reference calibrated dataset (before earthquake): [CD] WORLDVIEW-2 MSI LV1B 2022-12-27 08:40:06
-
Secondary calibrated dataset (after the event): [CD] WORLDVIEW-3 MSI LV1B 2023-02-07 08:27:05
Fill the parameters
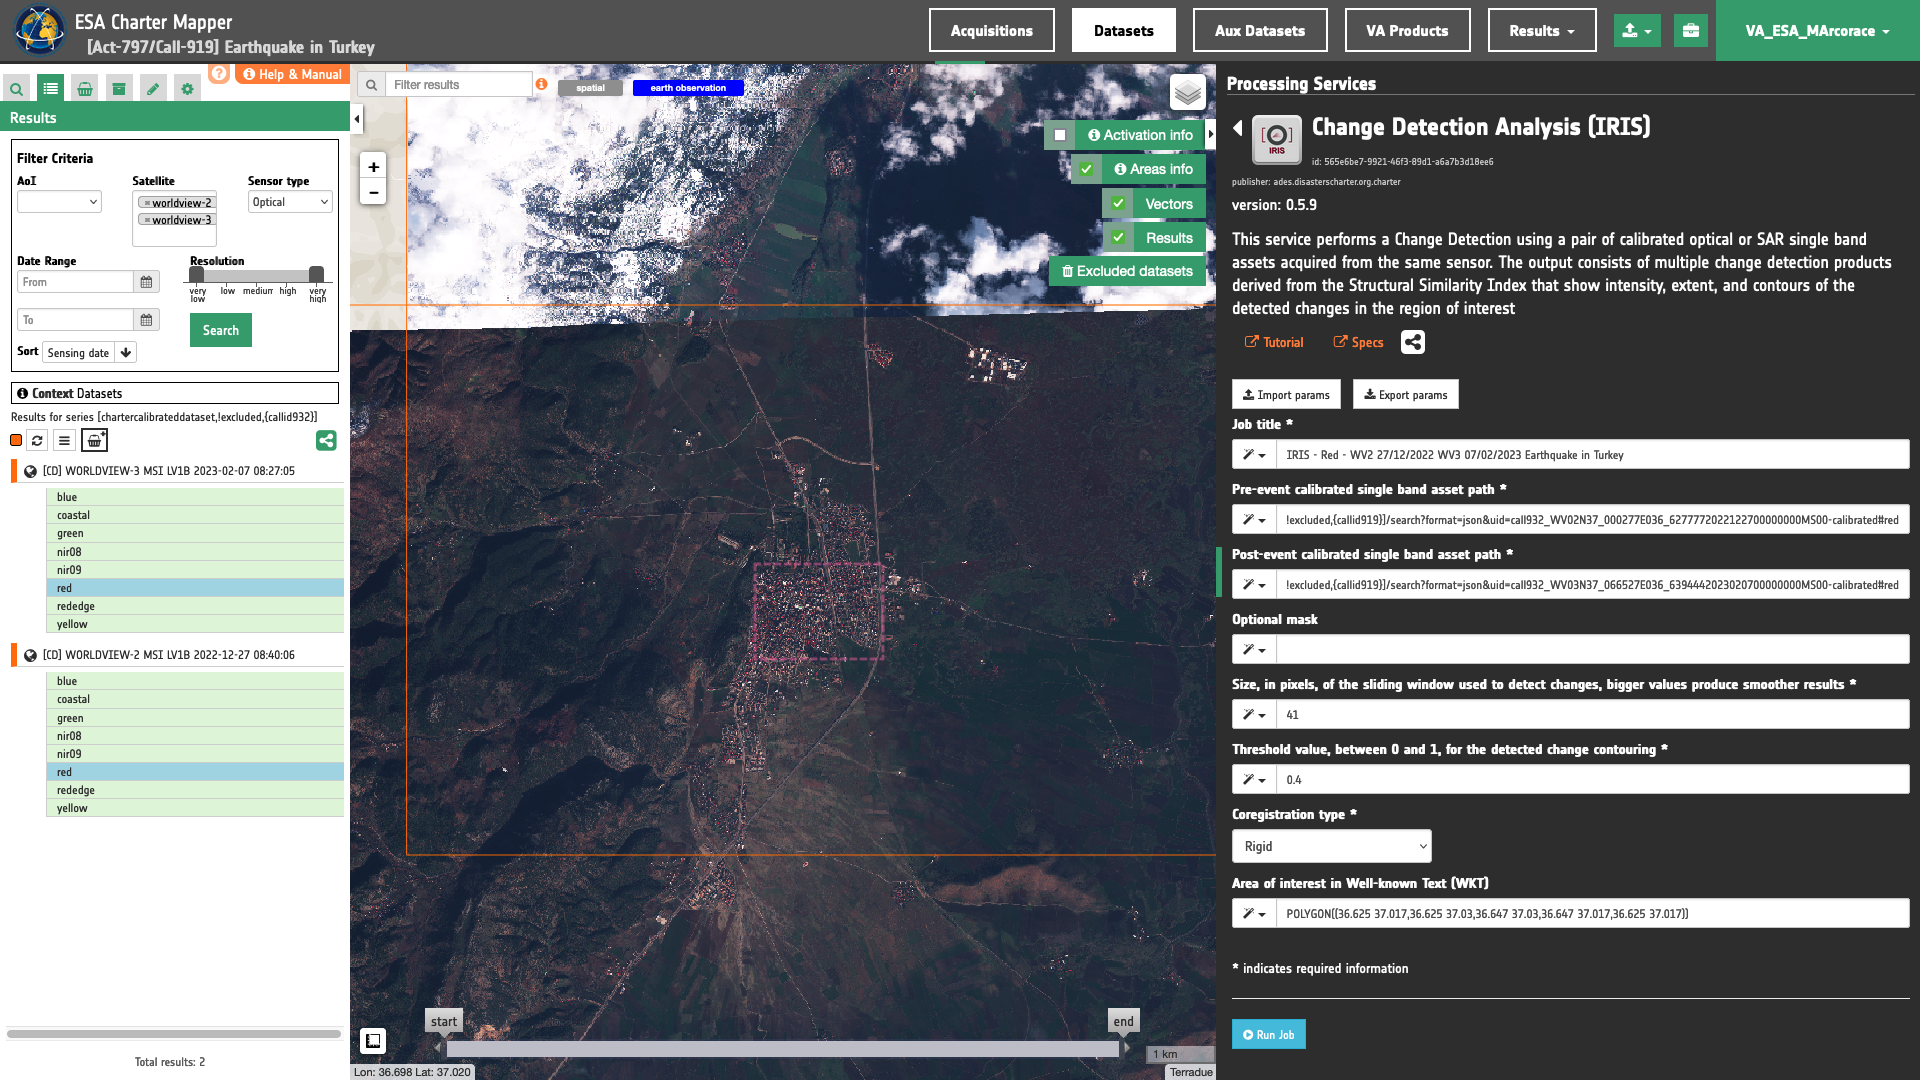
After the definition of spatial and time filters, you can employ IRIS, by using a suitable pair of single band assets (e.g. red assets) from WorldView-2 and 3 Calibrated Datasets. To do so you can fill the parameters as described in the following sections.
Job name
- Insert as job name:
IRIS - Red - WV2 27/12/2022 WV3 07/02/2023 Earthquake in Turkey
Input pair of single-band geophysical assets
First two mandatory parameters are input "Reference" and "Secondary" single band assets from Calibrated Datasets or Results of on-demand processing. This parameter is required to specify both the reference to the Calibrated Dataset and the single band asset (e.g. red) to be used for the image co-registration.
Hint
To consults the bands of a Calibrated Dataset just Click on Show assets button available near the feature title. After the click a list with all single-band assets (CBNs) included within the Calibrated Dataset will appear under the feature title.
Thus, drag and Drop the selected assets:
-
single band reflectance asset from reference Calibrated Dataset for CBN =
red -
single band reflectance asset from secondary Calibrated Dataset for CBN =
red
in the Pre-event single band asset and Post-event single band asset fields respectively.
Area of interest expressed as Well-known text (optional)
The “Area of interest as Well Known Text” can be defined by using the drawn polygon defined with the area filter.
Window size
Insert as a value for the window size the value of 41.
Threshold
Insert as a threshold the value of 0.4. This value will be used by the processor in the binarization of SSI to estimate the binary change mask and generate the contours overview.
Co-registration method
In this mandatory parameter the user shall choose the co-registration method to employ. Under Co-registration type a list of selectable options are available. Find specifications of each option here. Insert, for example, the default value Rigid to employ a rigid co-registration of secondary and reference input assets. The full-field displacement measured is used to estimate an Affine transformation matrix which is then applied to the secondary image.
Run the job
Click on the button Run Job and see the Running Job. You can monitor job progress through the progress bar.
Results: download and visualization
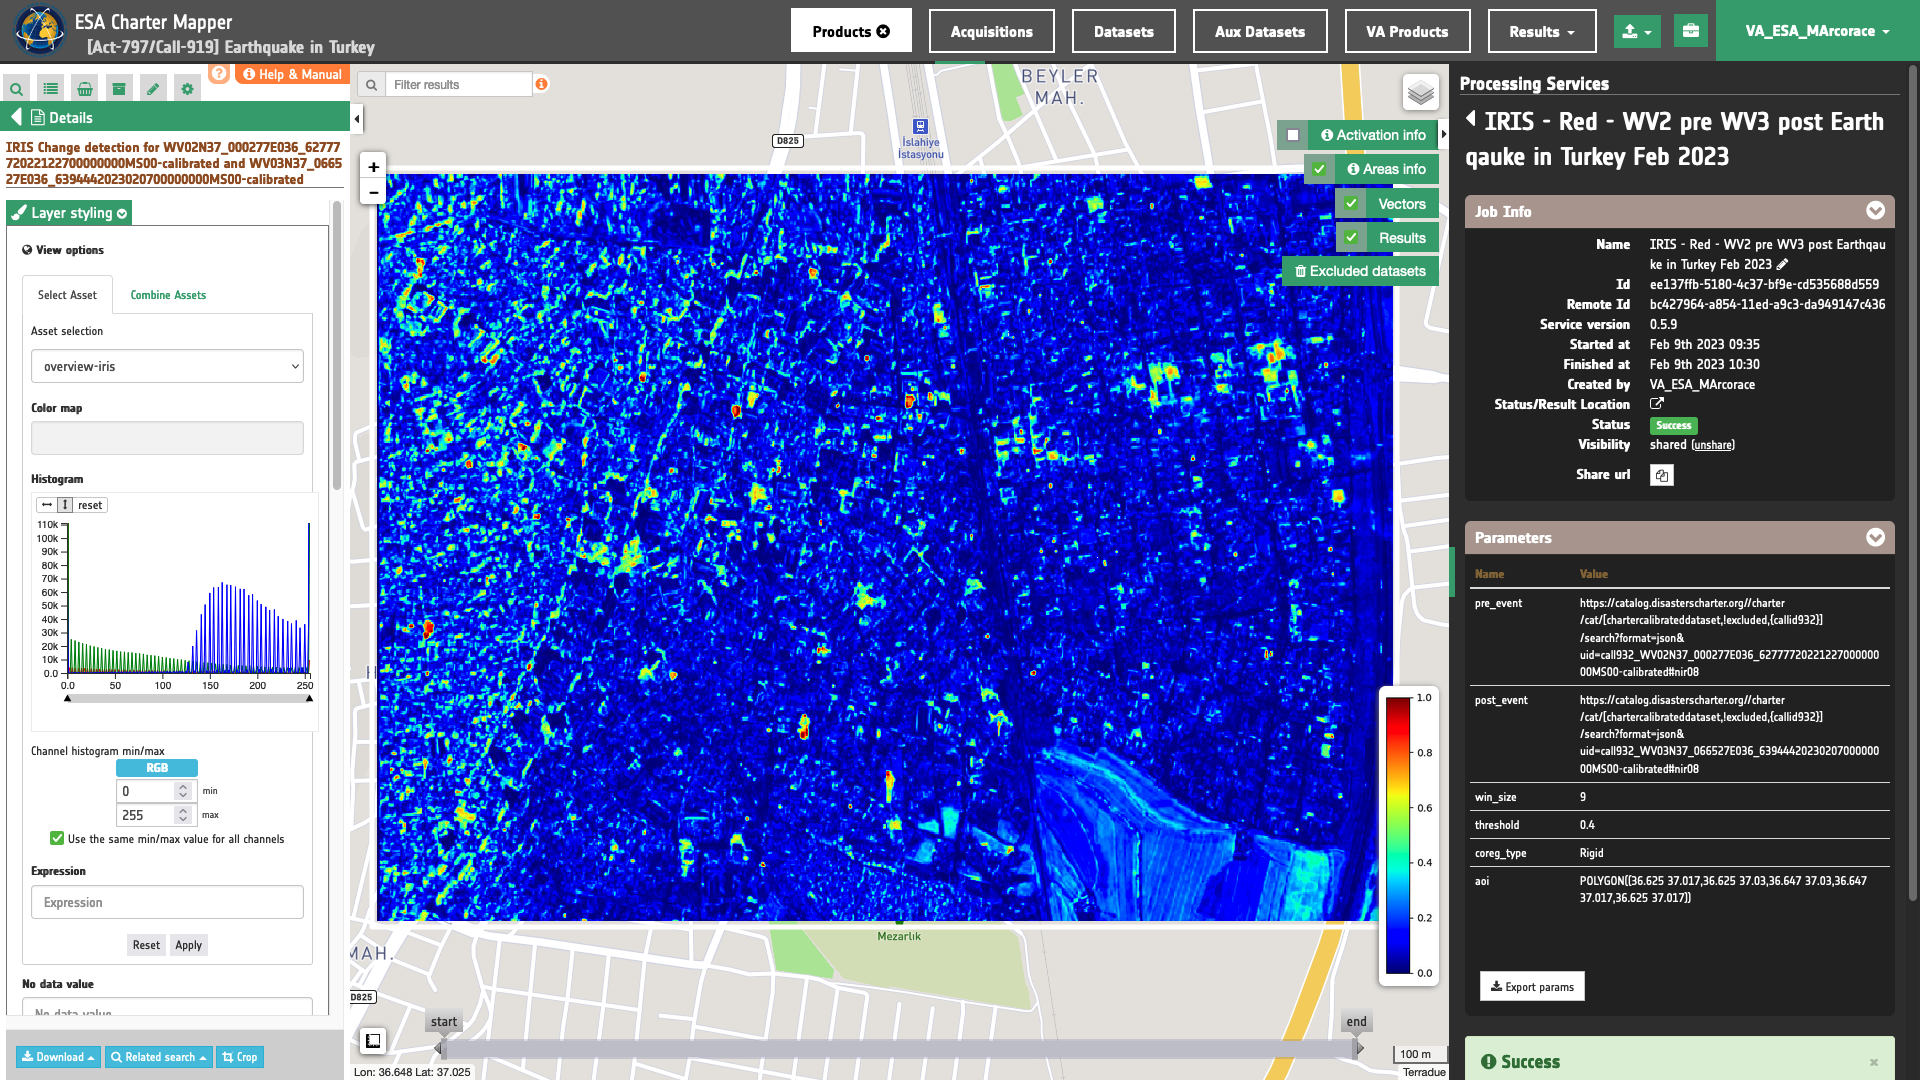
Once the job is completed, click on the Show results button located at the bottom of the processing service panel. Below is reported the syntax which includes all the parameters employed in this example.
{
   "pre_event": "https://catalog.disasterscharter.org//charter/cat/[chartercalibrateddataset,!excluded,{callid932}]/search?format=json&uid=call919_WV02N37_000277E036_6277772022122700000000MS00-calibrated#red",
   "post_event": "https://catalog.disasterscharter.org//charter/cat/[chartercalibrateddataset,!excluded,{callid932}]/search?format=json&uid=call919_WV03N37_066527E036_6394442023020700000000MS00-calibrated#red",
   "win_size": "9",
   "threshold": "0.4",
   "coreg_type": "Rigid",
   "aoi": "POLYGON((36.625 37.017,36.625 37.03,36.647 37.03,36.647 37.017,36.625 37.017))"
}
Visualization
See the result on the map. The preview appears within the area defined in the spatial filter.
To get more information about the product just click on the preview in the map, a bubble showing the name of the layer IRIS Change detection for WV02N37_000277E036_6277772022122700000000MS00-calibrated and WV03N37_066527E036_6394442023020700000000MS00-calibrated will appear and then click on the Show details button.
In the left panel of the interface, the details of Job Result will appear with Product metadata. Furthermore by clicking on Layer styling you can also access to the View options.
In here it is possible to see histogram/s of the Product which is visible in the map, set color formula, change Filters (e.g. Brightness, Opacity).
overview-iris asset
In the left panel under the result Details is possible to switch from the default asset to another one included into the IRIS results by clicking on Layer Styling and Select Assets. To visualize another asset on the map just select another asset. In the left panel under the result Details is possible to create customized overview on the fly by clicking on Layer Styling and Combine Assets.
Download
In this third use case the Change Detection Analysis (IRIS) service offers the following products:
- red_pre: single band asset product from pre-event
redreflectance given as single band raster in COG format, - red_post: single band asset product from post-event
redreflectance given as single band raster in COG format, - ssi: single band asset for the SSI index given as single band raster in COG format,
- ssi-no-water: single band asset for the SSI index, after the masking of permanent waters, given as single band raster in COG format,
- overview-iris: default overview (RGBA) derived from the
ssiasset given as 4-band raster in COG format, - overview-iris-no-water: overview (RGBA) derived from the
ssiasset, after the masking of permanent waters, given as 4-band raster in COG format, - iris-change-mask: single band asset from thresholding of the SSI index given as UInt8 single band raster in COG format,
- iris-change-mask-no-water: single band asset from thresholding of the SSI index, after the masking of permanent waters, given as UInt8 single band raster in COG format,
- contours: overview (RGBA) showing the pre-event single band asset in gray scale and superimposed detected change contours in yellow given as 4-band raster in COG format,
- contours-no-water: overview (RGBA) showing the pre-event single band asset in gray scale and superimposed detected change contours in yellow, after the masking of permanent waters, given as 4-band raster in COG format.
These products can be downloaded by clicking on the Download button located at the bottom of the Product Details tab in the left panel.
Use case 4: change detection analysis using a pair of single band assets taken from results of other services
Abstract
This fourth use case explains how to make change detection analysis with IRIS using a pair of NDVI single band assets from Results of the OPT-Index service. Input NDVI assets are derived from EO data acquired from the same sensors before and after a wildfire event.
Find and access a Result from other on-demand services
Select the area for which you want to do an analysis e.g. over Northern California in the US. In this use case two Results from the OPT-Index are used to assess the NDVI change occurred during the Dixie Fire event of 2021.
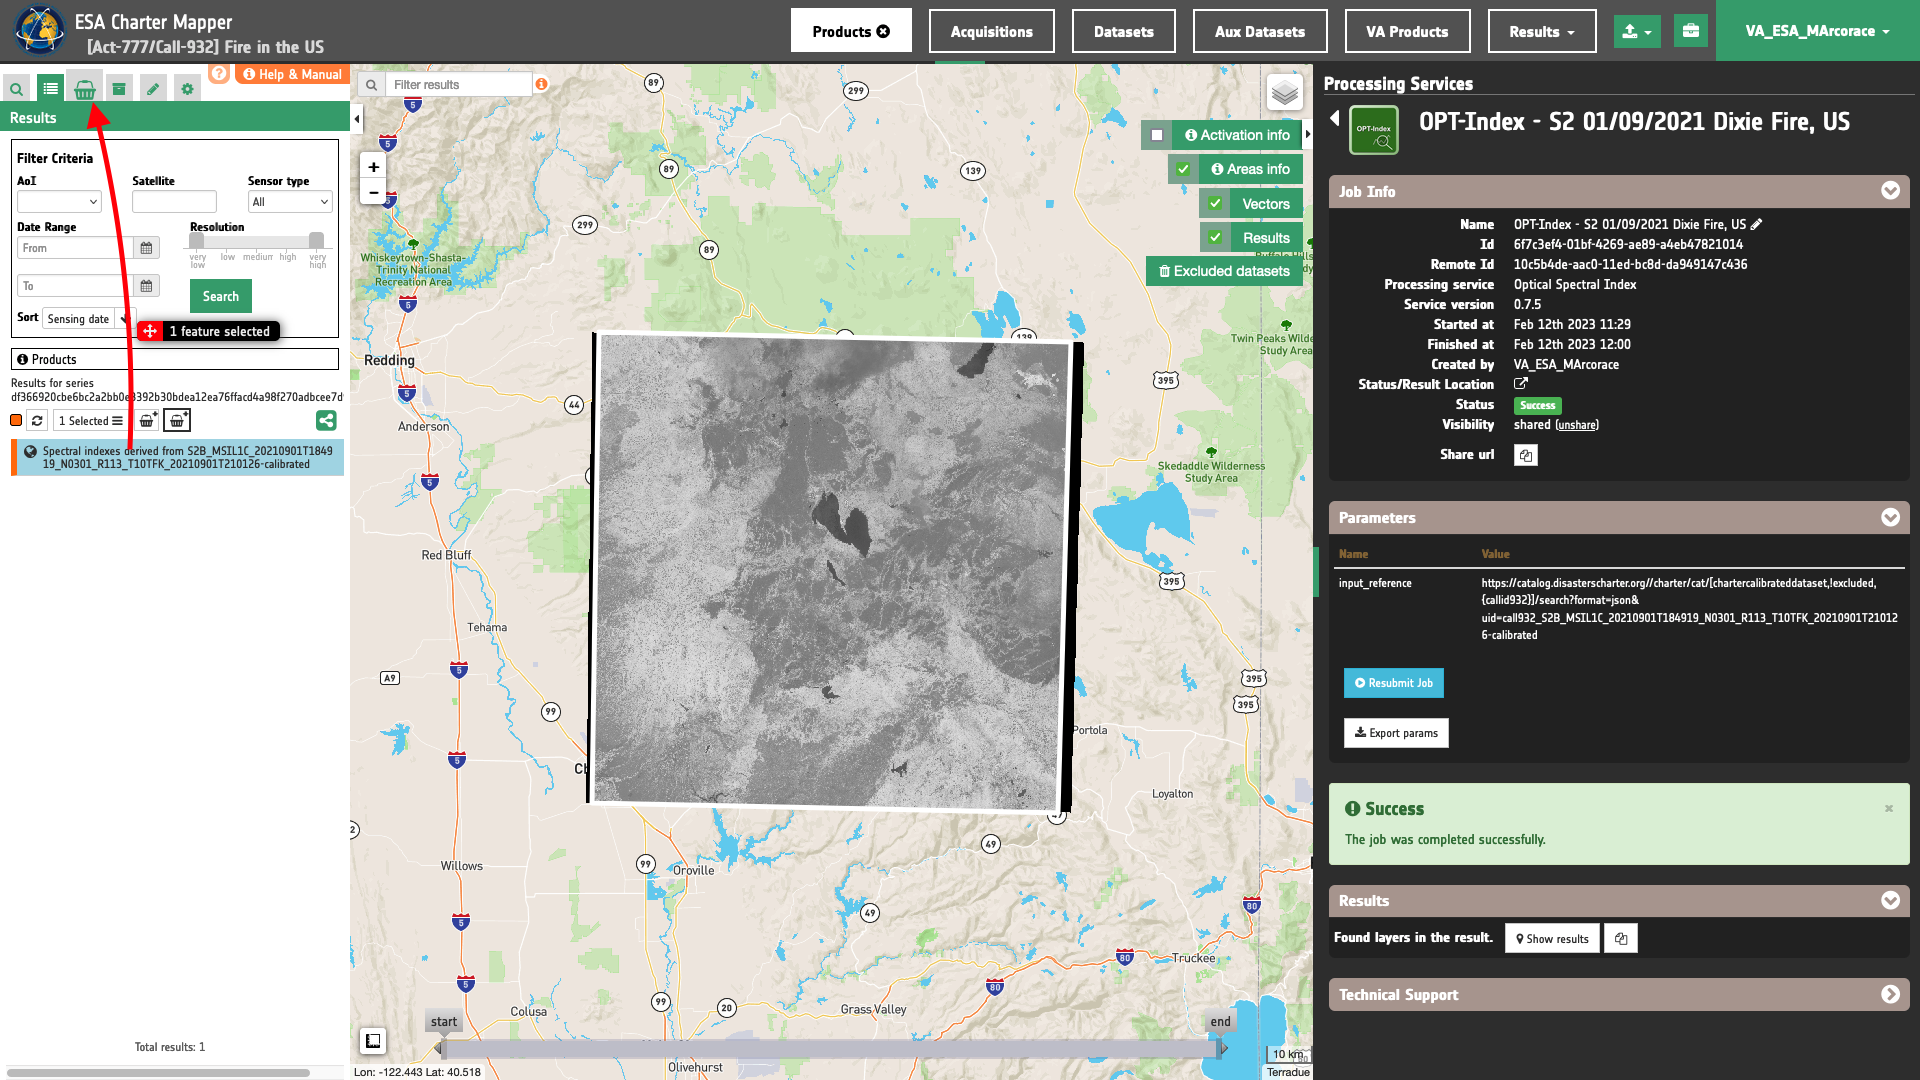
Access two successful OPT-Index jobs in the Right Panel Processing Services under the Jobs tab by clicking on the Show results button. Same OPT-Index processing results can also be listed in the left panel under theResults tab by clicking on My results or Shared results under the Results data context.
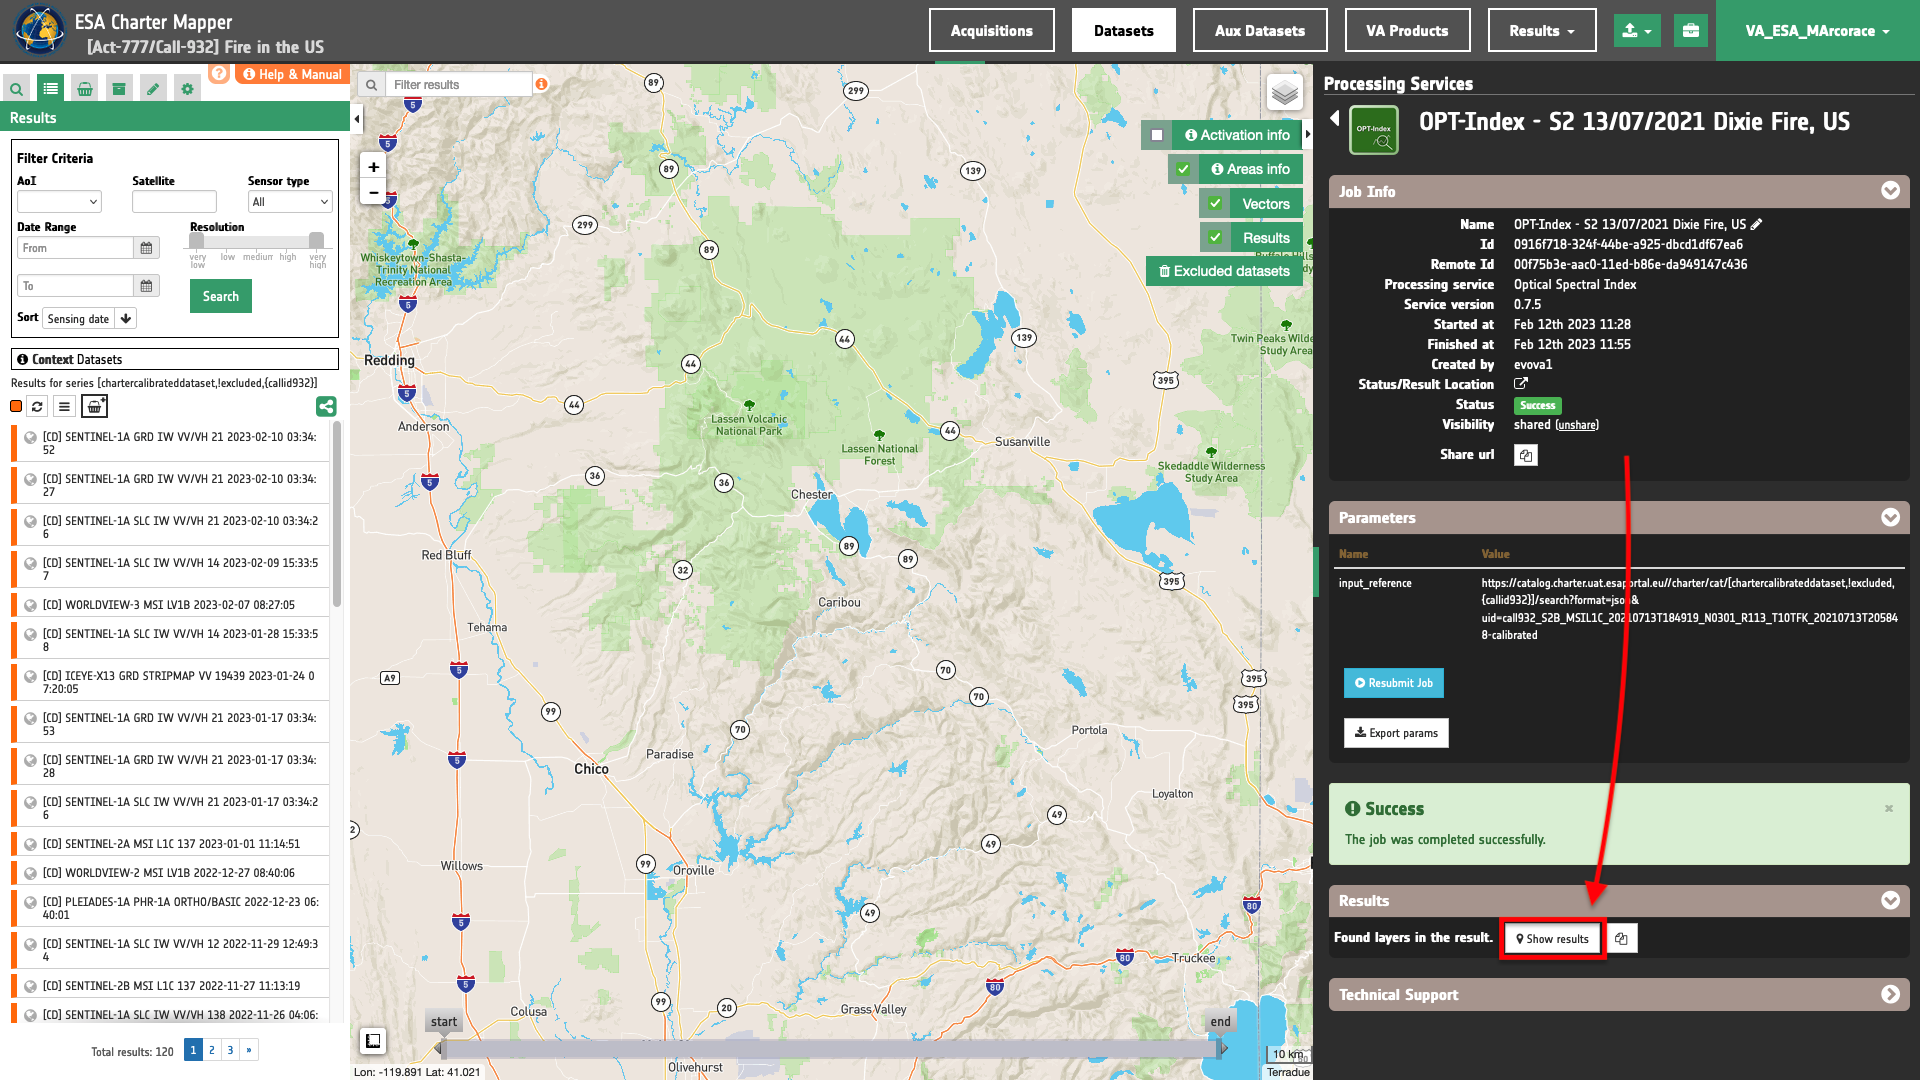
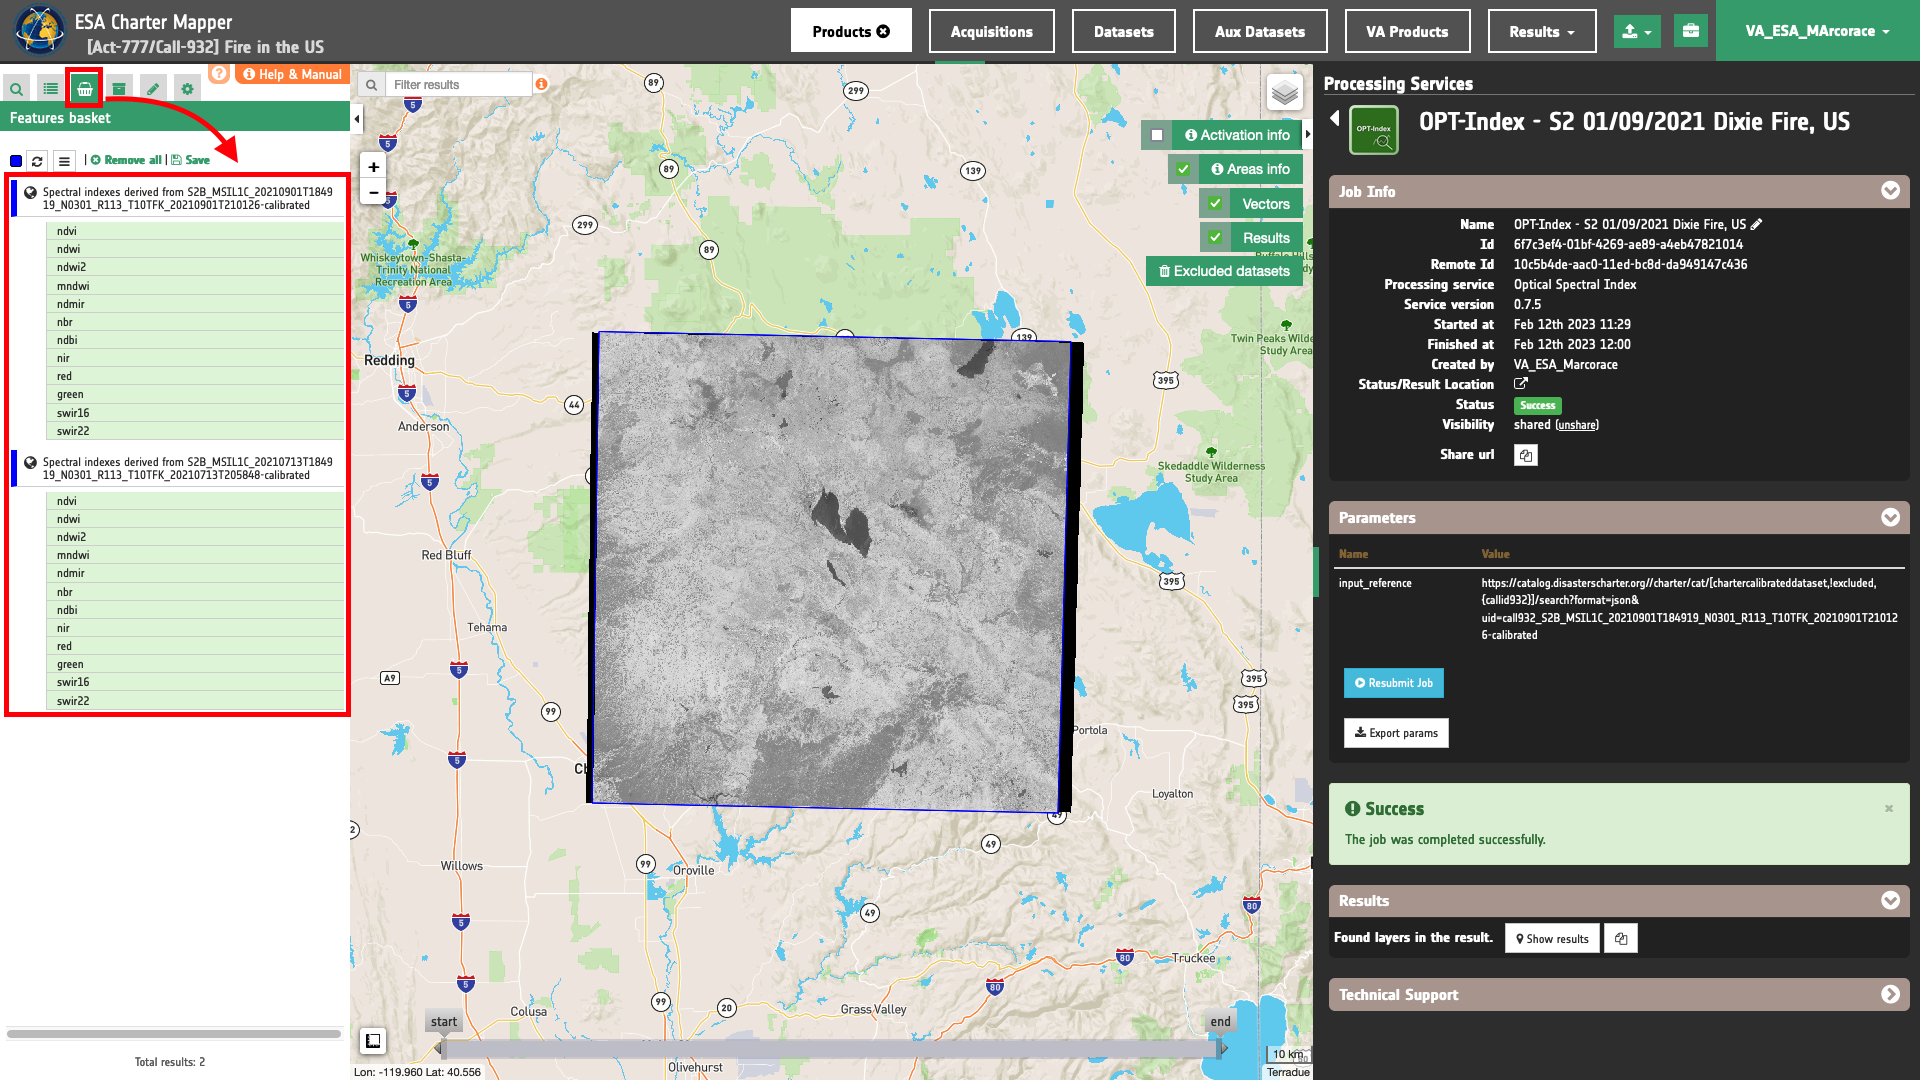
When selecting the pair of Results to be used for the Change Detection drag ang drop the Results into the feature basket.
In this example the selected pair of OPT-Index results derived from Sentinel-2 L1C Calibrated Datasets are:
-
Reference OPT-Index Result (before Dixie wildfire):
OPT-Index - S2 13/07/2021 Dixie Fire, US -
Secondary OPT-Index Result (after Dixie wildfire):
OPT-Index - S2 01/09/2021 Dixie Fire, US
Fill the parameters
After the identification of input OPT-Index Results, you can employ IRIS, by using a suitable pair of normalized difference single band assets (e.g. ndvi assets) from the two OPT-Index Results derived with Sentinel-2 data. To do so you can fill the parameters as described in the following sections.
Job name
- Insert as job name:
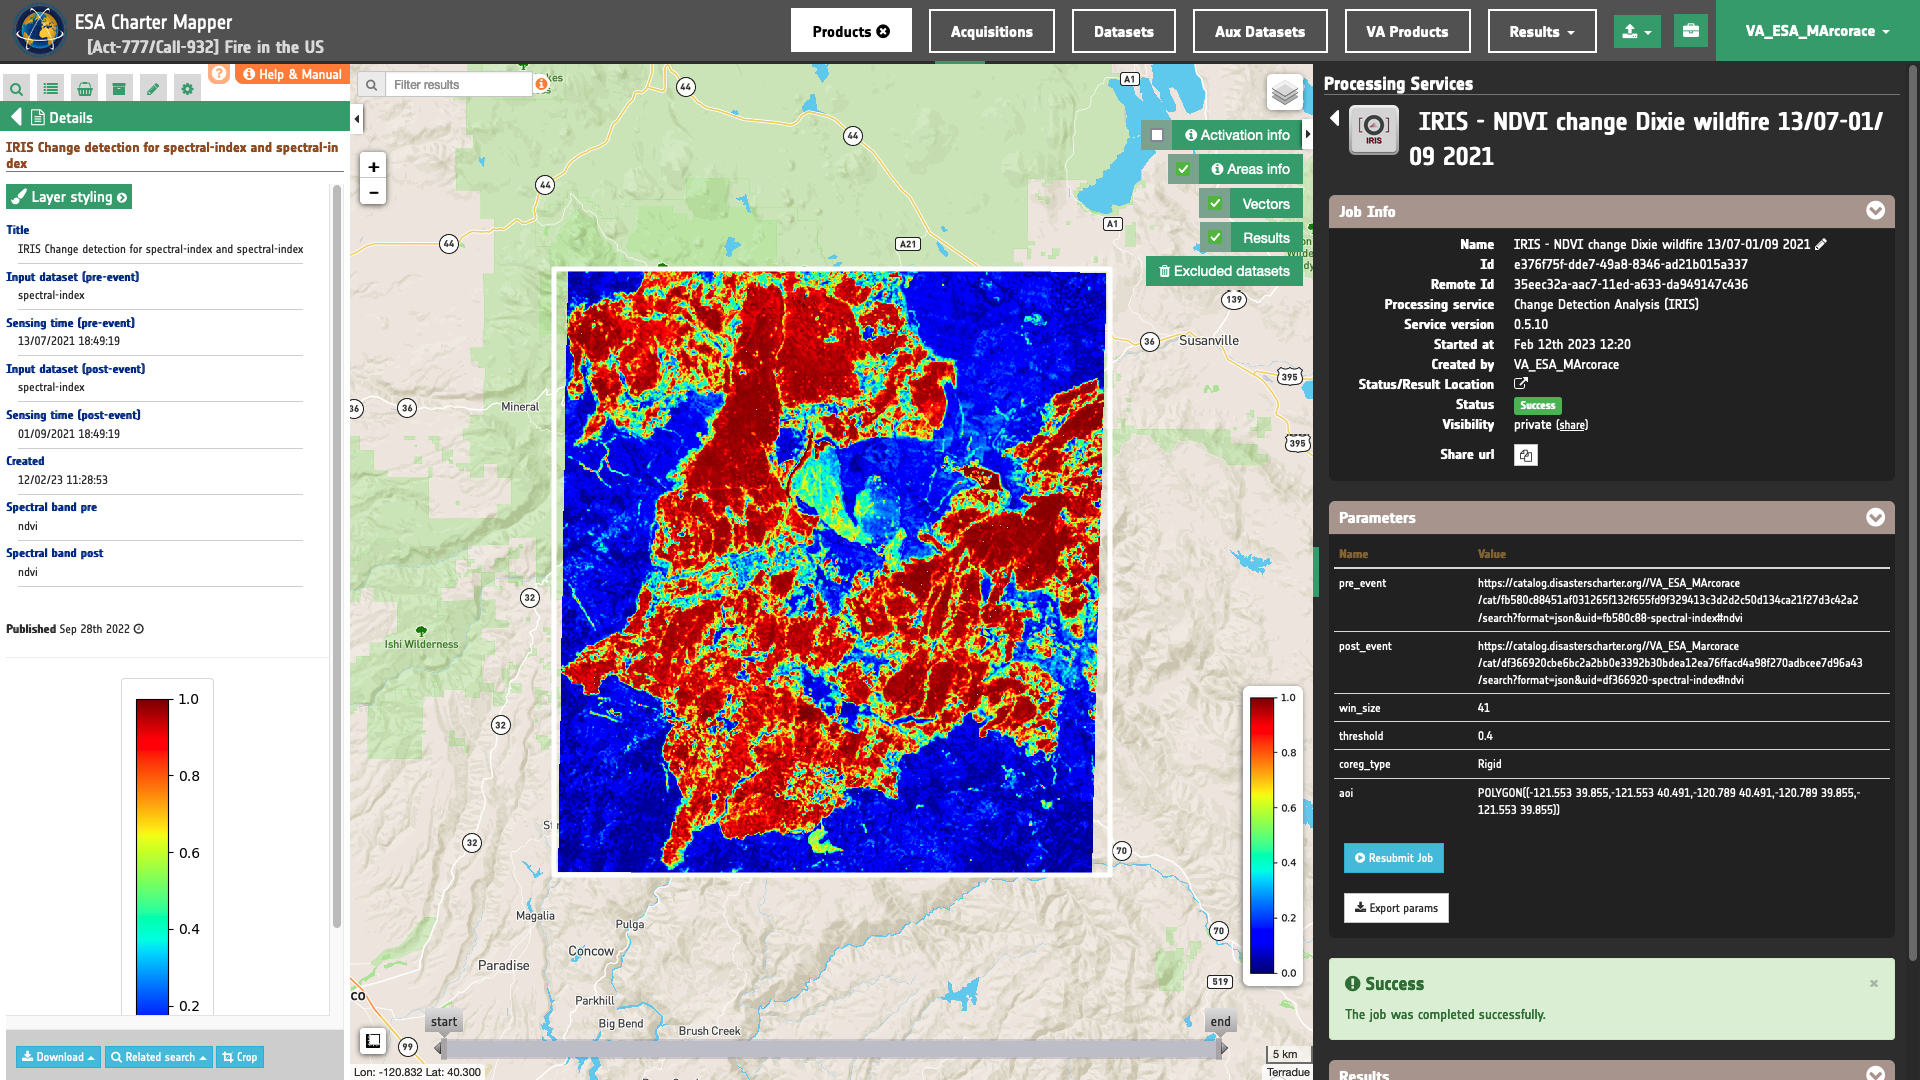
IRIS - NDVI change Dixie wildfire 13/07-01/09 2021
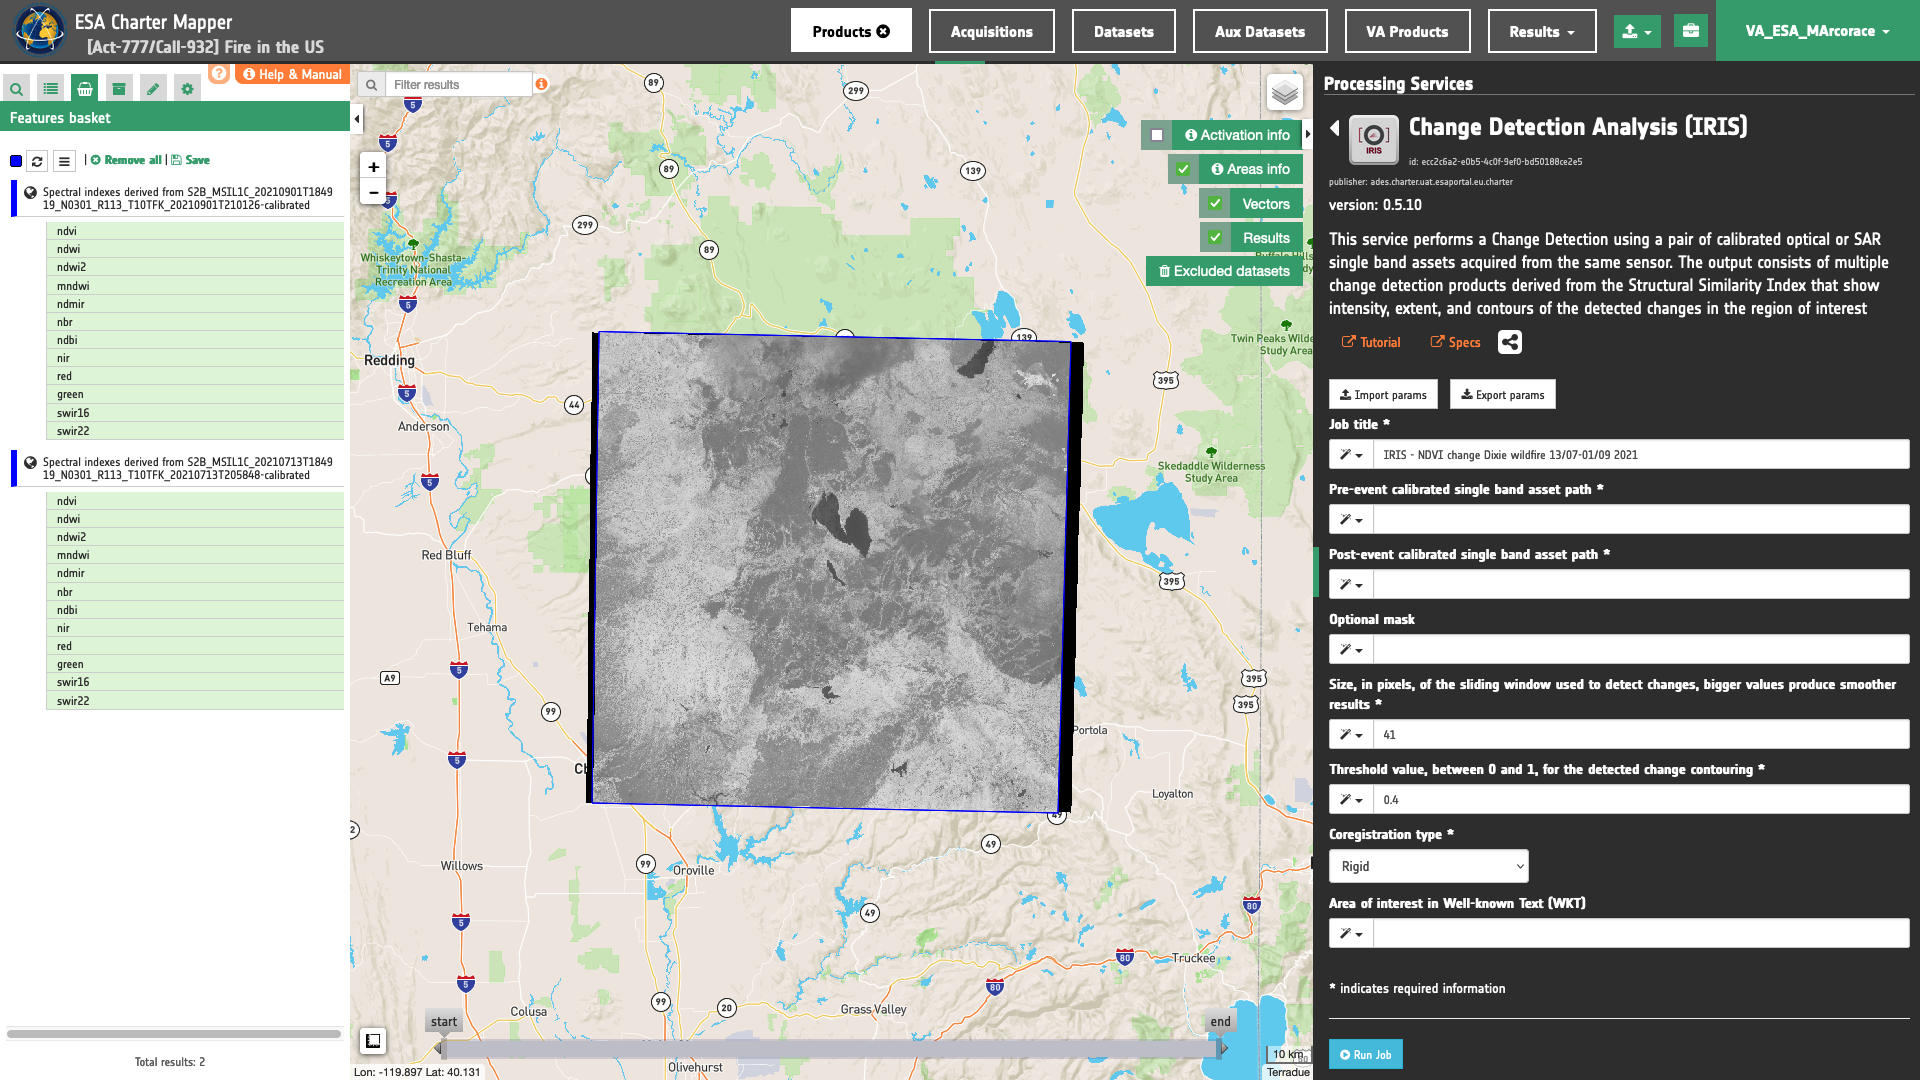
Input pair of single-band geophysical assets
First two mandatory parameters are input "Reference" and "Secondary" single band assets from Calibrated Datasets or Results of on-demand processing. This parameter is required to specify both the reference to the Result and the single band asset (e.g. ndvi) to be used for the IRIS Change detection.
Hint
To consult the single band assets contained in a Result just Click on the Show assets button available near the feature title. After the click a list with all single band assets included within the Result will appear under the feature title.
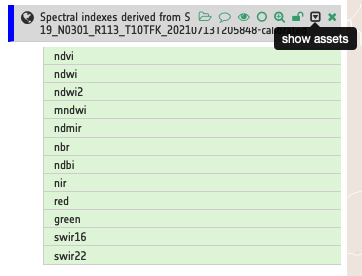
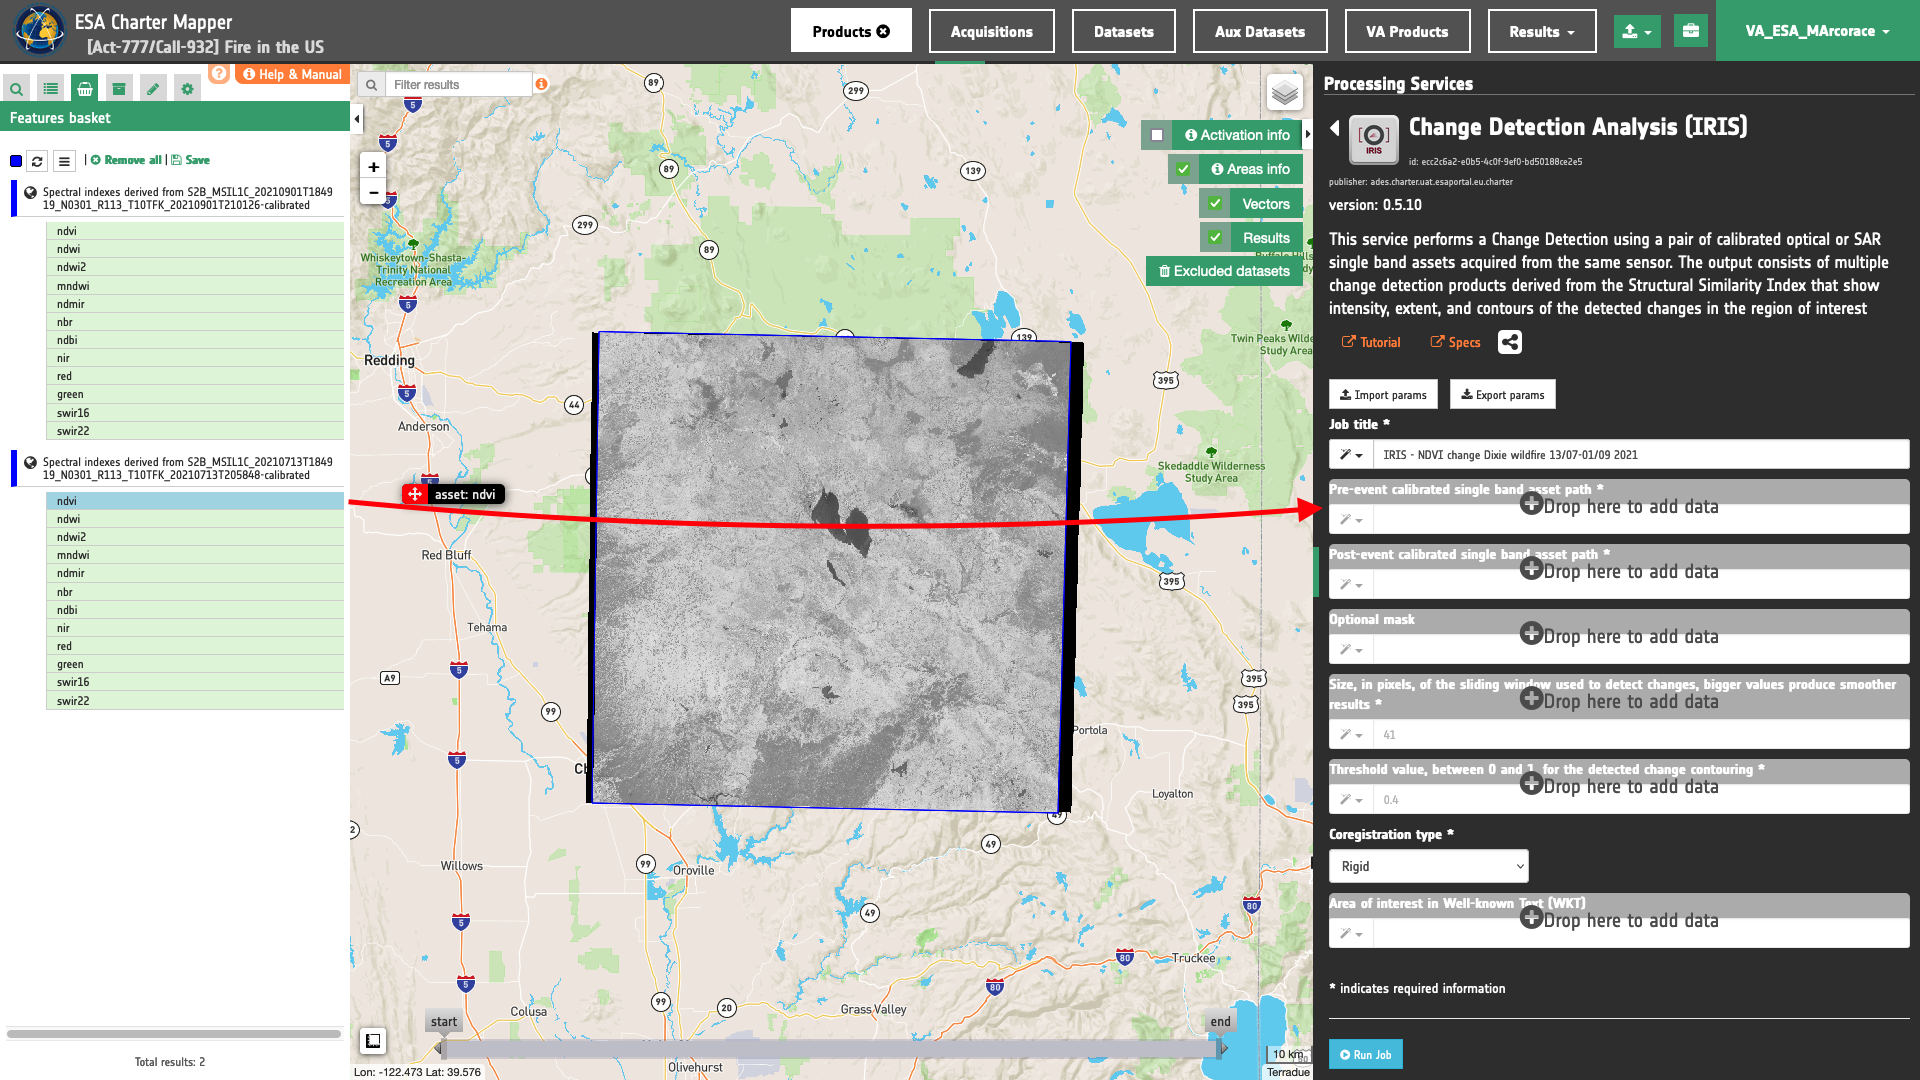
Thus, drag and Drop the selected assets:
-
single band asset from reference Result for
ndvi -
single band asset from secondary Result for
ndvi
in the Pre-event single band asset and Post-event single band asset fields respectively.
Area of interest expressed as Well-known text (optional)
The “Area of interest as Well Known Text” can be defined by using the drawn polygon defined with the area filter.
Window size
Insert as a value for the window size the value of 41.
Threshold
Insert as a threshold the value of 0.4. This value will be used by the processor in the binarization of SSI to estimate the binary change mask and generate the contours overview.
Co-registration method
In this mandatory parameter the user shall choose the co-registration method to employ. Under Co-registration type a list of selectable options are available. Find specifications of each option here. Insert, for example, the default value Rigid to employ a rigid co-registration of secondary and reference input assets. The full-field displacement measured is used to estimate an Affine transformation matrix which is then applied to the secondary image.
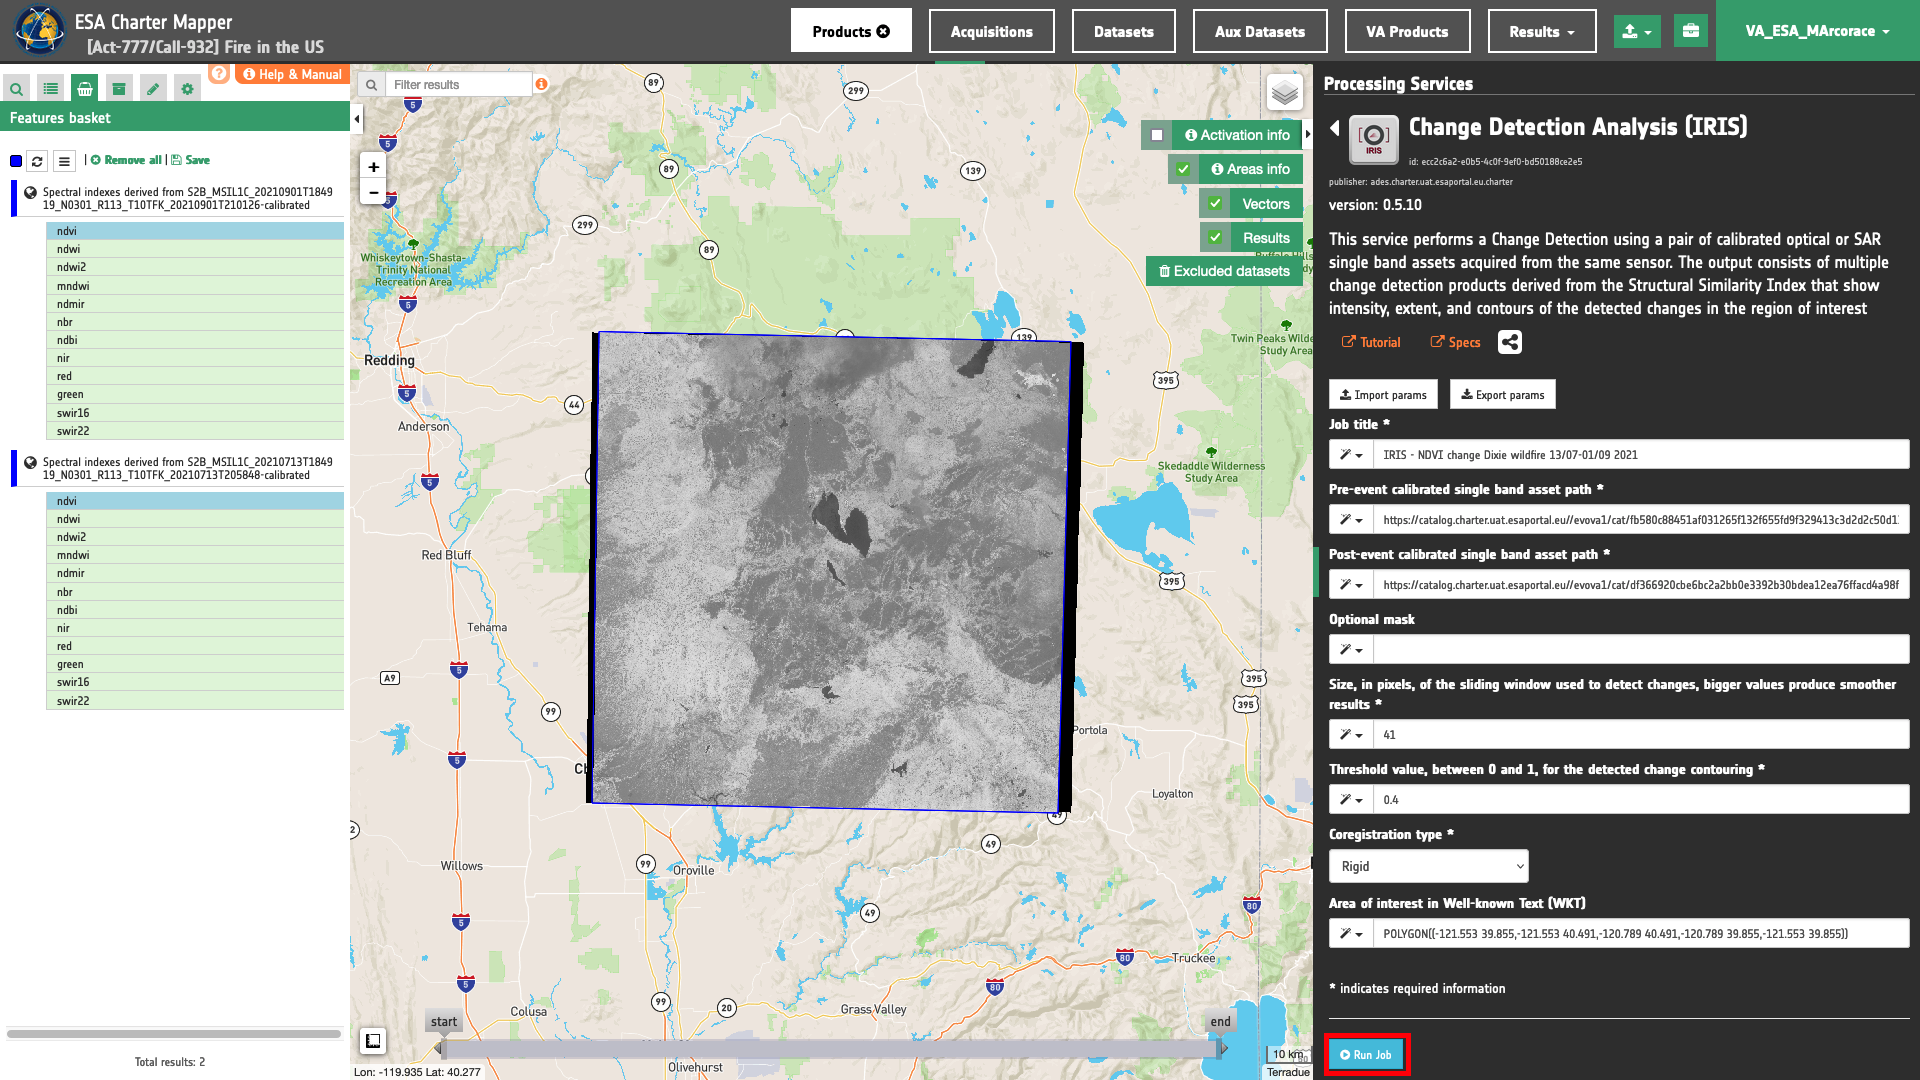
Run the job
Click on the button Run Job and see the Running Job. You can monitor job progress through the progress bar.
Results: download and visualization
Once the job is completed, click on the Show results button located at the bottom of the processing service panel. Below is reported the syntax which includes all the parameters employed in this example.
{
   "pre_event": "https://catalog.disasterscharter.org//VA_ESA_MArcorace/cat/fb580c88451af031265f132f655fd9f329413c3d2d2c50d134ca21f27d3c42a2/search?format=json&uid=fb580c88-spectral-index#ndvi",
   "post_event": "https://catalog.disasterscharter.org//VA_ESA_MArcorace/cat/df366920cbe6bc2a2bb0e3392b30bdea12ea76ffacd4a98f270adbcee7d96a43/search?format=json&uid=df366920-spectral-index#ndvi",
   "win_size": "41",
   "threshold": "0.4",
   "coreg_type": "Rigid",
   "aoi": "POLYGON((-121.553 39.855,-121.553 40.491,-120.789 40.491,-120.789 39.855,-121.553 39.855))"
}
Visualization
See the result on the map. The preview appears within the area defined in the spatial filter.
To get more information about the product just click on the preview in the map, a bubble showing the name of the layer IRIS Change detection for spectral-index and spectral-index will appear and then click on the Show details button.
In the left panel of the interface, the details of Job Result will appear with Product metadata. Furthermore by clicking on Layer styling you can also access to the View options.
In here it is possible to see histogram/s of the Product which is visible in the map, set color formula, change Filters (e.g. Brightness, Opacity).
overview-iris asset
In the left panel under the result Details is possible to switch from the default asset to another one included into the IRIS results by clicking on Layer Styling and Select Assets. To visualize another asset on the map just select another asset. In the left panel under the result Details is possible to create customized overview on the fly by clicking on Layer Styling and Combine Assets.
Download
In this third use case the Change Detection Analysis (IRIS) service offers the following products:
- ndvi_pre: single band asset product from pre-event
ndviasset given as single band raster in COG format, - ndvi_post: single band asset product from post-event
ndviasset given as single band raster in COG format, - ssi: single band asset for the SSI index given as single band raster in COG format,
- ssi-no-water: single band asset for the SSI index, after the masking of permanent waters, given as single band raster in COG format,
- overview-iris: default overview (RGBA) derived from the
ssiasset given as 4-band raster in COG format, - overview-iris-no-water: overview (RGBA) derived from the
ssiasset, after the masking of permanent waters, given as 4-band raster in COG format, - iris-change-mask: single band asset from thresholding of the SSI index given as UInt8 single band raster in COG format,
- iris-change-mask-no-water: single band asset from thresholding of the SSI index, after the masking of permanent waters, given as UInt8 single band raster in COG format,
- contours: overview (RGBA) showing the pre-event single band asset in gray scale and superimposed detected change contours in yellow given as 4-band raster in COG format,
- contours-no-water: overview (RGBA) showing the pre-event single band asset in gray scale and superimposed detected change contours in yellow, after the masking of permanent waters, given as 4-band raster in COG format.
These products can be downloaded by clicking on the Download button located at the bottom of the Product Details tab in the left panel.