OPT-Index tutorial
![]()
This service derives multiple spectral indices from optical remote sensing multispectral data. NDVI, NDMIR, NDWI, NDWI 2, MNDWI, NBR, and NDBI are derived by combininge reflectance assets included in the calibrated dataset.
 OPT-Index service description and specifications are available in this section.
Select the processing service
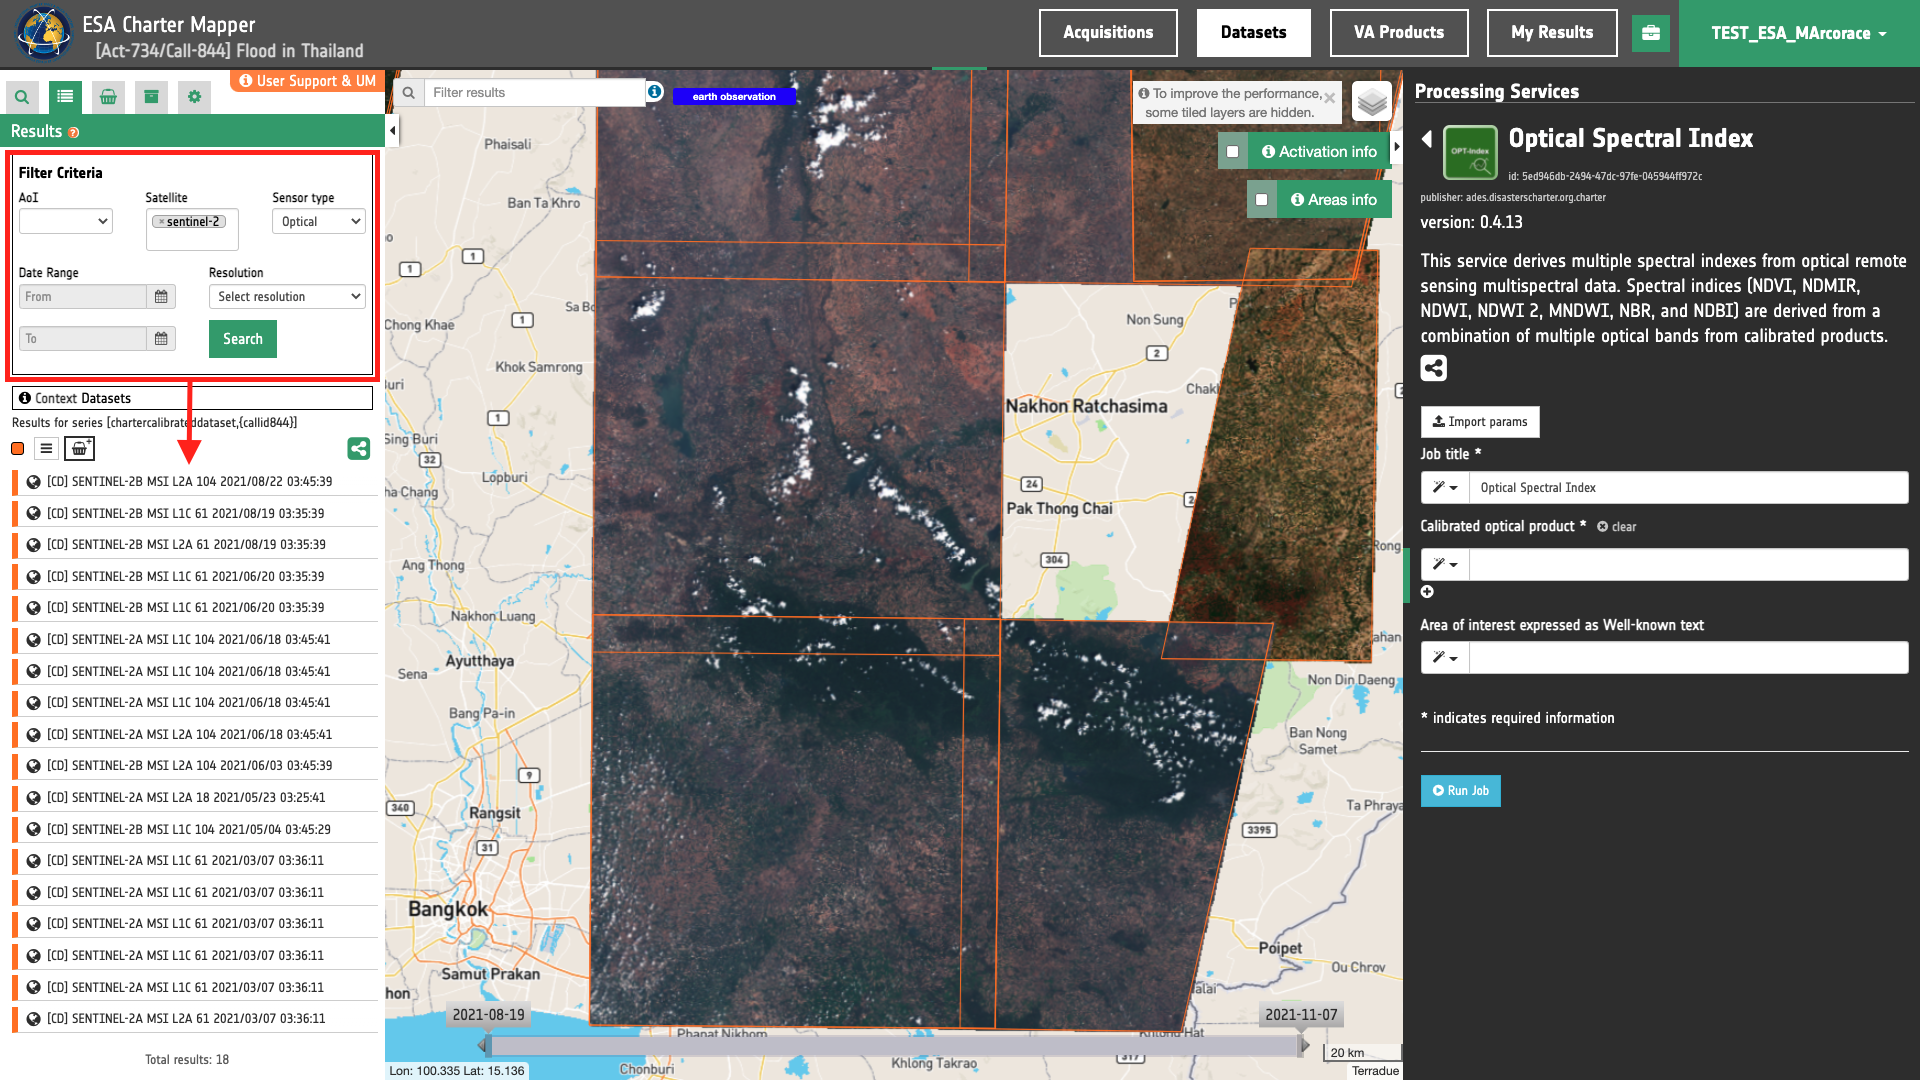
After the opening of the activation workspace, in the right panel of the interface, open the Processing Services tab.
Select the processing service Optical Spectral Index.
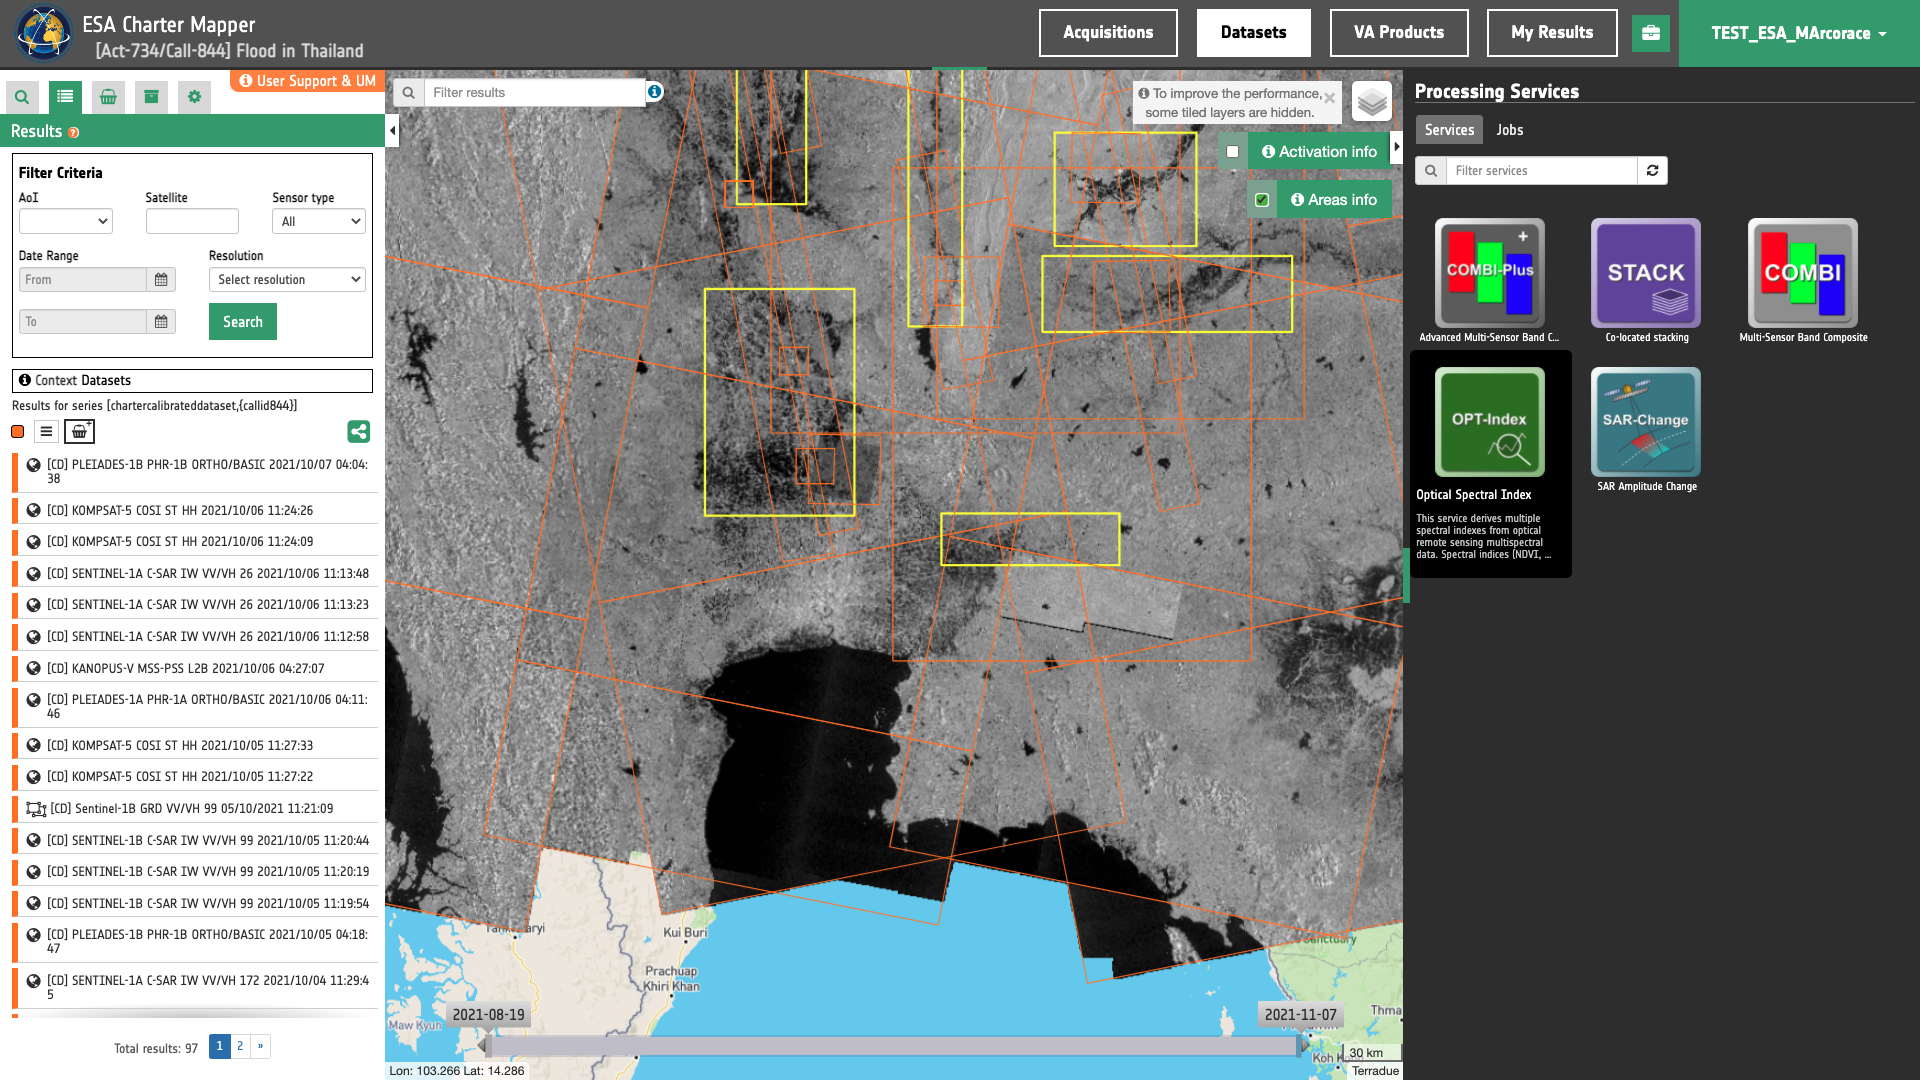
The "Optical Spectral Index (OPT-Index)" panel is displayed with parameters values to be filled-in.
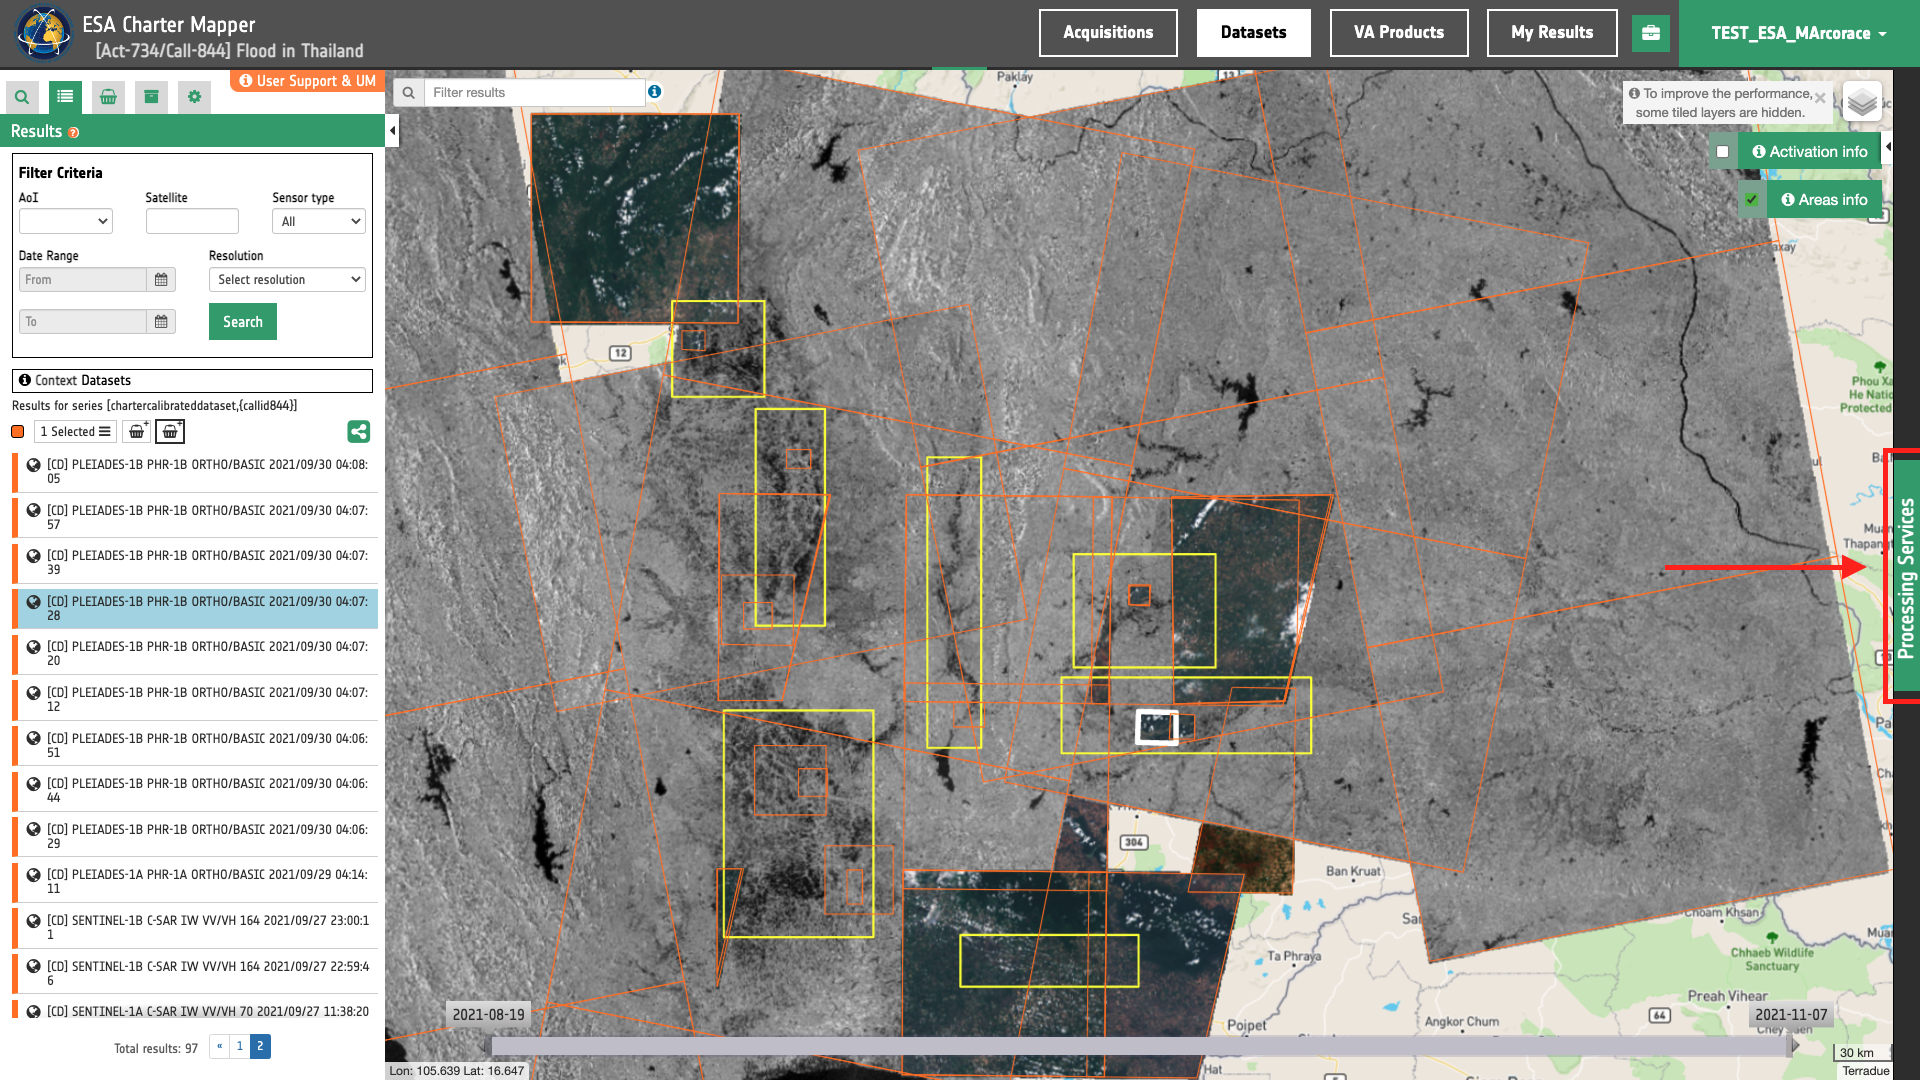
Find the data using multiple filter criterias
-
Select the area for which you want to do an analysis, e.g over the south of Thailand.
-
From the Navigation and Search toolbar (located in the upper left side of the map), click on Spatial Filter and draw a square AOI over the terrritory around Chachoengsao near the Bang Pakong river in Thailand. This spatial filter allows you to select only the EO data acquired over this area.
-
From the top of the left panel, use Filter Criterias to search for “Optical” and "Sentinel-2" data collections from the list.
-
After the query the list will be updates as the one shown in the next image.
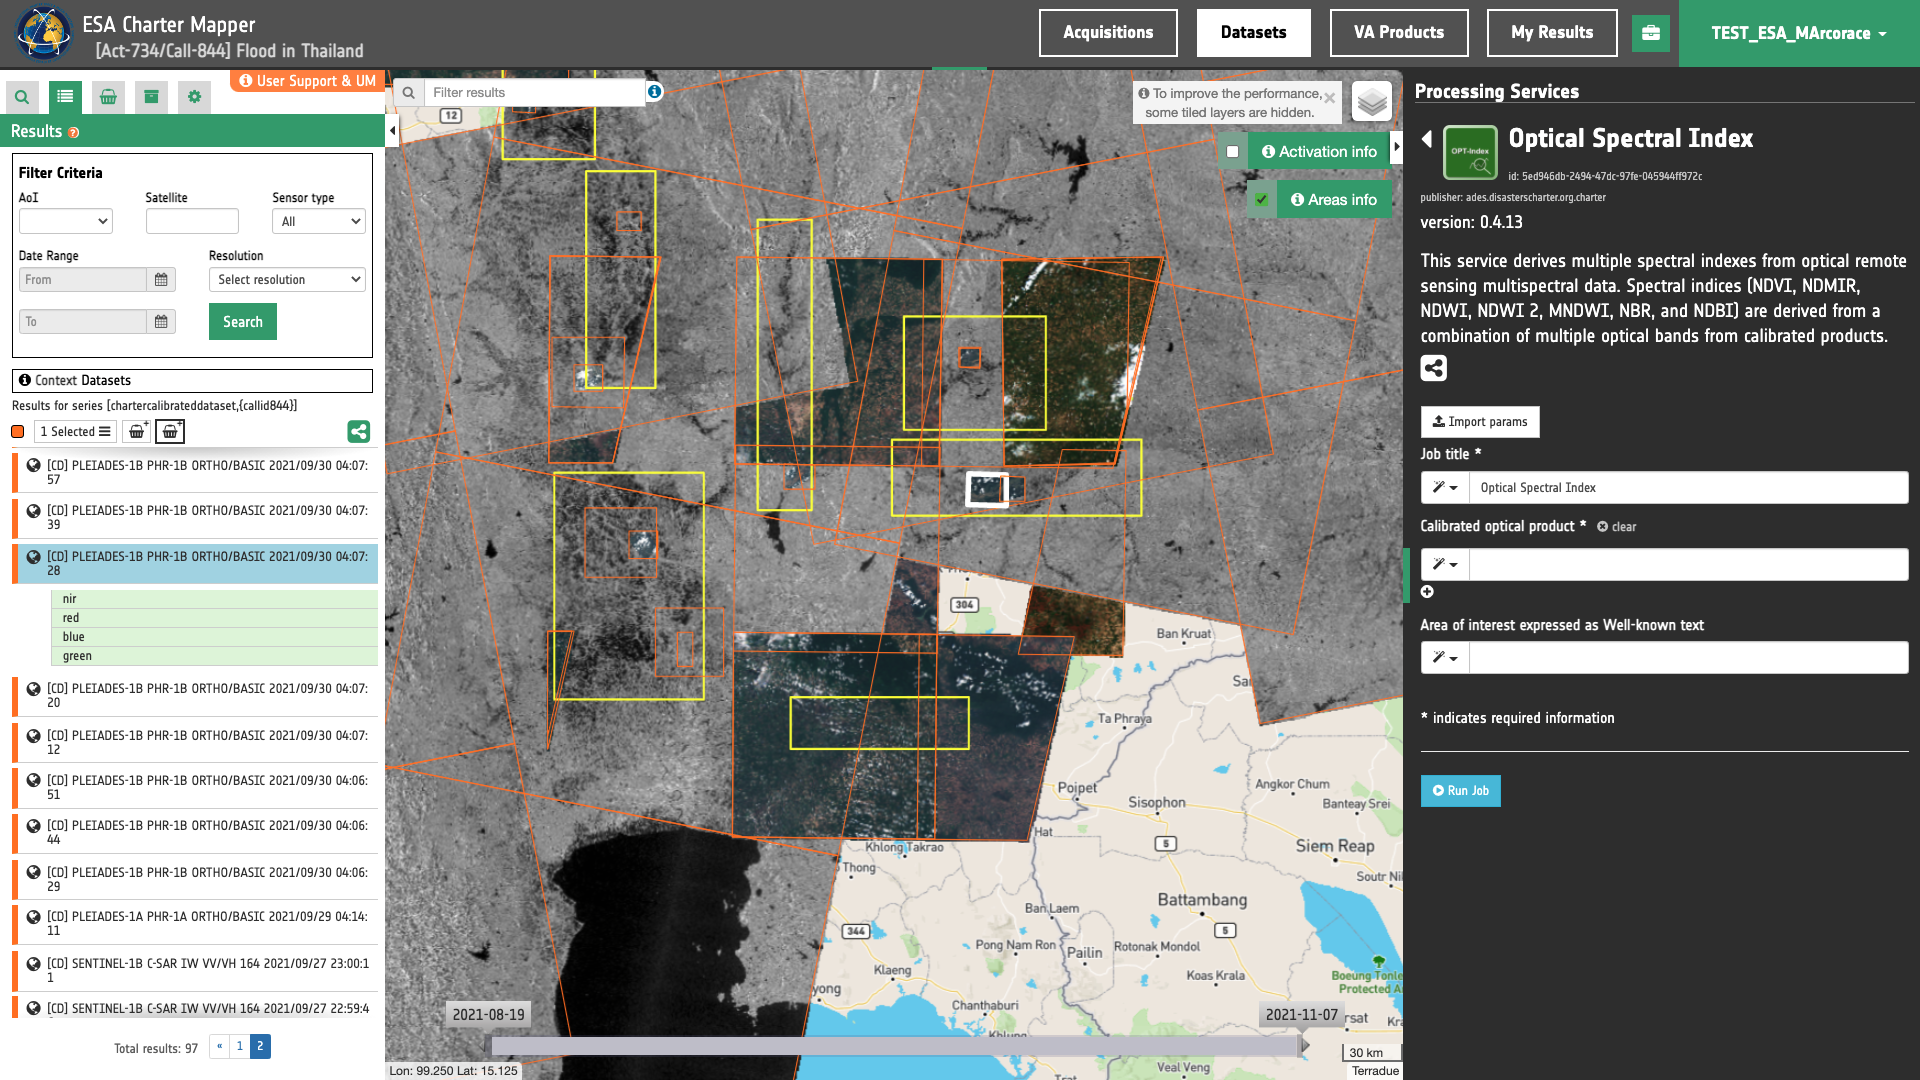
Fill the paramters
After the definition of spatial and time filters, you can employ OPT-Index, by using for example a Calibrated Dataset from Sentinel-2 MSI data.
To do so you can fill the parameters as described in the following sections.
Job name
- Insert as job name:
OPT-Index Sentinel-2 2021/06/20 Chachoengsao Thailand
Reference input
Drag and Drop the selected item in the Calibrated optical product field
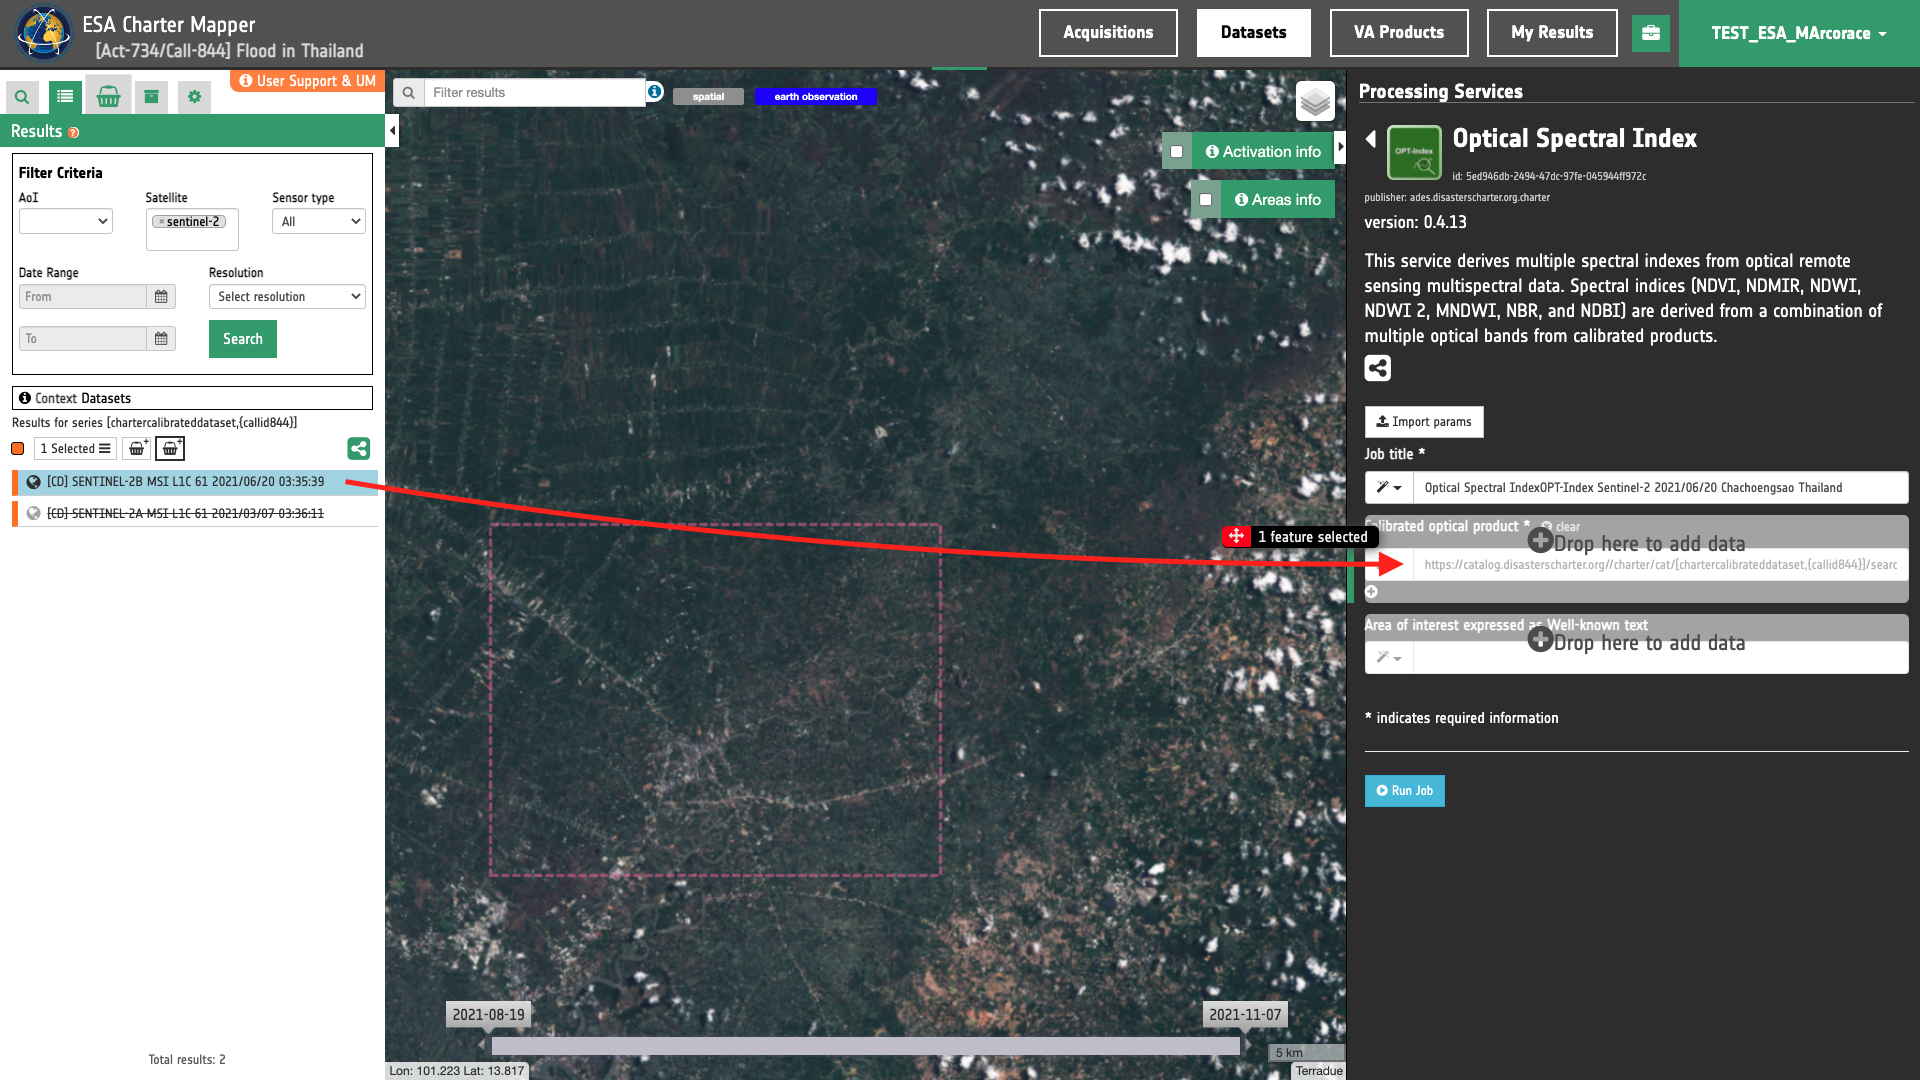
Warning
Drag and drop the Dataset (e.g. "[CD] SENTINEL-2B MSI L1C 61 2021/06/20 03:35:39") and not the single-band asset (e.g. "red") into Calibrated optical product field.
Area of interest expressed as Well-known text
The “Area of interest as Well Known Text” can be defined by using the drawn polygon defined with the area filter.
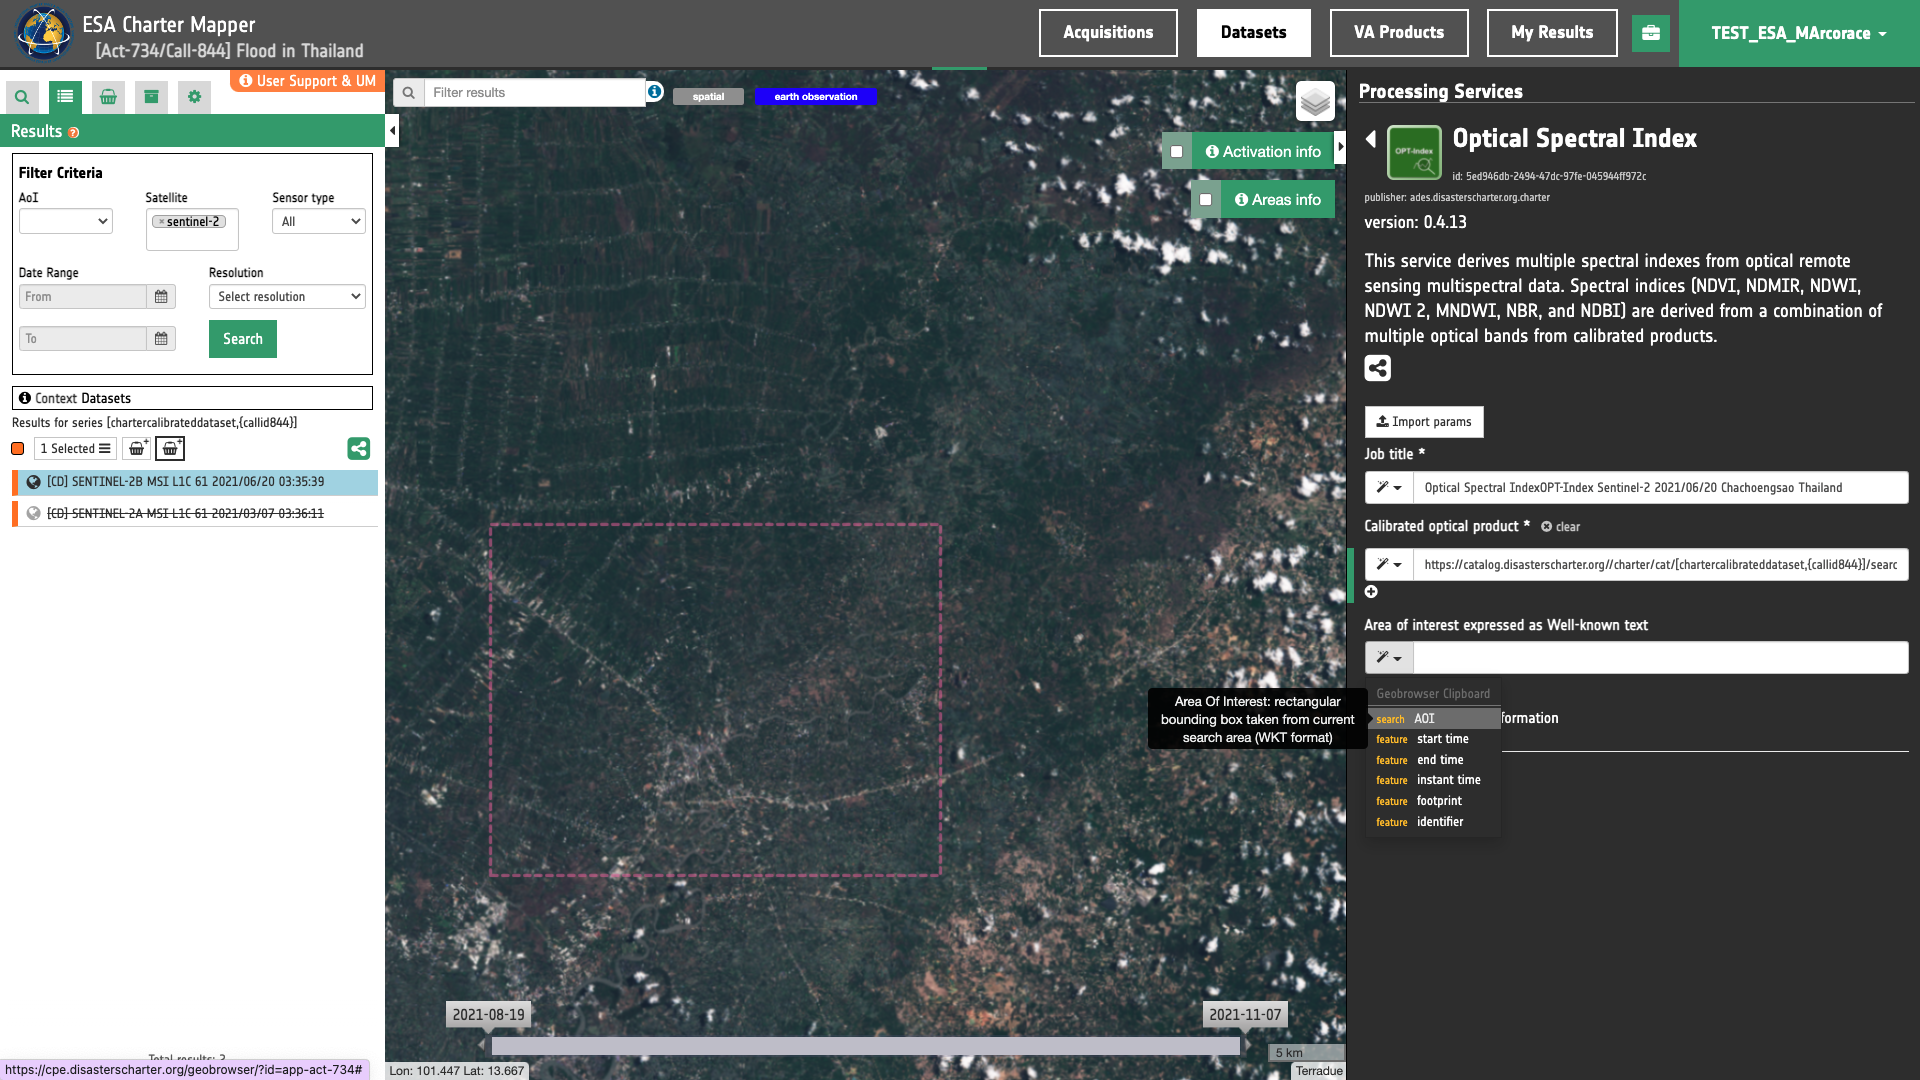
Tip
To automatically define the WKT values click on the Magic tool wizard button in the left side of the "Area of interest expressed as Well-known text" box and select the option AOI from the list. The platform will automatically fill the parameter value with the rectangular bounding box taken from current search area in WKT format.
Note
This parameter is optional.
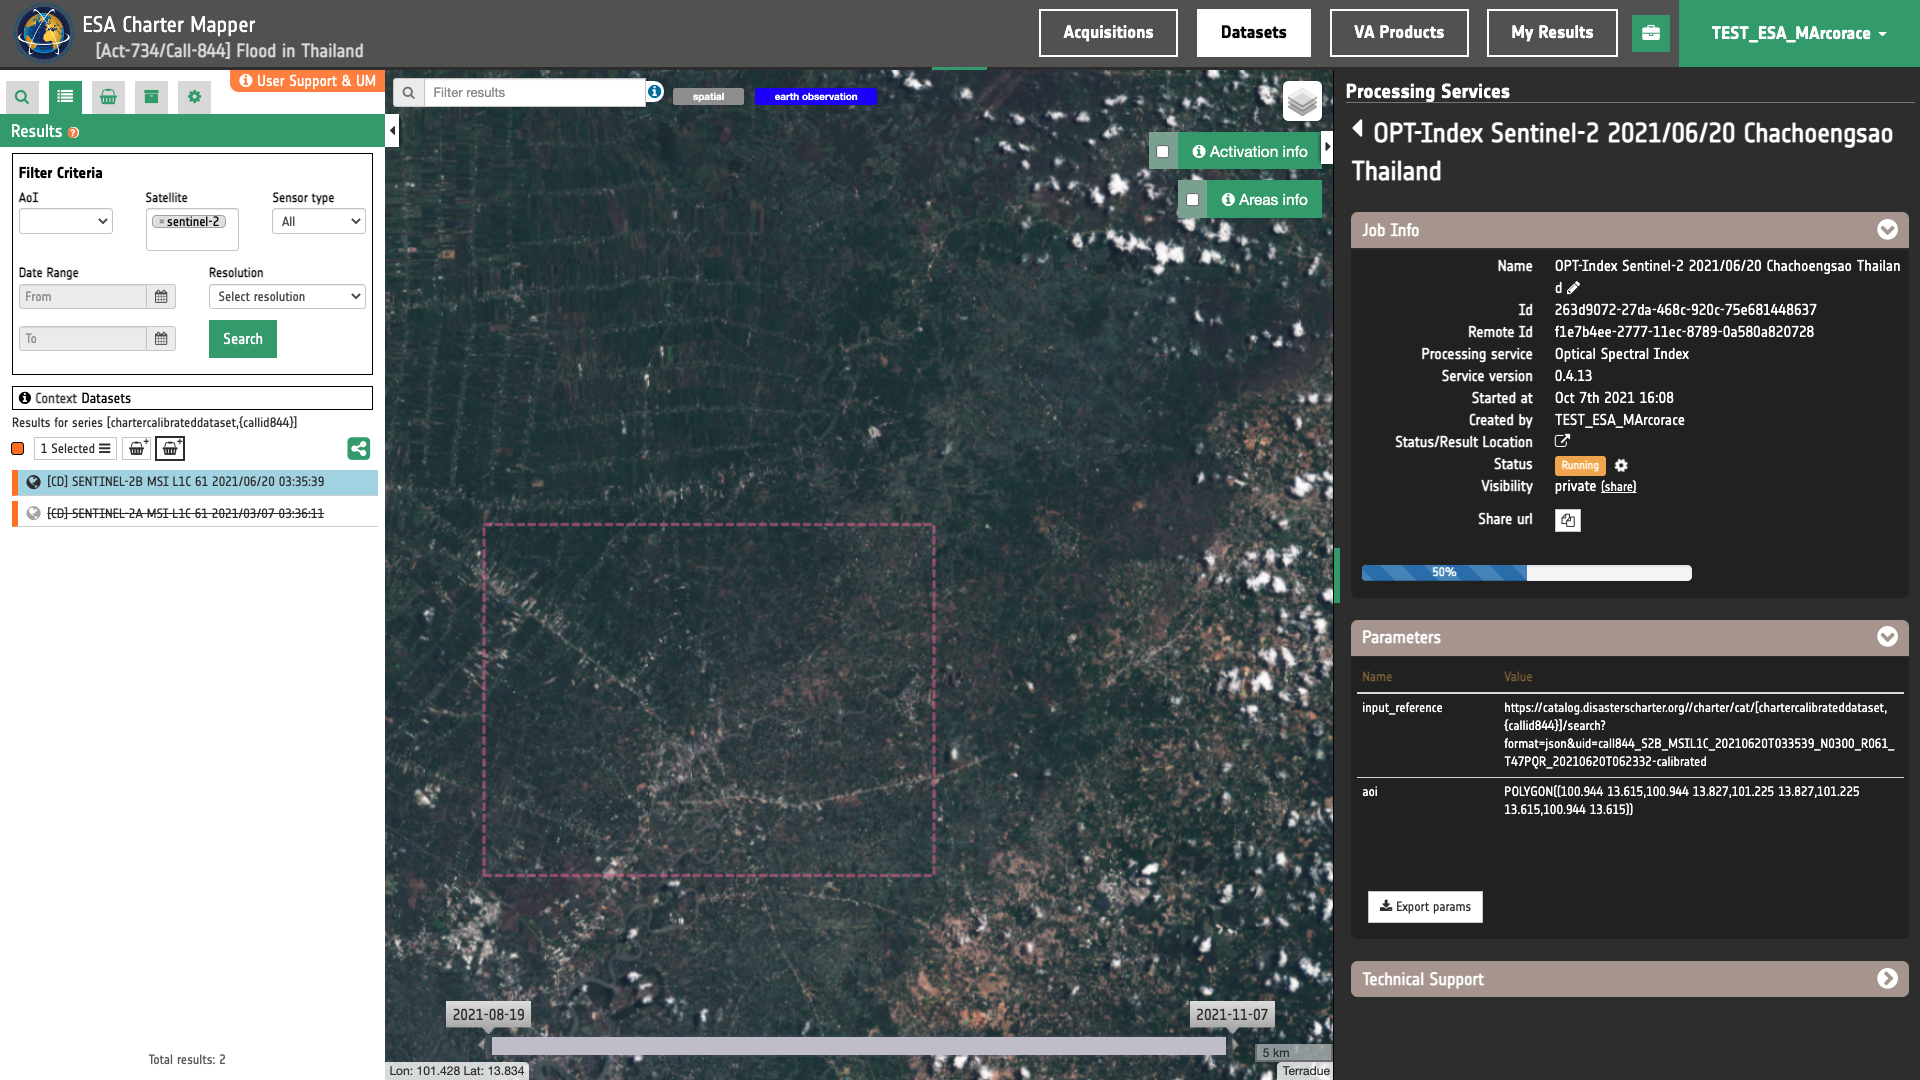
Run the job
Click on the button Run Job and see the Running Job
You can monitor job progress through the progress bar.
Results: download and visualization
Once the job is completed, click on the button Show results at the bottom of the processing service panel.
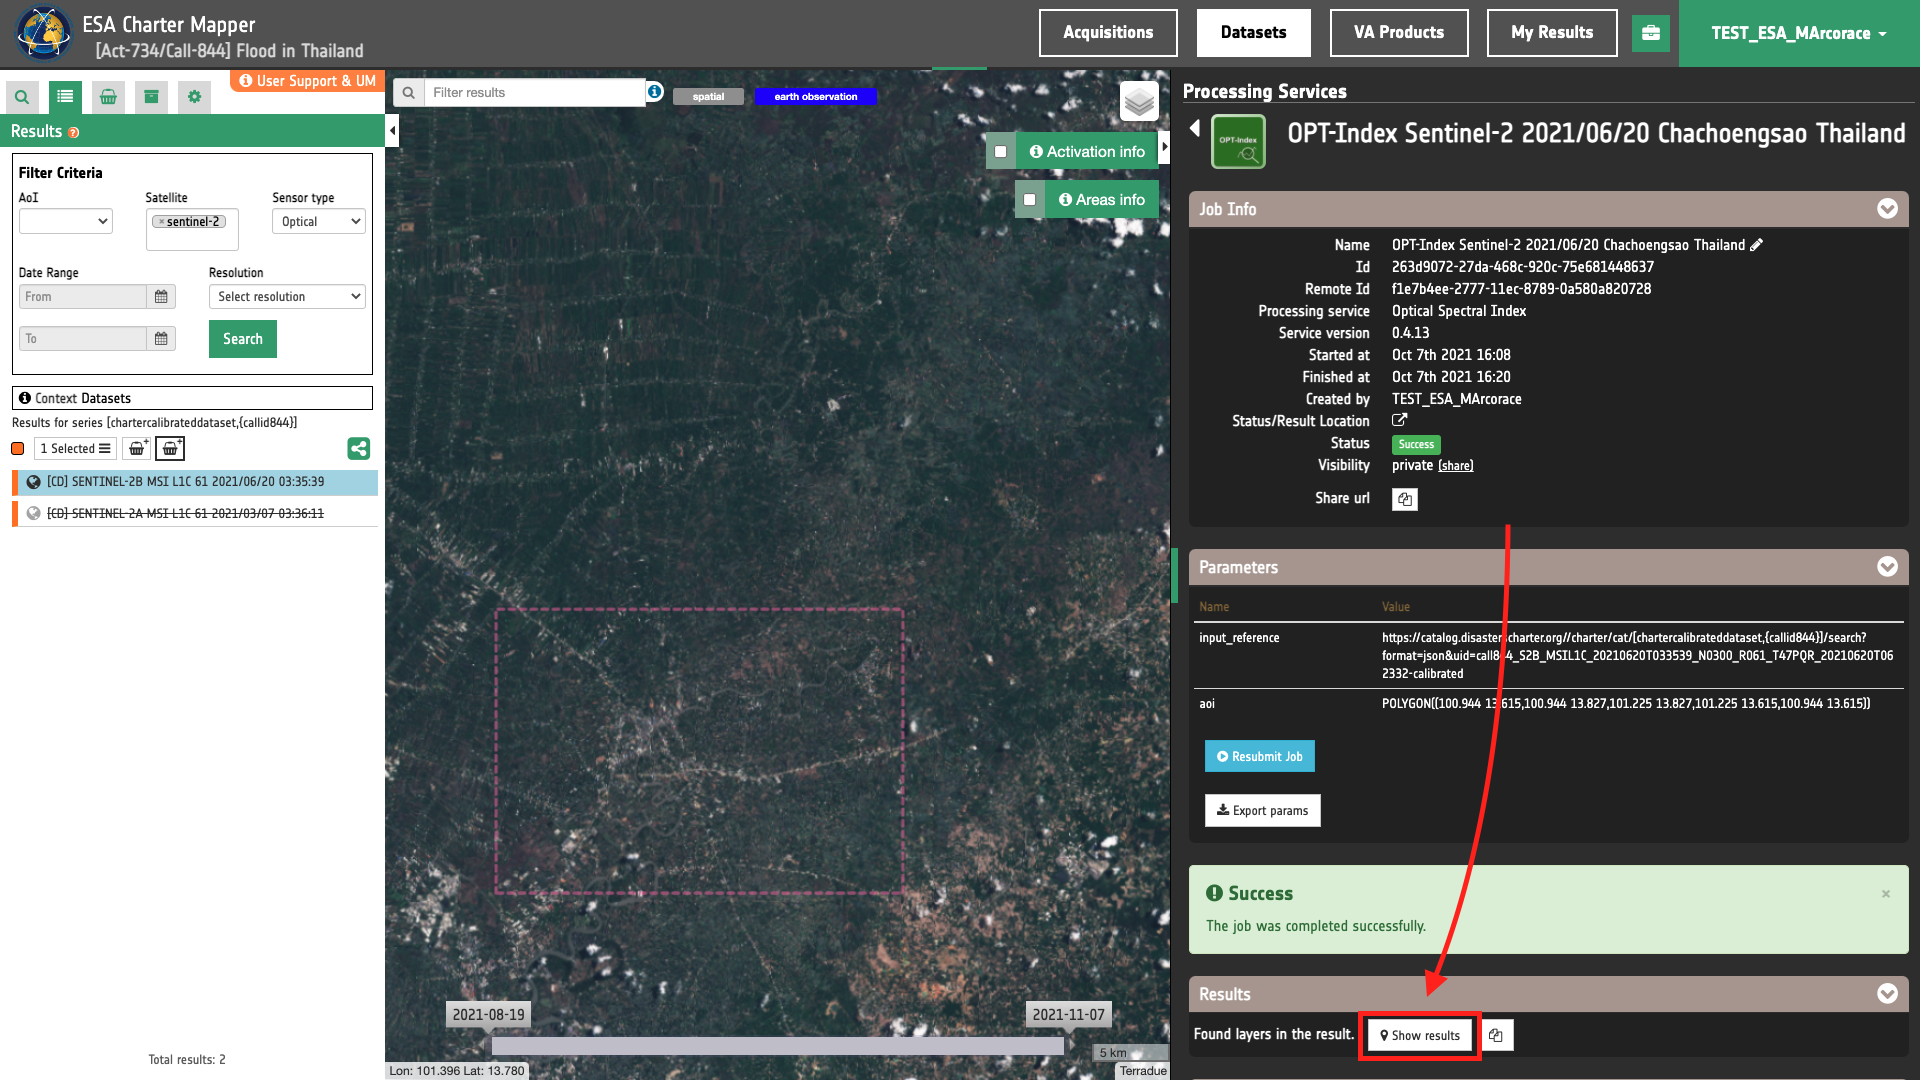
Tip
You can also save the parameters employed in this job by clicking on the Export params button in the right panel. This allows you to copy all your entries to the clipboard. This is meant to be used for a quick re-submission of a similar job after a fine tuning of the parameters (e.g. to add a color formula later).
Below is reported the syntax which includes all the parameters employed in this example.
{
   "input_reference": "https://catalog.disasterscharter.org//charter/cat/[chartercalibrateddataset,{callid844}]/search?format=json&uid=call844_S2B_MSIL1C_20210620T033539_N0300_R061_T47PQR_20210620T062332-calibrated",
   "aoi": "POLYGON((100.944 13.615,100.944 13.827,101.225 13.827,101.225 13.615,100.944 13.615))"
}
Visualization
See the result on the map. The preview appears within the area defined in the spatial filter.
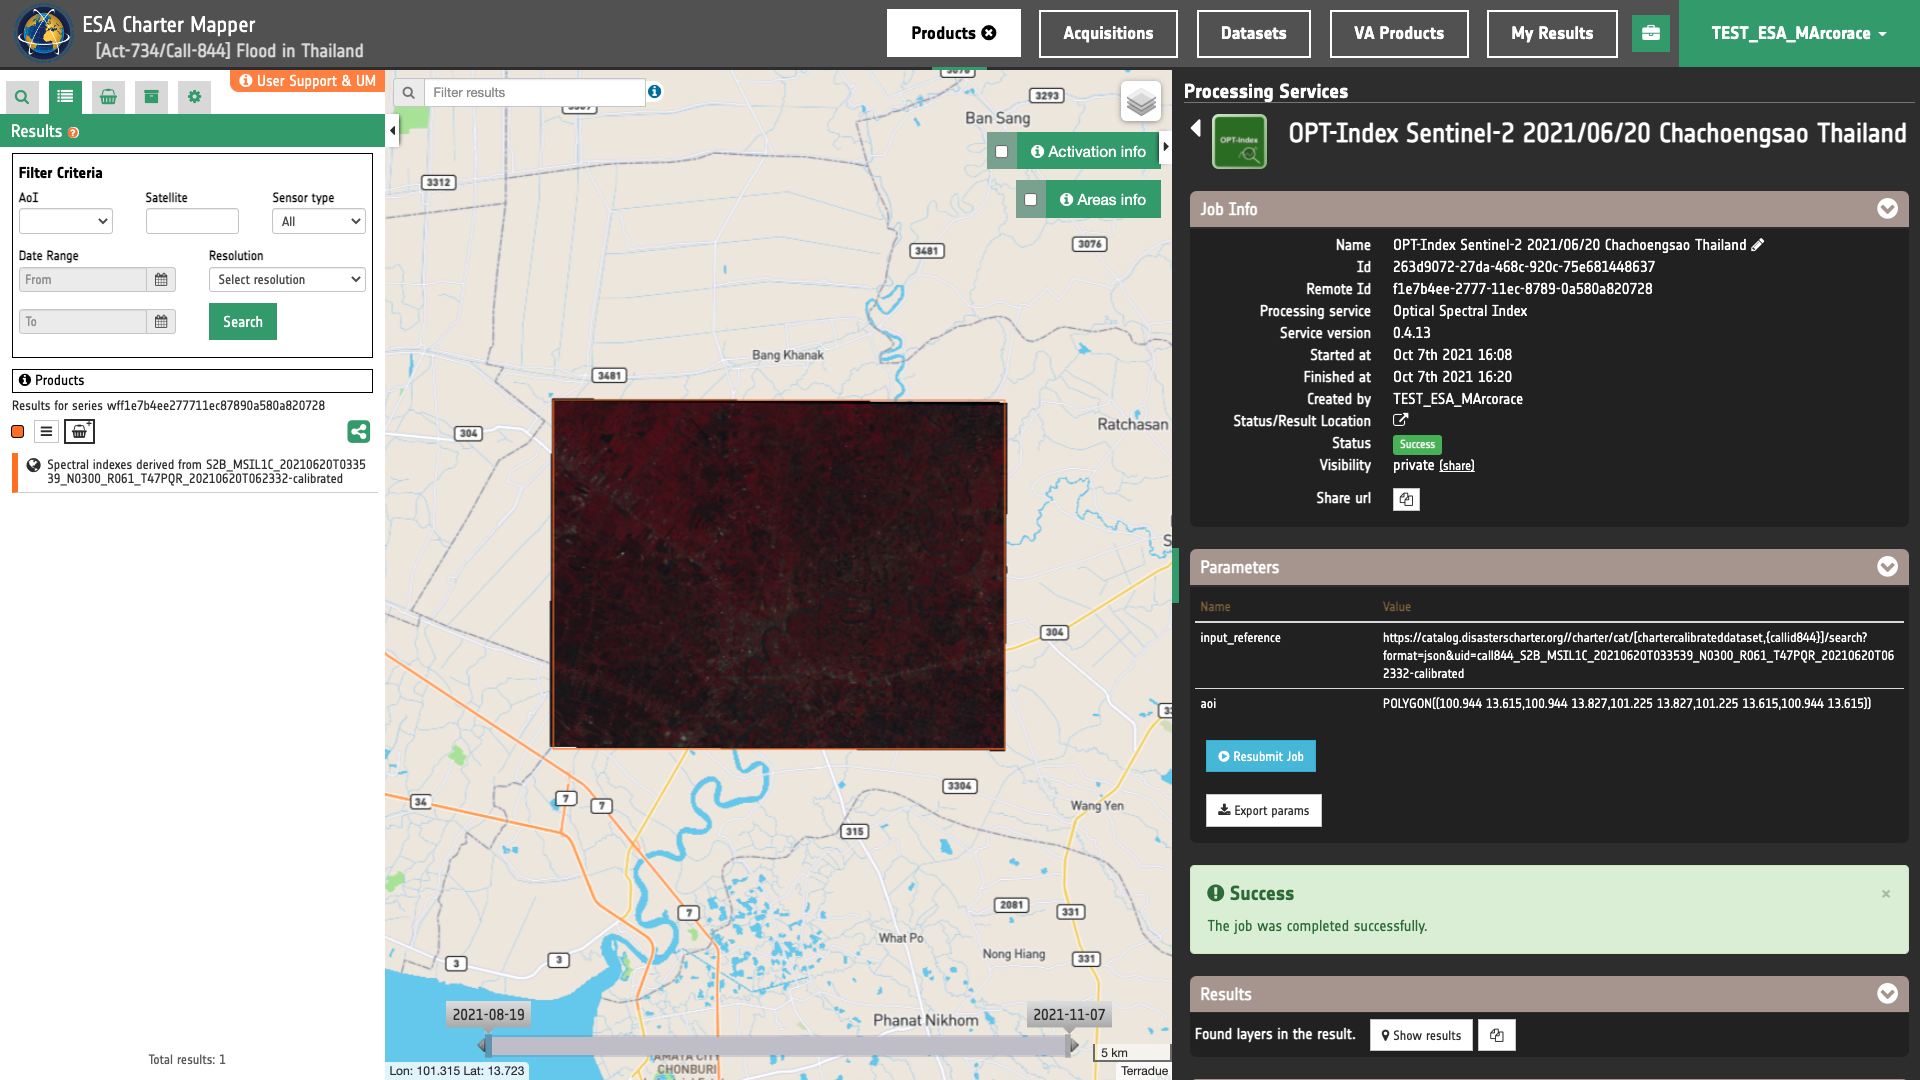
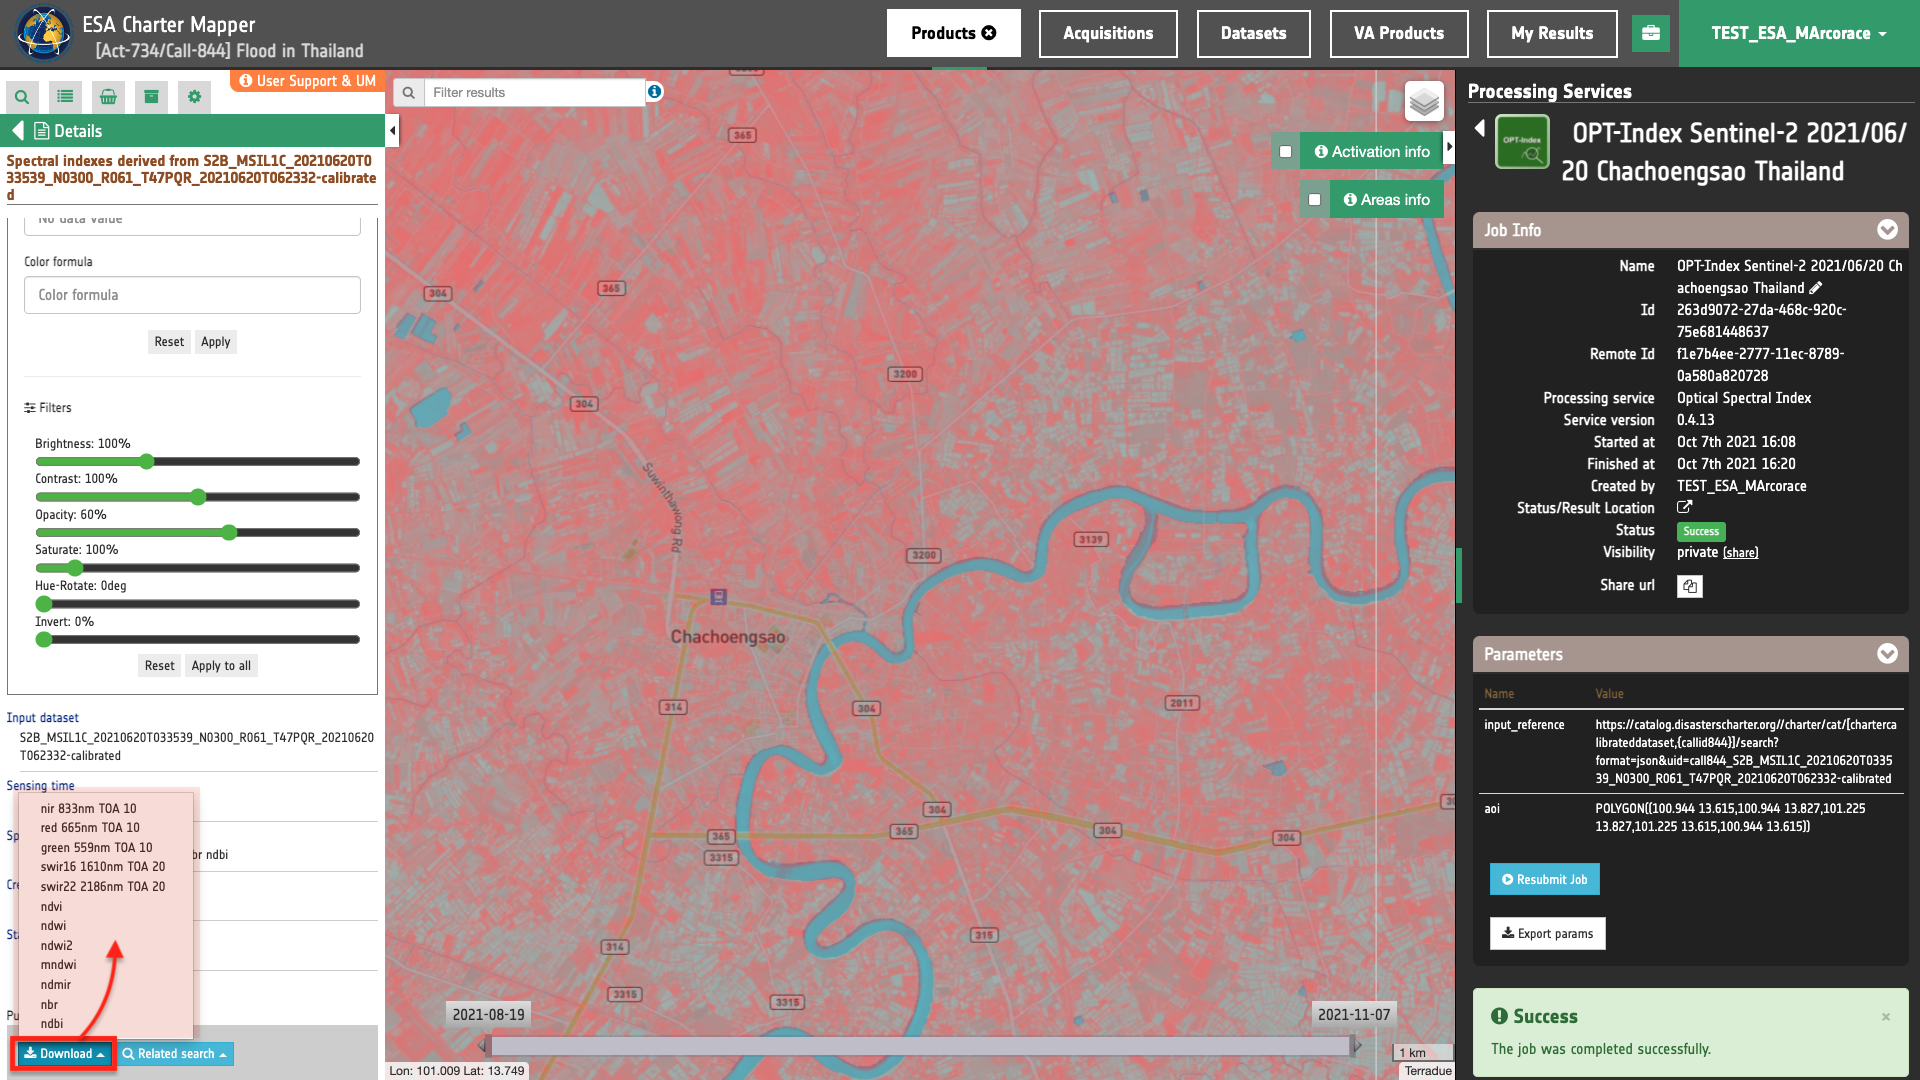
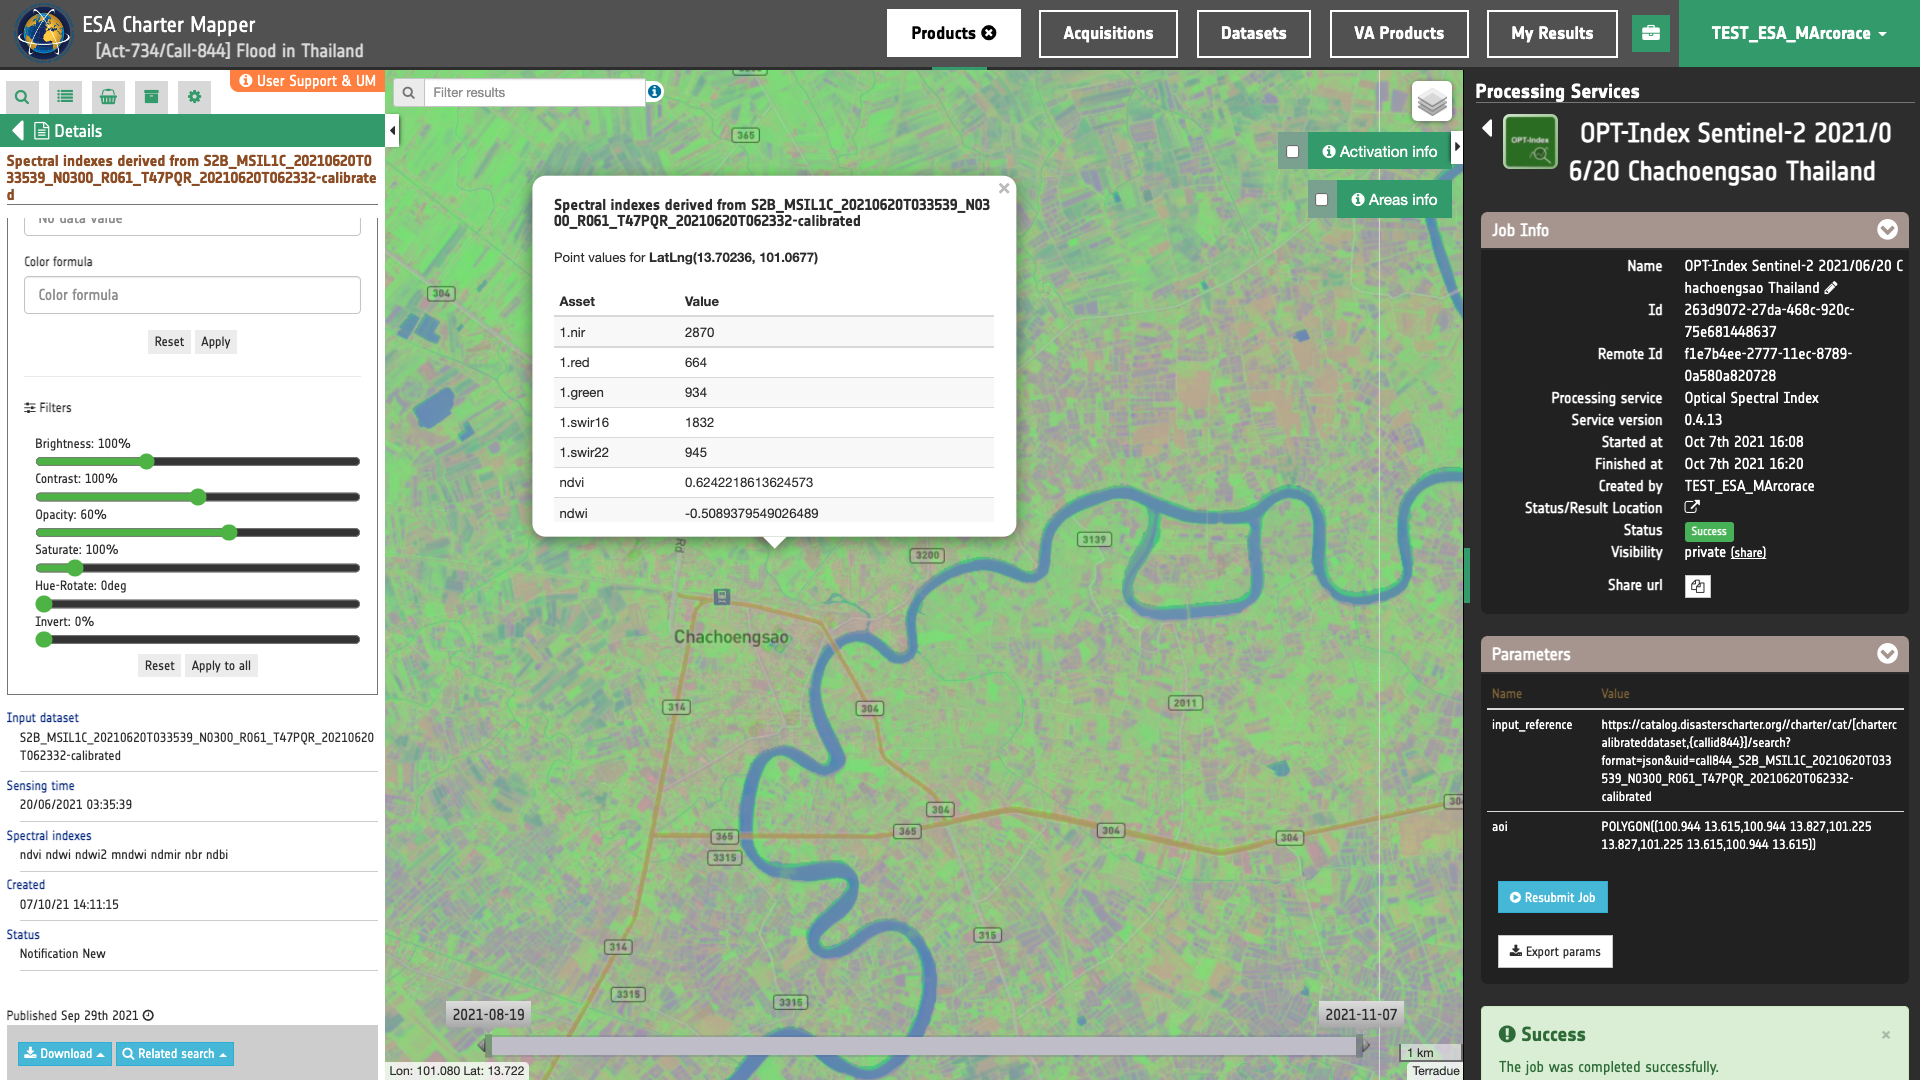
To get more information about the product just click on the preview in the map, a bubble showing the name of the layer “Spectral indexes derived from S2B_MSIL1C_20210620T033539_N0300_R061_T47PQR_20210620T062332-calibrated” will appear and then click on the Show details button.
Tip
To quickly access Product Details double click on the layer from the Results list.
In the left panel of the interface, the details of Job Result will appear with Product metadata. Furthermore by clicking on Layer styling you can also access to the View options. In here it is possible to see histogram/s of the Product which is visible in the map, set color formula, change Filters (e.g. Brightness, Opacity).
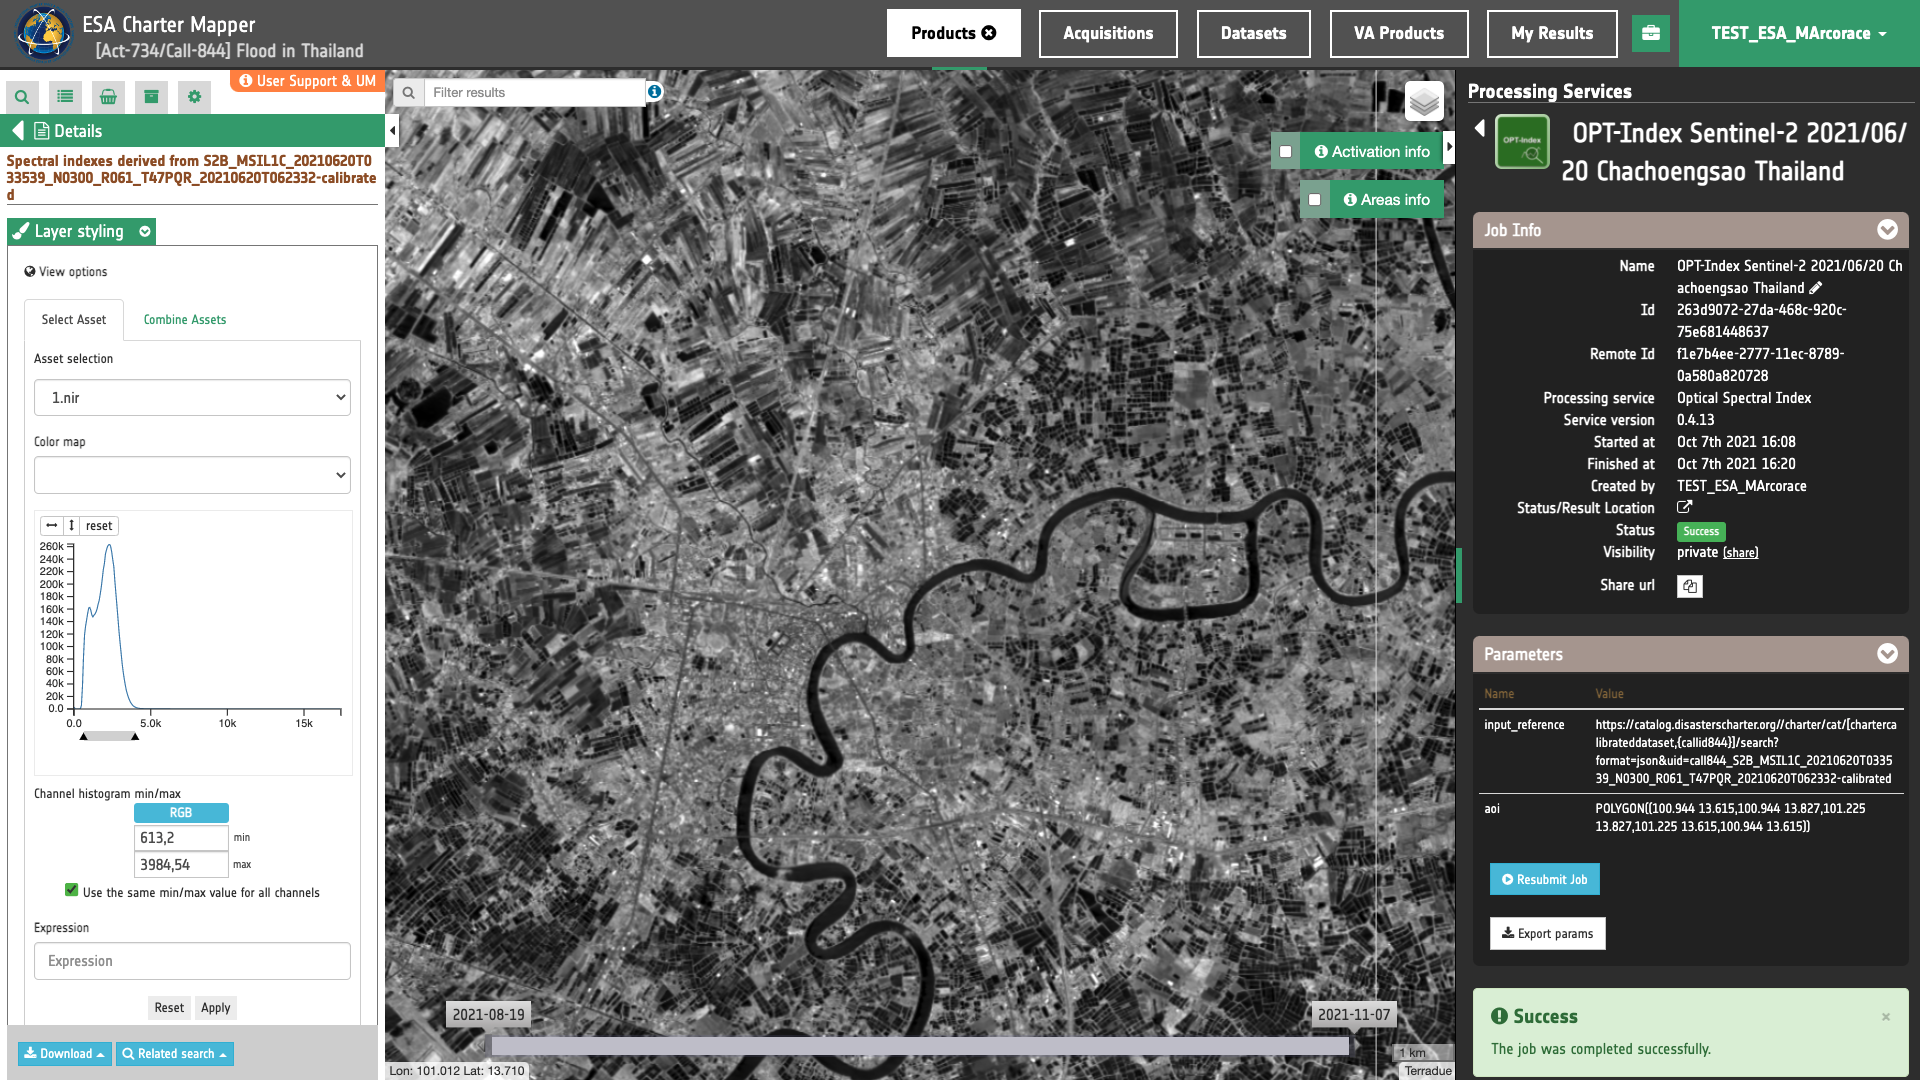
Tip
To visually compare the product overview with the underlying base layer (e.g. Natural Earth or Dark map) you can set the Opacity filter under View options as 60%.
It is also possible to customize the overview on the fly by clicking on Layer Styling and Combine Assets. Min and Max values can be changed for RGB histograms.
Tip
Under Combine assets it is possible to create RGB composites on the fly using the obtained spectral indexes. Example it is possible to apply the following RGB combination:
ndvifor RED-channel,ndwifor GREEN-channel and BLUE-channel.
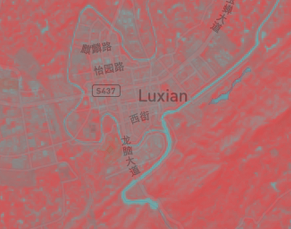
Another one is the following or the following:
ndbifor RED-channel,ndvifor GREEN-channel,ndwifor BLUE-channel.
Please note that the second one is possible only for Calibrated Datasets having swir assets (e.g. Sentinel-2 MSI or Landsat-8 OLI).
Note
To get the value in a point of interest from one or more assets from the OPT-Index result right click on a pixel in the map and click on Get point values.
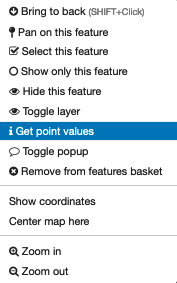
A popup window will appear by showing the values of all assets (e.g. nir, green, ndvi, etc.) for the given coordinates.
Download
In the Optical Spectral Index (OPT-Index) service the following files are produced:
- 1.nir: asset
nirproduct from reference image as single band GeoTIFF in COG format, - 1.red: asset
redproduct from reference image as single band GeoTIFF in COG format, - 1.green: asset
greenproduct from reference image as single band GeoTIFF in COG format, - 1.swir16: asset
swir16product from reference image as single band GeoTIFF in COG format, - 1.swir22: asset
swir22product from reference image as single band GeoTIFF in COG format, - ndvi: NDVI spectral index given as single bands Float32 GeoTIFF in COG format,
- ndwi: NDWI spectral index given as single bands Float32 GeoTIFF in COG format,
- ndwi2: NDWI2 spectral index given as single bands Float32 GeoTIFF in COG format,
- mndwi: MNDWI spectral index given as single bands Float32 GeoTIFF in COG format,
- nbr: NBR spectral index given as single bands Float32 GeoTIFF in COG format,
- ndbi: NDBI spectral index given as single bands Float32 GeoTIFF in COG format.
Note
Assets generated from the OPT-Index depends on the spectral resolution of the input Optical calibrated Dataset. Therefore, 1.swir16, 1.swir22, ndwi2, mndwi, nbr, ndbi assets can be generated only for optical missions having swir bands (e.g. Sentinel-2 MSI and Landsat-8 OLI).
These products can be downloaded by clicking on the Download button located at the bottom of the Product Details tab in the left panel.