Geobrowser tools and features
Navigation
The zoom in and out buttons are placed in the top left corner of the map.
Box zoom
To quickly zoom in a specific area of the map hold the SHIFT button and drag a rectangle on the map. After that the geobrowser will directly zoom on the drawn bounding box.
Check out the below video to know how to navigate in the ESA Charter Mapper workspace map using zoom in/out, pan and the box zoom function.
Point Info
With a right-click on an empty point on the map a context menu will open to show some actions like Center map here (pan in the selected zone on the map), Zoom in, Zoom out, and a useful utils Show coordinates. This utils will show a popup with information about the coordinates of the point selected on the map, in different formats.
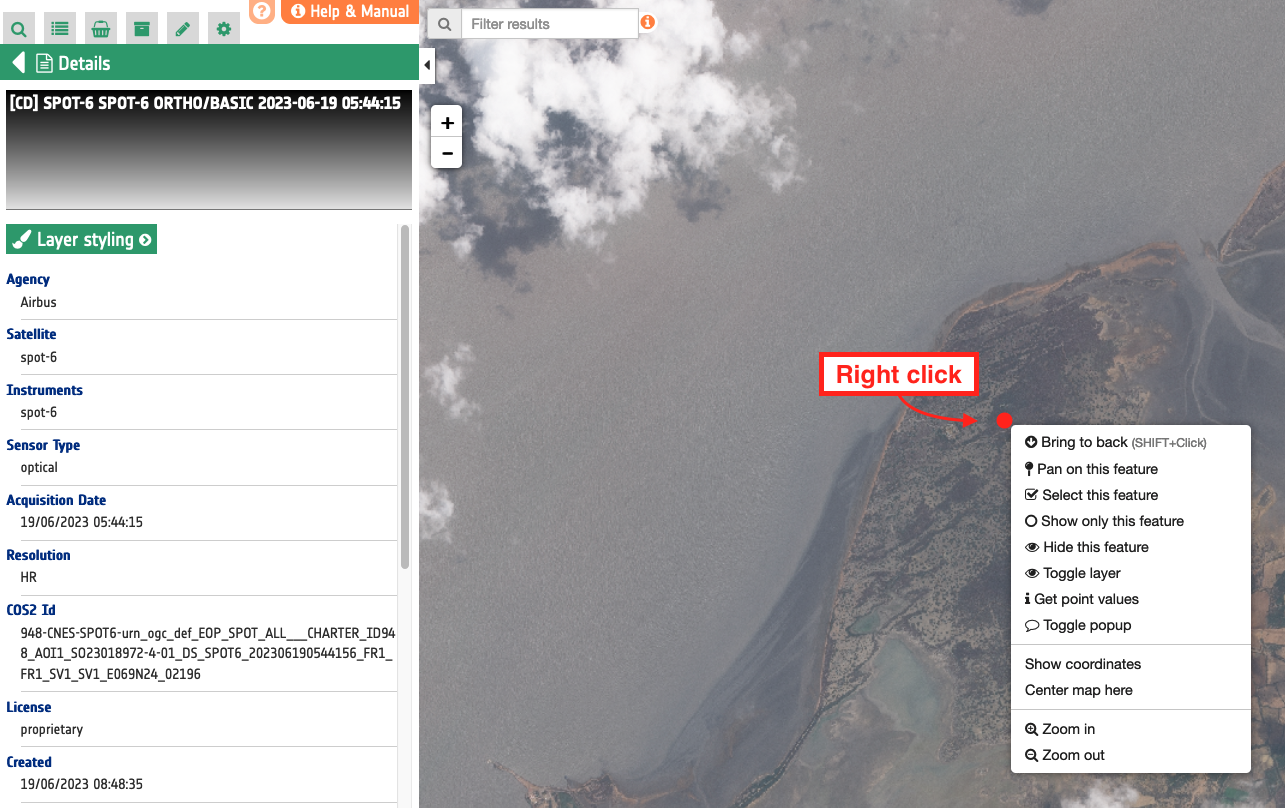
The Get point value util reports pixel values of all assets included in the feature (e.g. a Dataset) at the point. This util will show a popup with a table (e.g. Point values for LatLng(23.71527, 68.55881)) listing all the values of all assets.
Search
Navigation and Search Toolbar
To simplify the user view on the map, some of the map tools buttons are hidden by default. Only zoom in and out buttons are visible by default on the map. To show the others, simply move the mouse cursor to the left side of the map.
Tip
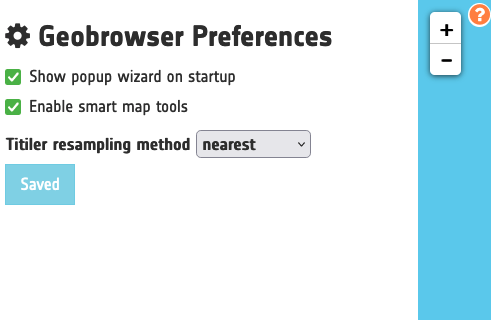
To set all toolbar permanently visible in the map, from the left panel open the Preferences tab.
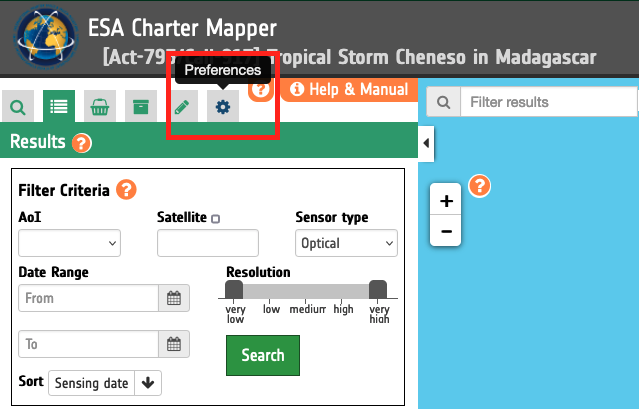
Uncheck the Enable smart tools option and click on Save button to set them all visible in the map.
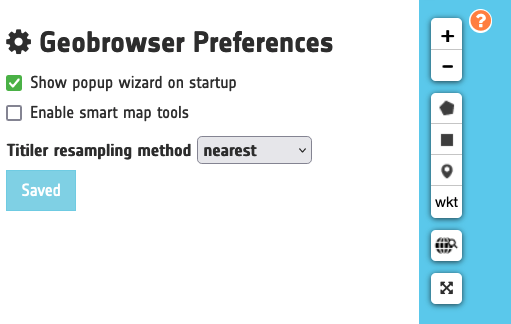
To set map tools buttons hidden as before check the Enable smart tools option and click on Save button.
Spatial Filters
Some Opensearch Descriptions have special standard parameters, for some of them the Geobrowser has a set of widget to allows users to easily and visually change the parameter values. For example, the filter by rectangle (geo:box parameter) and the filter by a custom shape in WKT (geo:geometry parameter)) have some spatial buttons inside the map tools. From these controls, users can directly draw on the map the shape to perform the spatial query.
-
 Draw a polygon: edit the search area by drawing a polygon on the map,
 -
 Draw a rectangle: edit the search area by drawing a rectangle on the map,
 -
 Draw a marker: edit the search area by selecting a point as AOI,
 -
 Custom WKT - integrate existing AOI: enter a WKT or upload a shapefile, a kml or a geojson to be displayed on the map as a search area.
Note
Once a spatial filter is applied a small filter control icon named spatial is displayed in the upper portion of the map, next to the Search Terms box. More details in this section.
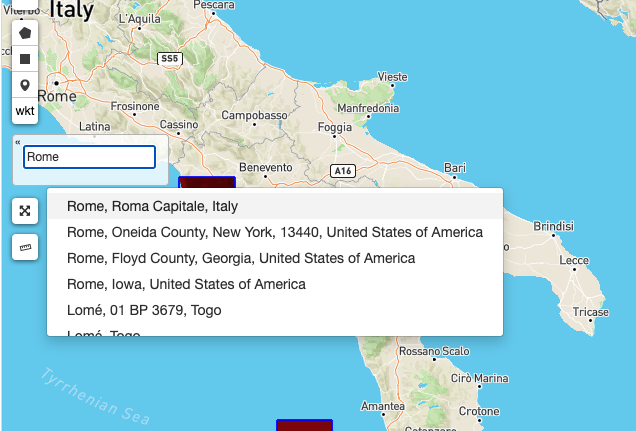
Search by location
The Search by location control allows users to:
- find some places on the map (giving a place text);
- perform a spatial query on the data by a place found.
A place text could be a country, a city name, a street, a mountain, a river, and so on.
Full Screen
A simple button to switch to full screen.
Time Slider
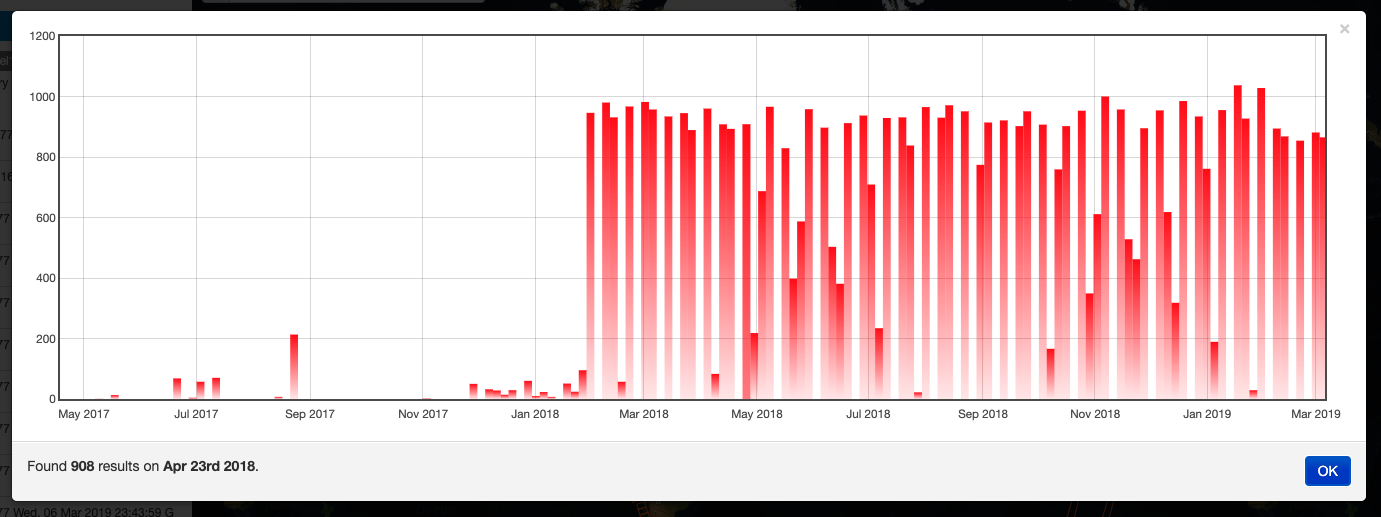
If the Current Opensearch Description exposes the standard temporal query parameters (time:start, time:end), and if the thematic app allows it, a Time Slider is added on the bottom of the map.
This widget is useful to visually select a time range for a time restriction on the current search. Moreover, the Time Slider contains visual representation of the data distribution over the time.

Search Terms
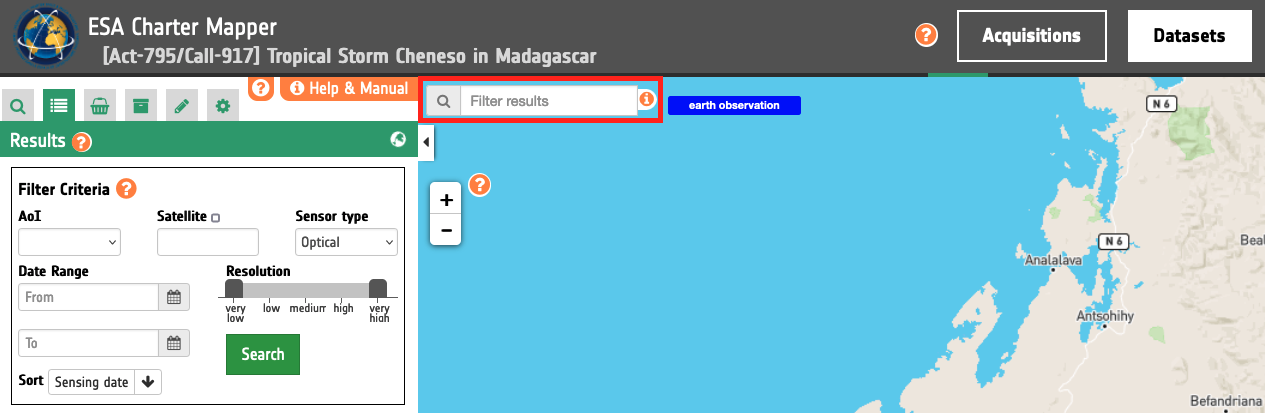
The Search Terms is a default standard Opensearch Parameter. The geobrowser represents this with a simple input text widget, always visible on the top left of the map. It's a "keypress" triggered input, users don't need to press a confirmation after typing, the search is automatically launched as users stop to type the text to search.
Advanced search filters
A search of EO data can also be accomplished by using the Filter Criteria available in the Results tab and the advanced search form available in the Search tab.
Check out the below video to know how to employ advanced search filters.For instance how to find a cloud-free image over an AOI to be imported as reference from an Open and Free EO data catalogue.
Manage the search filters
Once you have performed a search, all filters used for this search are displayed in the upper portion of the map, next to the Search Terms box, as multiple small filter control icons of different colours. These filter control icons are grouped by type of filter (e.g time, spatial, earth observation, ...).
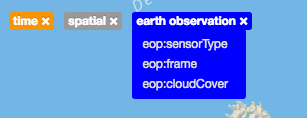
You can then remove one filter by clicking on the x button. remove the whole filter group or check the selected value (go over with the mouse for a few seconds).
![]()
Also by clicking on the lock button it is possible to maintain the search filter while switching among different data contexts. As an example, this allows the user to employ the same spatial filter when searching for features under Acquisitions, Datasets or Results.
Dataset exclusion
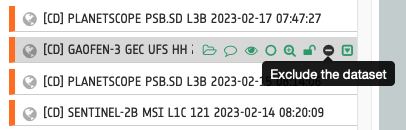
The geobrowser offers to PM/VAs users an utility to exclude not useful datasets from the collection of an activation workspace. With the exclusion of a dataset, the feature will be hidden from the list of available datasets of the Activation.
After the selection of a dataset it is also possible to segregate a dataset by clicking on the Exclude the dataset feature button which appears after a mouseover on the feature.
After the click on Exclude the dataset a popup window will appear saying If you proceed with the exclusion of the dataset [CD] XXXX, it will be hidden from the list of available data relative to the Activation.
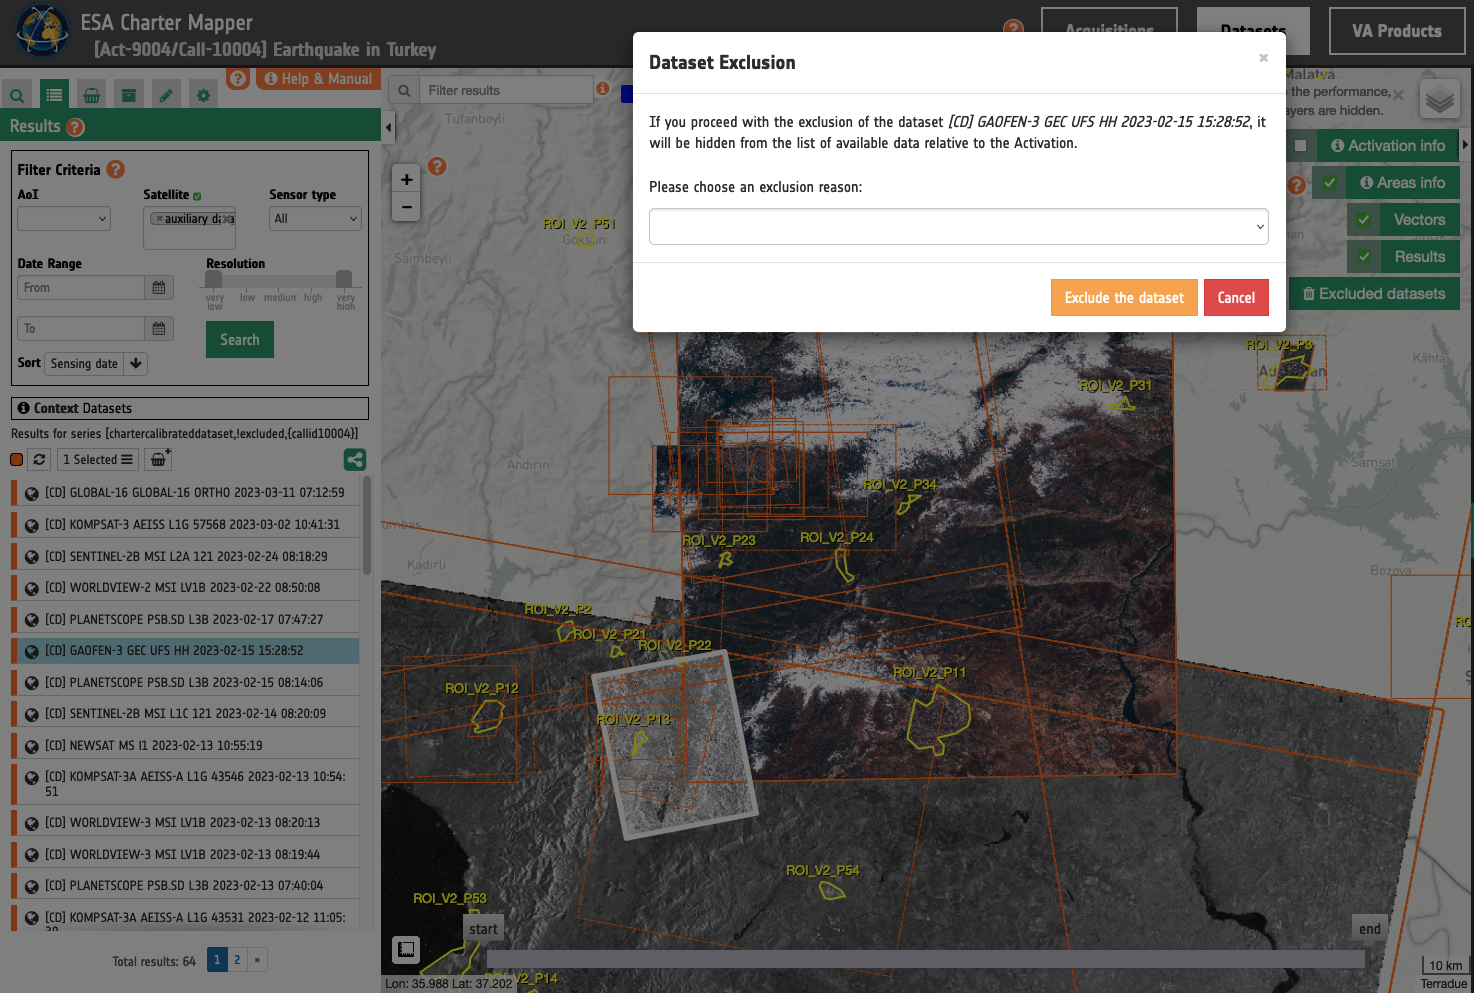
At this stage the user must select one of the following exclusion reasons:
-
NotUseful
-
OutOfArea
-
HeavilyCloudy
-
TotallyCloudy
-
Cloudy
and then click on Exclude the Dataset button.
After the exclusion the dataset is assigned to the Excluded Datasets collection and is not anymore available under the Datasets one.
The Excluded Datasets widget, which is available in the top right part of the map, provides the full list of Datasets excluded by the users in the activation workspace. When the user clicks on this button the Context Menu switches to the Excluded Datasets collection and the Results tab is showing the list of segregated Datasets.
If needed it is possible to import the excluded product back to Datasets by clicking on the Include the dataset feature button .
Visualization
The geobrowser can show multiple raster tile layers if there are features (e.g. Datasets and Results) exposing tiled layer information on the current search result. Currently it manages WMS and TiTiler services.
Swap overlapping layers
When multiple overlapped layers are displayed over the same area it could be difficult to select a specific layer from the map. To have much control on the overlapped layers on the map there is a little interaction tool to directly put the first visible layer on the bottom.
By doing SHIFT+click on the active layer, the layer will be swapped behind other overlapped layers, showing the layer immediately under the previously clicked one.
Furthermore, if users continue to perform SHIFT click, all overlapped layers will be on the top, one by one.
Vertical slider bar
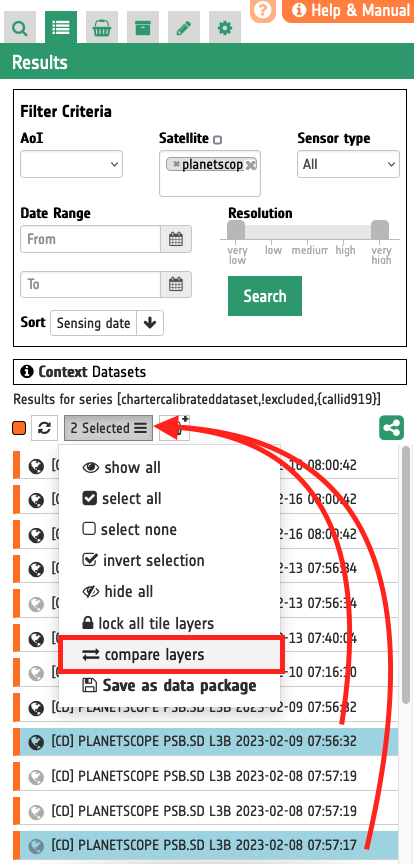
If two or more features exposing tile layer are selected, a new menu item is added on the features selecting dropdown menu (the button located on top of the list in the Results panel): the Compare Layers button.
The below image shows a sample usage of Compare Layers function of the ESA Charter Mapper for the visual comparison of a pair of Sentinel-2 data products with the vertical slider (Image credit: Copernicus, ESA)
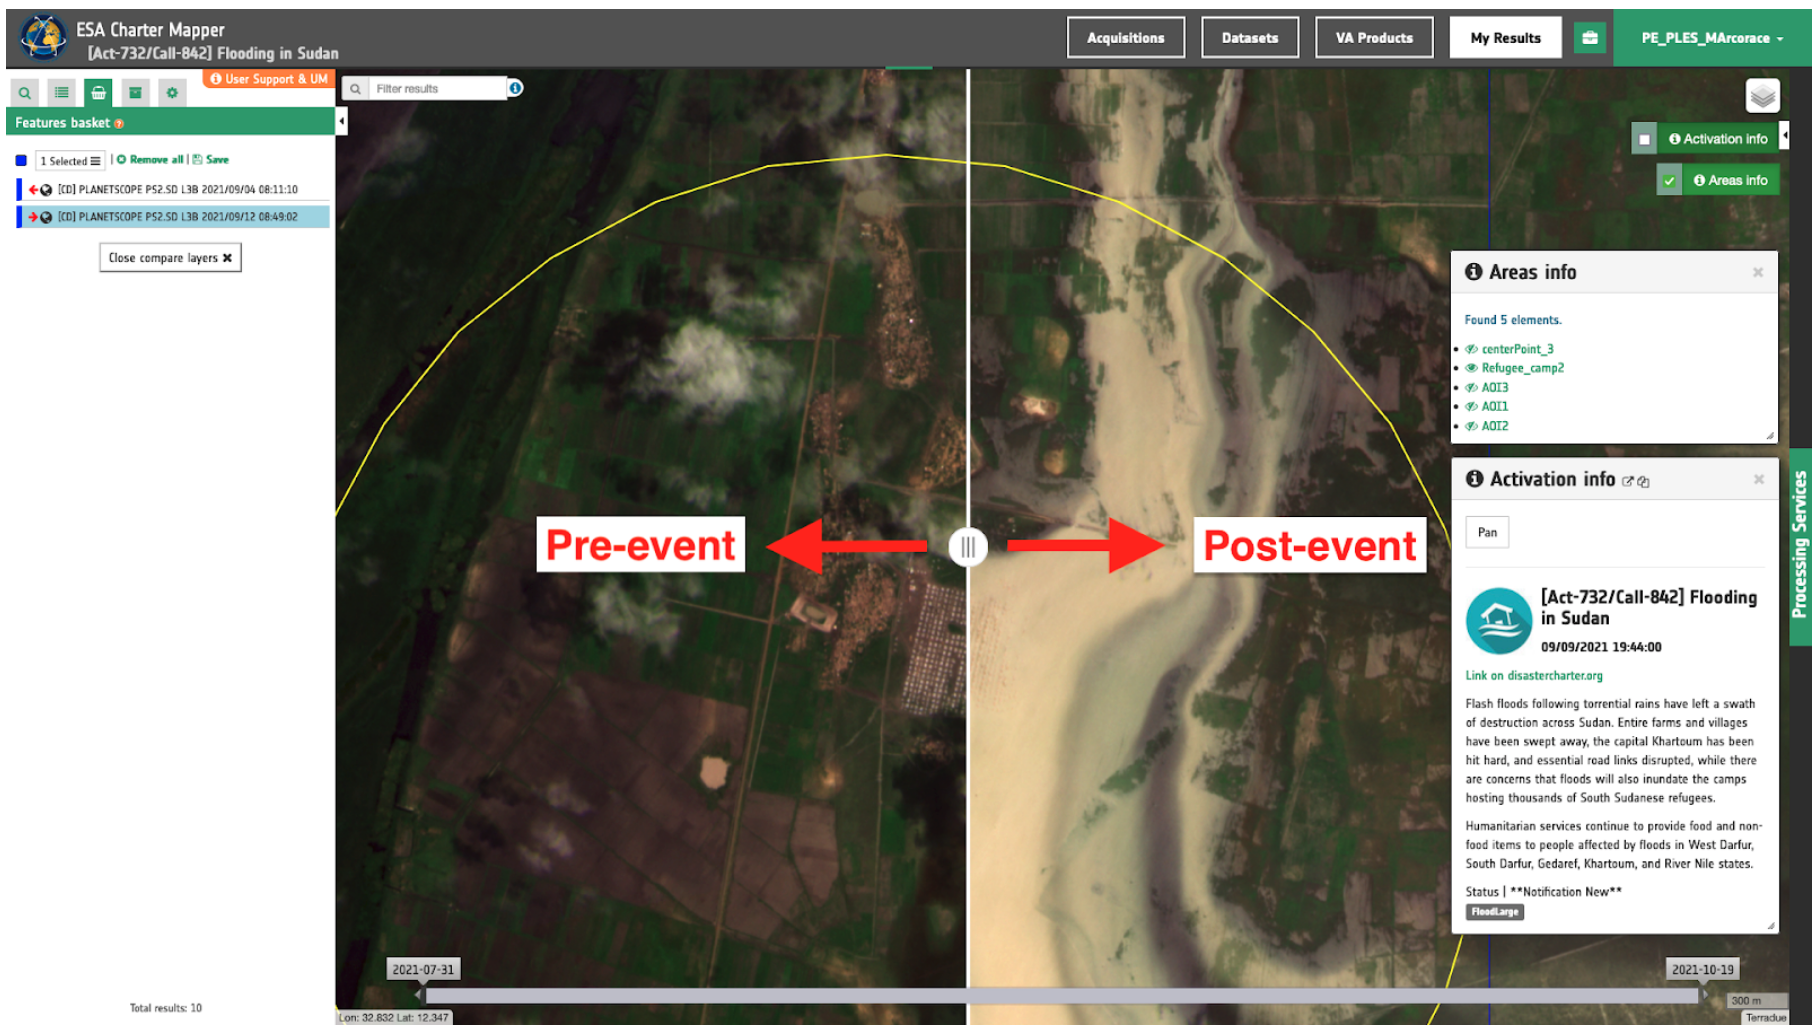
By pressing this button an interactive visual comparing tool is opened, showing only the selected layers with a Vertical Slider Bar. This tool is useful for juxtaposed layers to allow easy comparison and detection of changes.
Hint
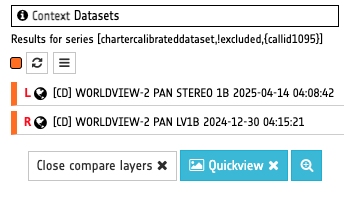
To stop the visual comparison and go back to the Results list click on the Close compare layers button available in the left panel.
Note
The Quickview button triggers the dedicated functionality for the Quickview Image Production.
Note
Once the user triggers the compare layers functionality the platform keeps the current pan & zoom settings. To zoom to the full extent of the images the user can click on the Lens icon button available in the left panel.
Hint
L and R indicators in compare layers mode are placed next to the title of the two features to understand which is the left and the right image when comparing them with the slider.
Note
In the compare layers mode, after a click on the left or right image it is possible to access the details box pop-up.
When only one feature is selected, the features selecting dropdown menu (the button located on top of the list in the Results panel) offers to users the following options:
-
Compare Layer with base map - allowing to visually compare an asset from a dataset listed in the Results panel against the current baselayer (e.g. Satellite Imagery layer selected from the button located in the top right corner of the map):
-
Vertical Slider Bar - allowing to visually compare two intra-sensor assets from the same calibrated dataset (e.g.
nirVSred) or two assets from the same Result of a service (e.g. the flood map against the post-event backscatter).
Check out the below ESA Charter Mapper silent video explaining how to compare RGB composites from pre- and post-event calibrated datasets with the vertical slider bar.
Layers control
On the top-right of the map there's the layers control: collapsed in a button, by going over it a panel will expand, showing the list of all layers and layers groups in a scrollable panel.
There are two types of layers:
-
base layers that are mutually exclusive (only one can be visible on your map at a time).
-
overlays which are all the layers put over the base layers. Usually a base layer is a global map like streetview.
From the layers control users can switch between the base layers (defined on the thematic app configuration), and can show/hide the overlay layers.
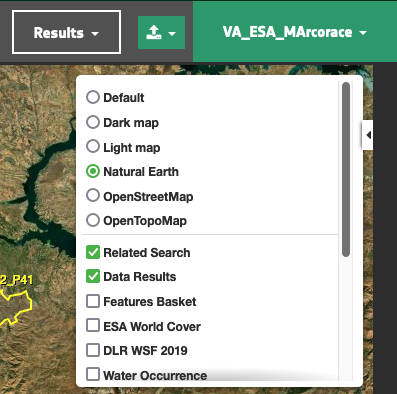
Base layers
Currently available base layers are the following:
-
Default- the default base layer of the ESA Charter Mapper. -
Dark map- an alternative to the default base layer employing a palette of subtly saturated dark tones. -
Light map- an alternative to the default base layer employing a palette of subtly saturated light tones. -
Natural Earth- a global map derived from satellite imagery from multiple sources (commercial providers, NASA, and USGS). This layer does not provide labels. -
OpenStreetMap- based on OpenStreetMap data, -
OpenTopoMap- based on OpenTopoMap data, -
ESRI World Map- a global map derived from satellite imagery provided by ESRI. This layer does not provide labels. Find more information here about this layer with terms and conditions for its usage in the Charter Mapper.
Overlays
On the geobrowser there are some predefined overlay layers:
-
Related Search: the layers group associated to a correlated search (if available)
-
Data Results: the layers group bound with the Current Search
-
Features Basket: the layers group bound with the Features Basket
In addition to these three types of overlay layers, multiple thematic overlay layers are also available. These are the following:
-
ESA World Cover 2020- global layer from the ESA World Cover product for 2020, -
ESA World Cover 2021- global layer from the ESA World Cover product for 2021, -
DLR WSF 2019- global layer from the DLR World Settlement Footprint product for 2019, -
Water Occurrence- global layer from the Water Occurrence layer of the JRC Global Surface Water product, -
Water Occurrence change intensity- global layer from the Water Occurrence change intensity layer of the JRC Global Surface Water product, -
Water Seasonality- global layer from the Water Seasonality layer of the JRC Global Surface Water product, -
Annual Water Recurrence- global layer from the Annual Water Recurrence layer of the JRC Global Surface Water product, -
Water Transitions- global layer from the Water Transitions layer of the JRC Global Surface Water product, -
Maximum Water Extent- global layer from the Maximum Water Extent layer of the JRC Global Surface Water product, -
Gridded World Population- global layer from the Gridded World Population product, -
TandEM-X 90m DEM- global layer from the TandEM-X 90m DEM product,
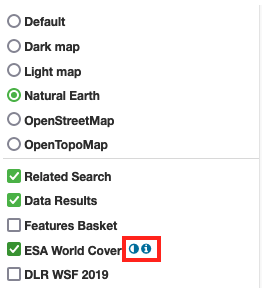
Moreover, users can also set the opacity by clicking on the set layer style button and using the dedicated slider. When available, it is also possible to show the legend of the thematic overlay layer in the map by clicking on the show layer info button.
Check out the below video to know how to visualise in the activation map the multiple global base and thematic layers available.
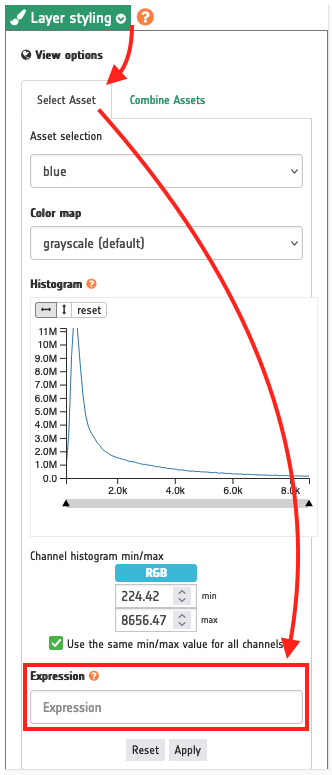
Expression
When visualising a single band asset in the left panel under the Details of a Calibrated Dataset via the Layer Styling panel it is possible to employ simple expressions based on the values of the image. With the Expression input field users can define a mathematical expression to derive a classified raster or combine more bands in one using the ones available from the asset list.
For example, in an optical calibrated dataset containing single band assets red, green, blue, and nir a possible expression to derive NDVI index could be the following:
(nir-red)/(nir+red)
Another example is the binarization of a single band sigma nought asset from a radar calibrated dataset to derive a water mask. The expression for X-band asset in HH polarization could be the following:
where((s0_db_x_hh<-18),1,0);
in which:
-
whereis the mathematical operator, -
s0_db_x_hhis the single band asset, -
and
-18the threshold.
Note
Currently supported operators are: +, -, /, *, and where. When employing the where operator the expression must end with a semicolon ;.
Warning
Expressions under layer styling are not symbolic expressions. A different syntax is applied between an Expression in Layer Styling and an S-expressions in STACK, Co-Register or COMBI-Plus on-demand services.
To visualize a binary mask from a binarization of the signal dynamic range of the backscatter asset: select a radar calibrated dataset, and access the Details and open the Layer Styling.
Under Details > Layer Styling set the following parameters:
-
Asset selection:
s0_db_x_hh -
Color map:
grayscale -
Channel histogram min/max: Min =
0, Max =1 -
Expression:
where((s0_db_x_hh<-18),1,0);
and click on the Apply button.
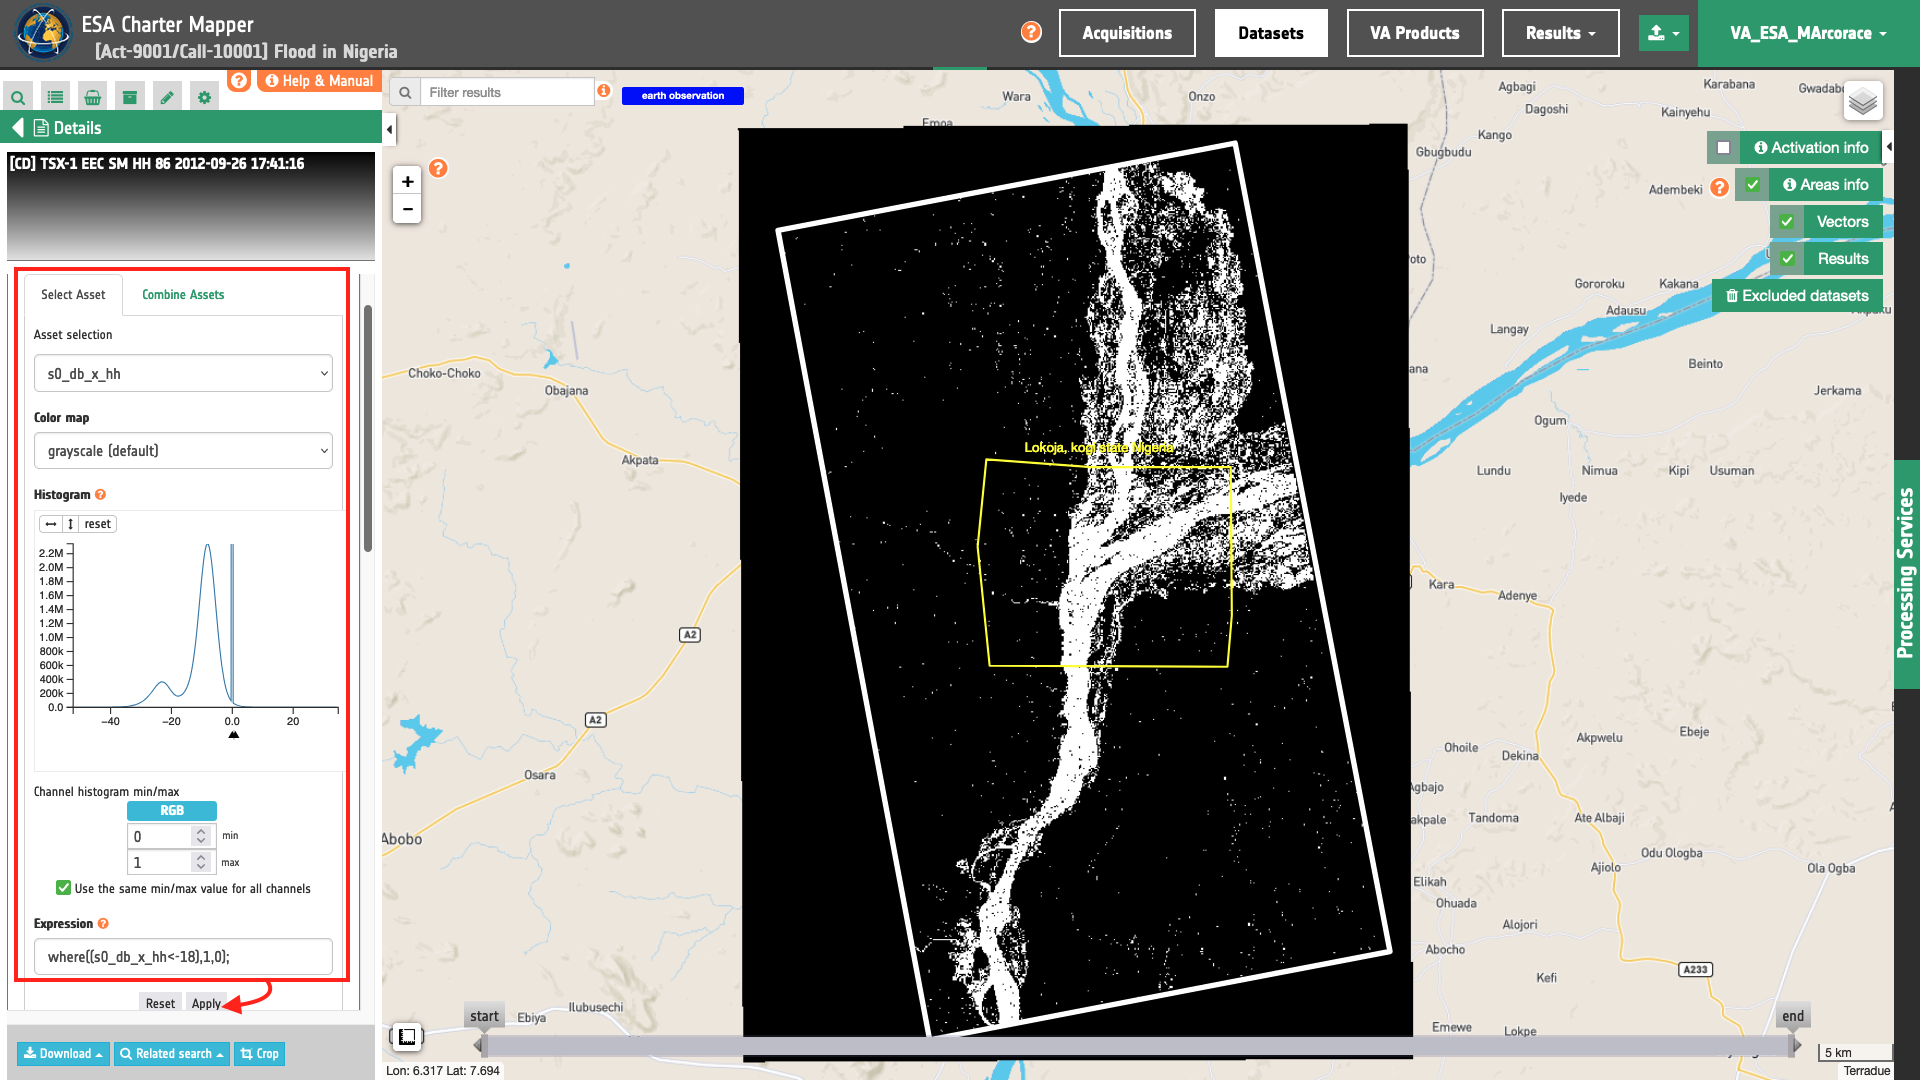
This visual product is generated on the fly based on these parameters. Thus if not satisfied with the result you can change the threshold value from -18 to another one (e.g. -17), click on Apply, and the new resulting binary map will be immediately updated in the map.
Enhanced raster visualization functions
All features containing geographic information are always represented on the map as geometric shapes (like a rectangle, a point, a polygon and so on). Moreover, some of these "spatial features" also contain raster data, like images or tiles. For these features there are some visualization functions, located on the Details Panel of the selected feature (by double clicking on a raster feature from the results panel). These functions are visible as an expandable section called Layer styling.
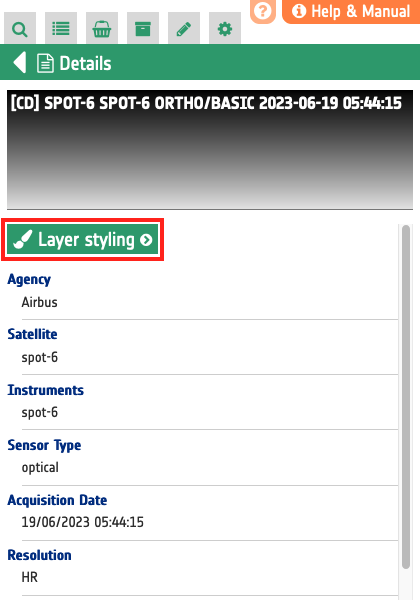
For all raster features (all features containing raster data) there is always a subsection called "Filters", including some customizable graphical settings, like brightness, contrast, opacity, saturation, and so on. The changing of these filters is immediately visible, and the settings are saved for the current session. Users can reset the filters to the default value and can also choose to apply the settings for a feature to all visible raster features.
For raster features represented by a TiTiler tiled layer, an additional subsection called "Titiler options" is visible. This is widely described on the Titiler widget page.
Processing
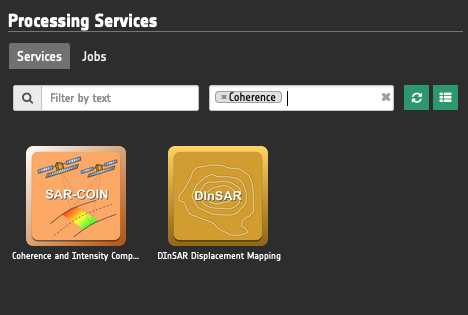
Filter list of services by tags
The Processing Services panel under the Services tab offers the possibility to filter the list of services using tags. In the ESA Charter Mapper each processing service has been associated with multiple categories, which are labelled in the geobrowser as tags.
Description of service tags
Tags for hazards
The following tags indicate which hazard/s the service is suitable for.
WildFire, VolcanoEruption, Flood, Storm, GroundMotion, and MultiHazard.
Tags for service input
The following tags describe the type of input supported by a service.
Optical, Radar, SARComplex, AuxData, and Results.
Tags Optical, Radar indicates that the service requires in input respectively Optical or Radar Calibrated Datasets. SARComplex is a subcategory of Radar and is necessary to filter for on-demand processors that require in input SLC Datasets (Radar Complex Imagery). The tag AuxData indicates that the service can support input Auxiliary datasets. The tag Results indicates that the service can support input Results from other on-demand processors.
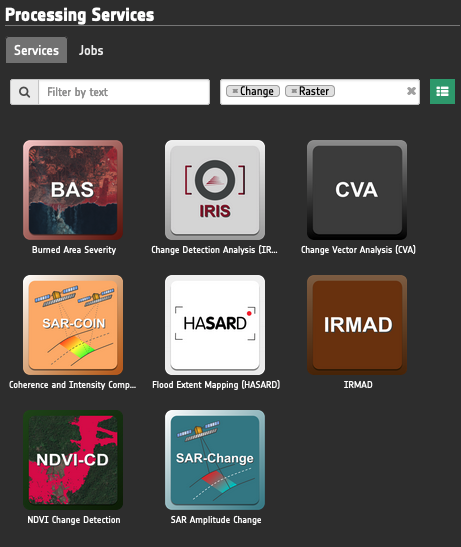
Tags for service purpose
The following tags indicate the purpose of the service (goal, application, operator, or main generated product).
BurnedArea, BandMath, Index, Change, ImageStack, Coregistration, BandComposite, DetectionAlgorithm, Pansharpen, InSAR, Coherence, ImageClassification, Filter, and Vectorize.
The tag Change indicates that the service performs a change detection or provides a band composite that highlights the change.
Tags for service output
The following tags describe the type of output generated by the service.
Raster, Vector, and Discrete.
The tag Discrete stands for classified raster.
Tags describing temporal and sensor combination
The following tags describe the nature EO data combined by the service.
IntraSensor, Multitemporal, MultiSensor, S1, and S2.
The tag IntraSensor indicates processors that require input from the same sensor (e.g. pre and post-event dataset cannot be from different sensors). Instead MultiSensor means that the processor can combine EO data from different sensors (e.g. a detection service able to support a pair of Optical Calibrated Dataset or single band assets from different sensors). The tag Multitemporal indicates a processor that can handle EO data acquired at different times. Tags S1 and S2, which stand for Sentinel-1 and Sentinel-2 respectively, indicate the only mission that the service supports (in all the other cases the processors support two or more missions).
How to use tags
After a click on the Filter by tag/s box, a list of selectable tags appears. The user just needs to select one or more tags from the list. After the selection the list of services will be automatically filtered.
In this filter it is possible to employ a single
or a combination of multiple tags.
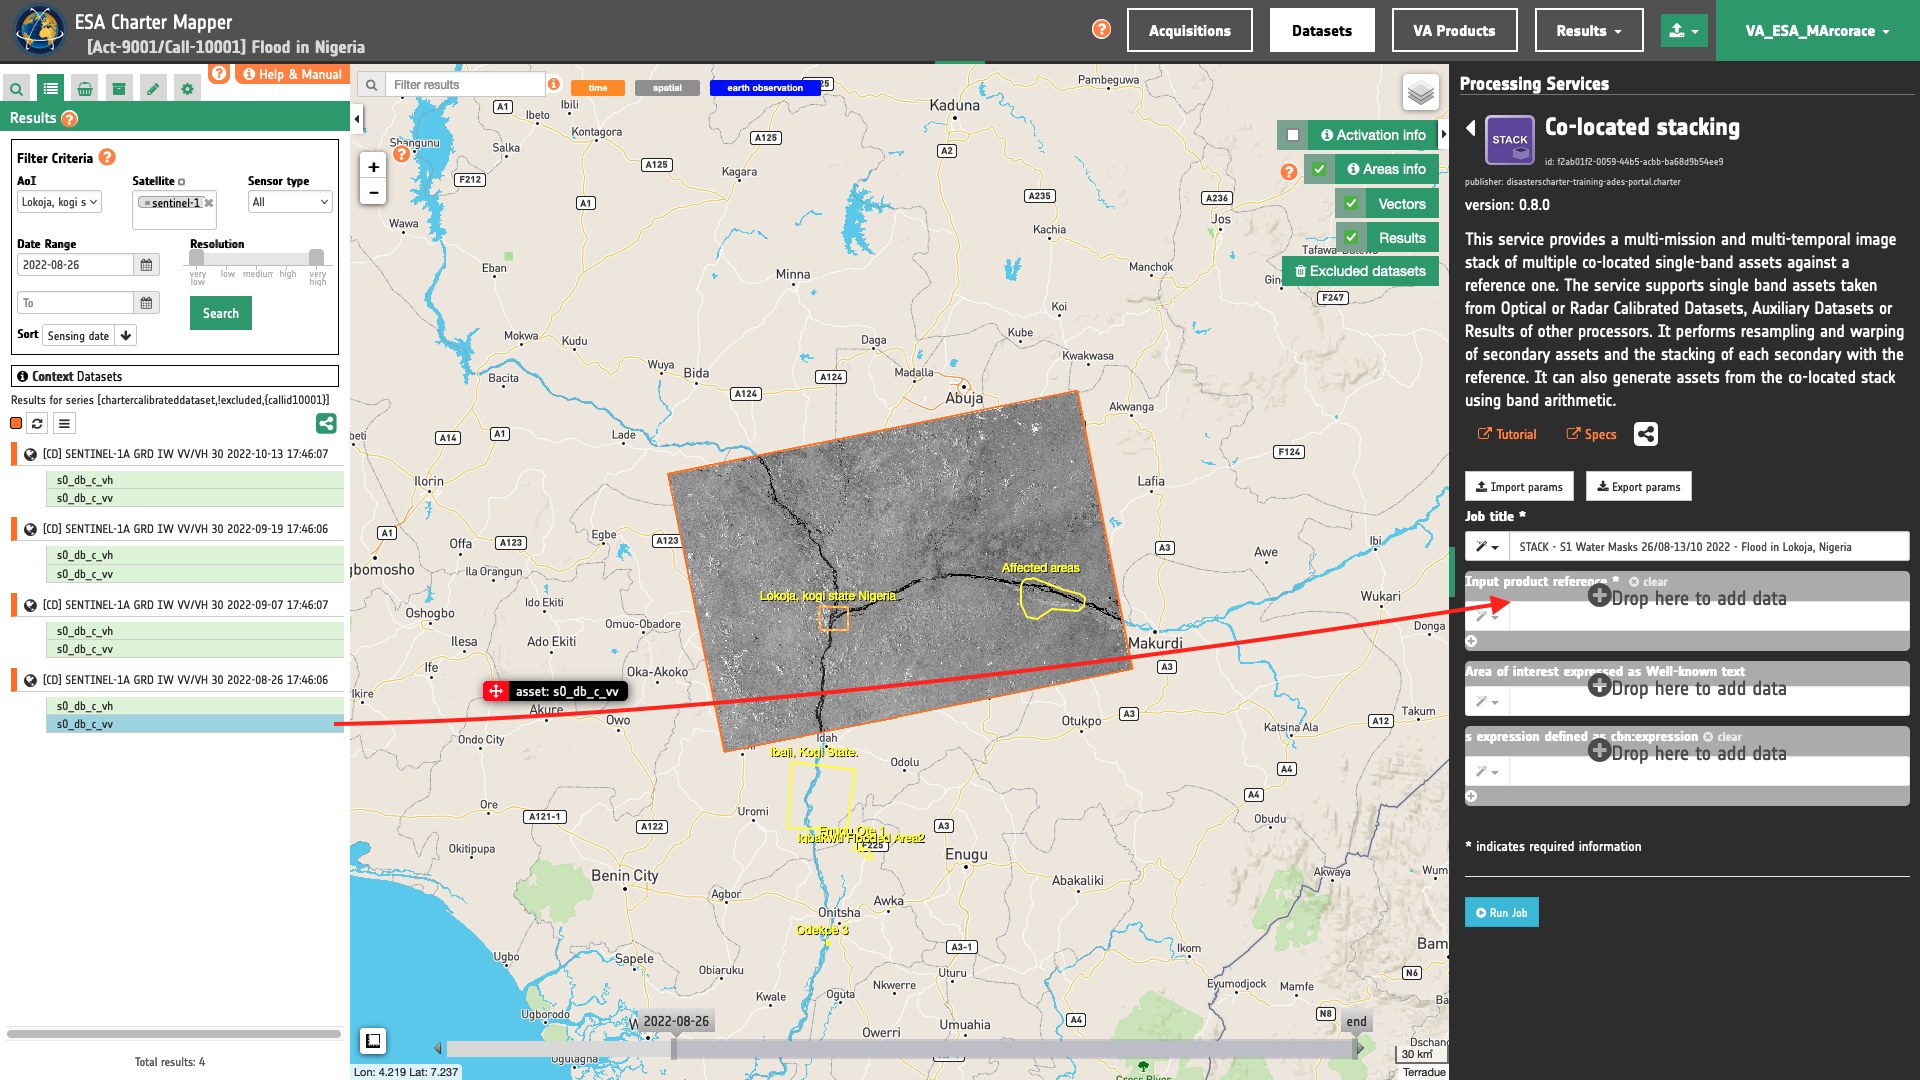
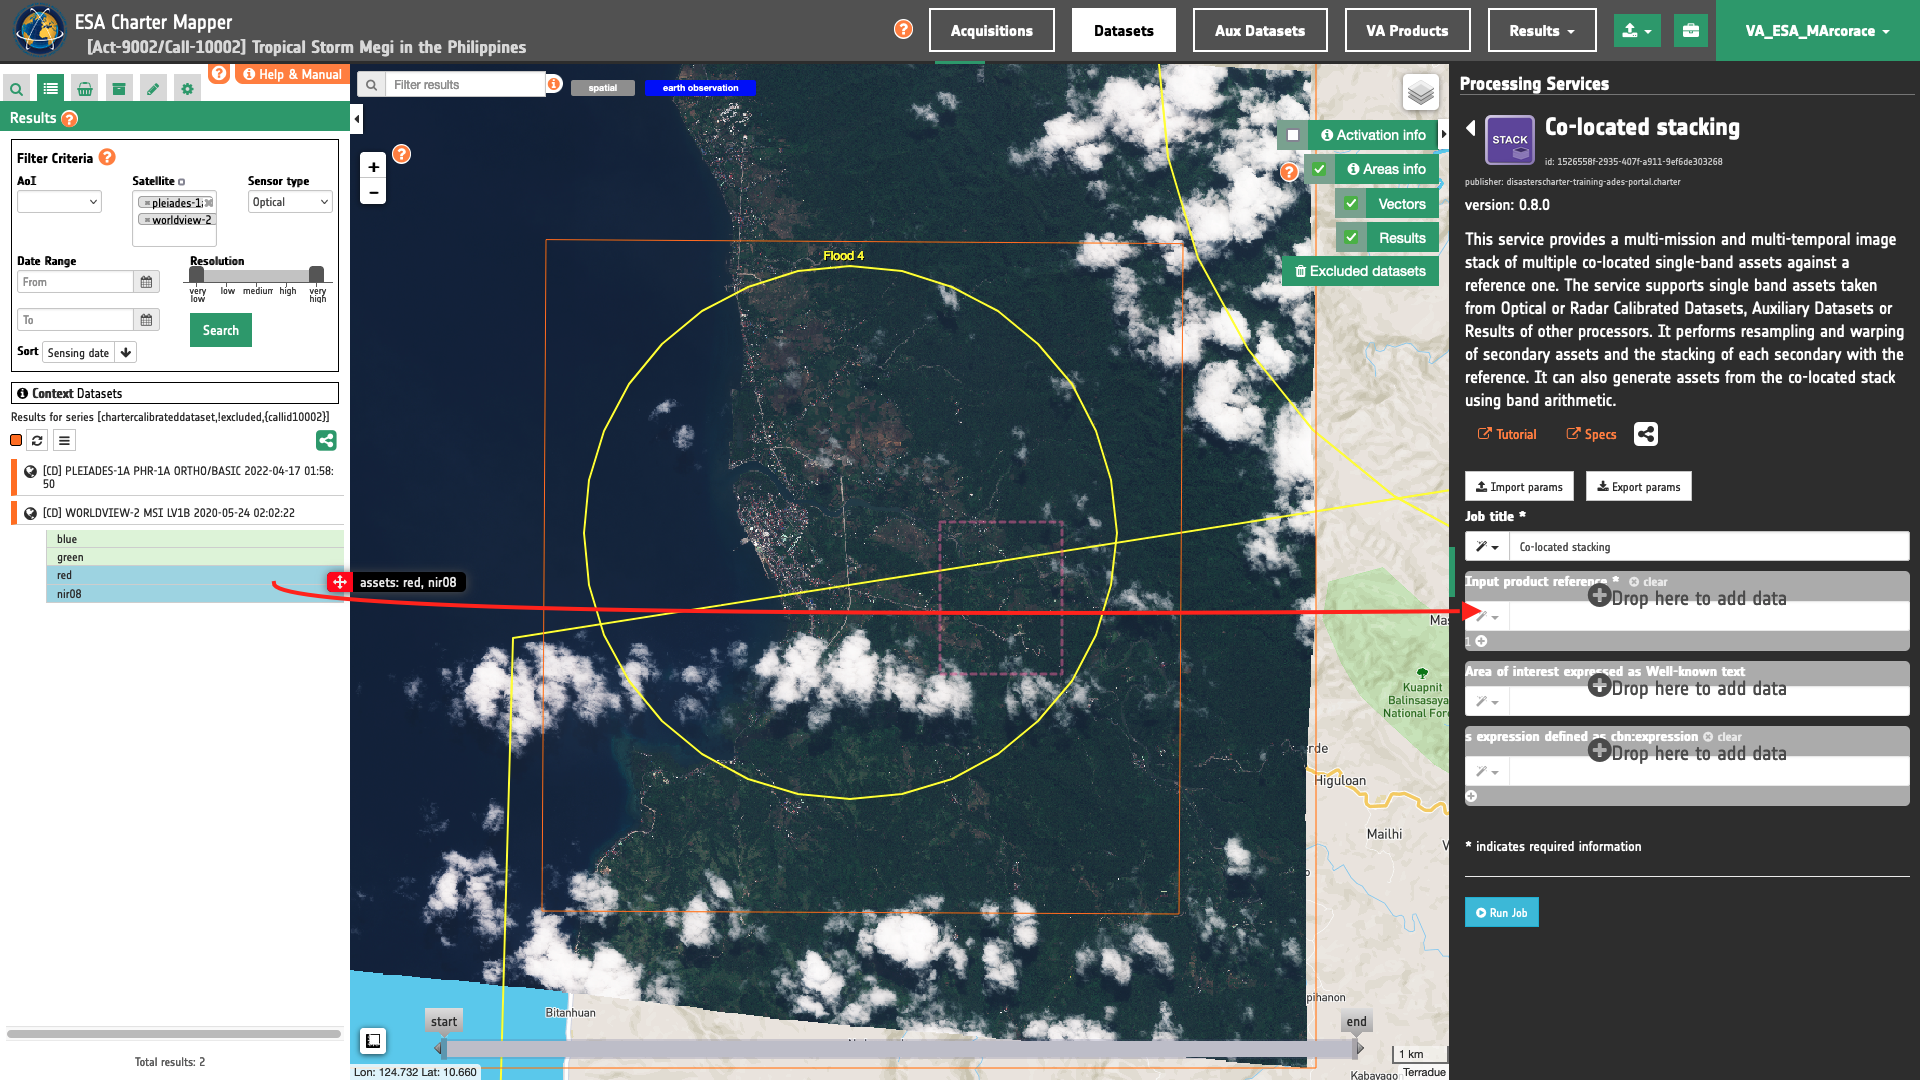
Drag and drop features
A feature (or a set of features) selected from the Results Panel can be dragged to use it as a WPS service parameter value, or to add it to the features basket.
For the first operation it's necessary to have the WPS service opened with the allowed target WPS field parameter visible, simply by dropping the feature(s) on the WPS field, this field will be set with the feature identifier. This operation is available for the features basket result too: it's possible to add a feature from the features basket on a WPS field parameter.
It is possible to drag one or more features (asset or dataset) with a single drag and drop.
Hint
Use CONTROL + click to select more than a feature (asset or dataset) from the list.
For the second operation (add to features basket), users can add selected features from the results panel to the features basket panel simply by dragging the features and dropping them into the features basket tab icon.
Geobrowser clipboard
The geobrowser clipboard is a facility used to pass data between the geobrowser components, in particular from the current search status and results to the WPS services fields. The Geobrowser Clipboard consists of a set of adaptable and dynamic information stored in a temporary buffer during the user interaction. For example, if the user selects one or more features, some selected feature information (such as start time or identifier) are stored in the clipboard for a reuse of the values.
Another clipboard type can be a search value, like search start date or end date.
Each clipboard element has an identifier, a value, a clipboard type (feature or search) and a data type. A value could be an array, for example, if the user selects 10 fields, the search:startDate geobrowser clipboard item stores 10 start dates.
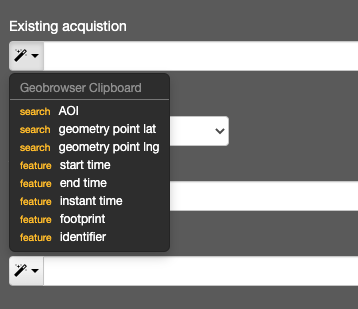
The WPS service field has a clipboard menu, used to retrieve the clipboard values previously stored.
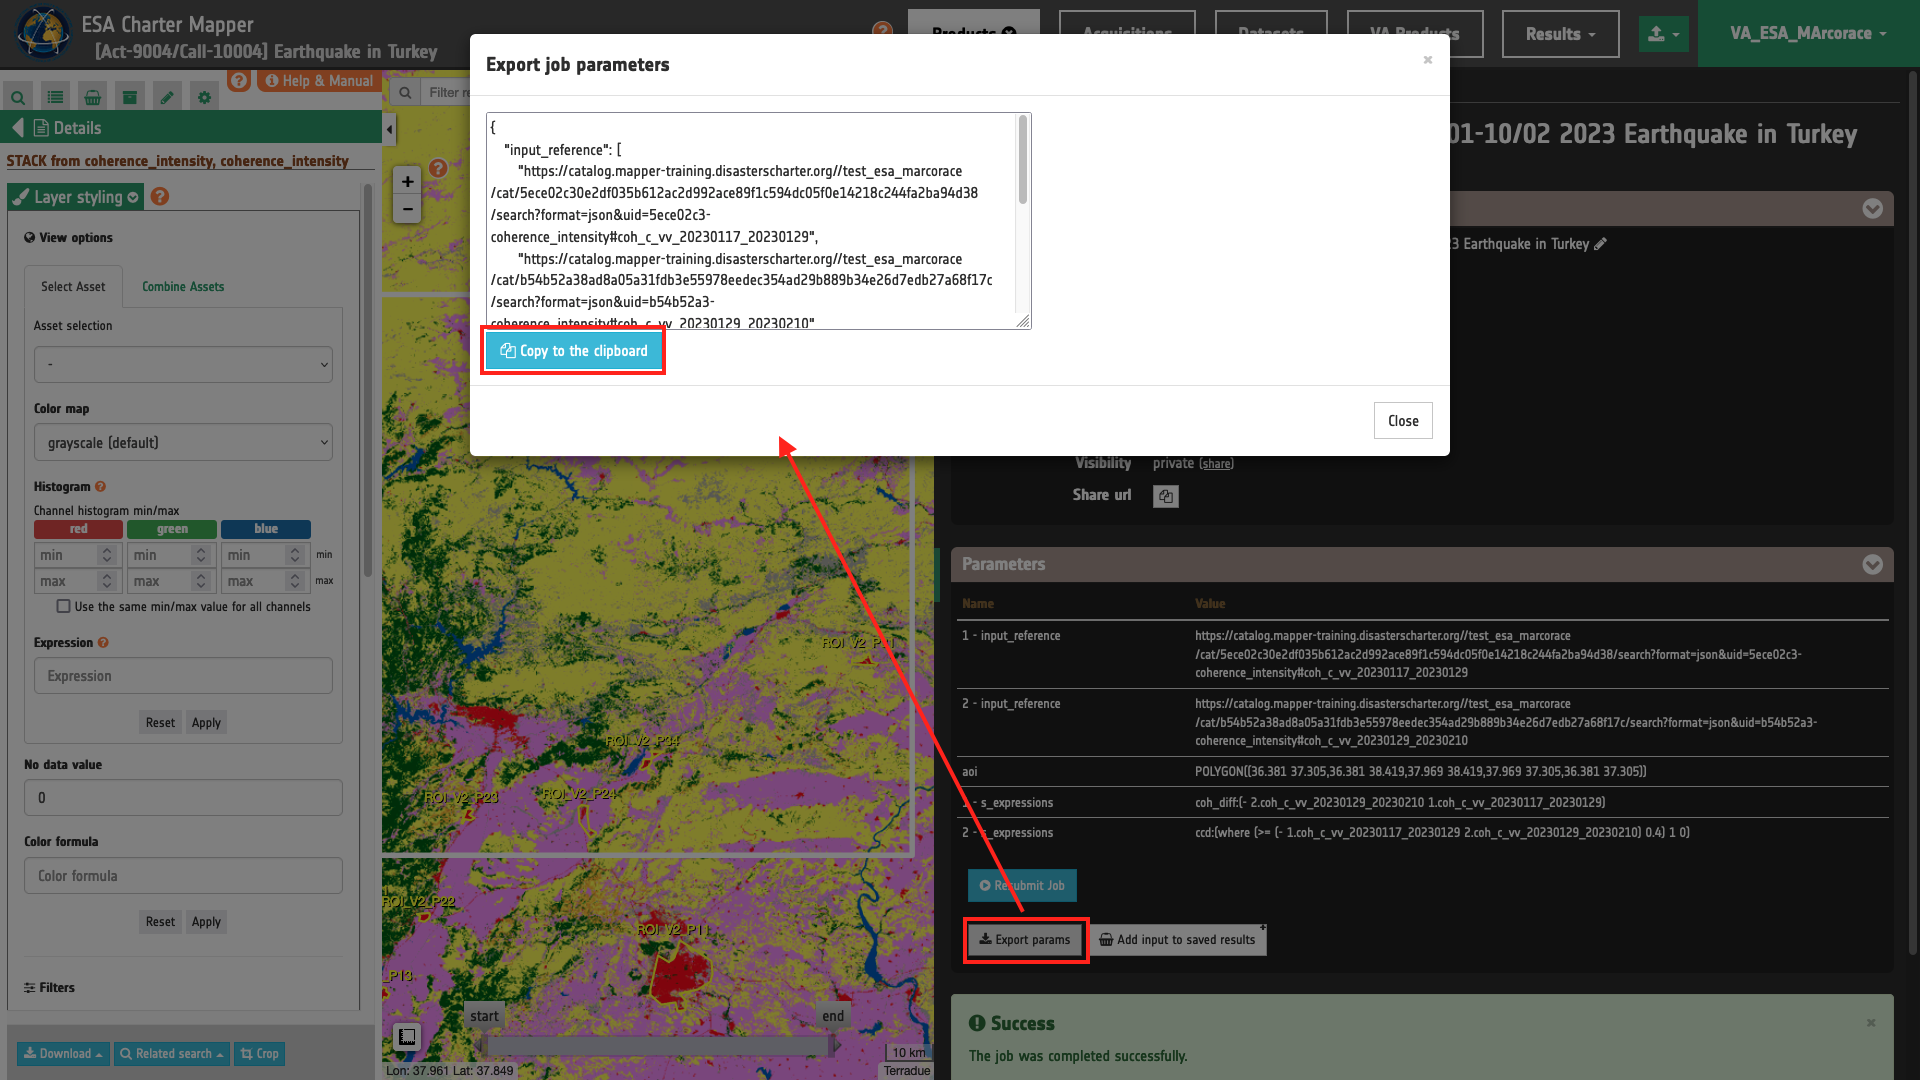
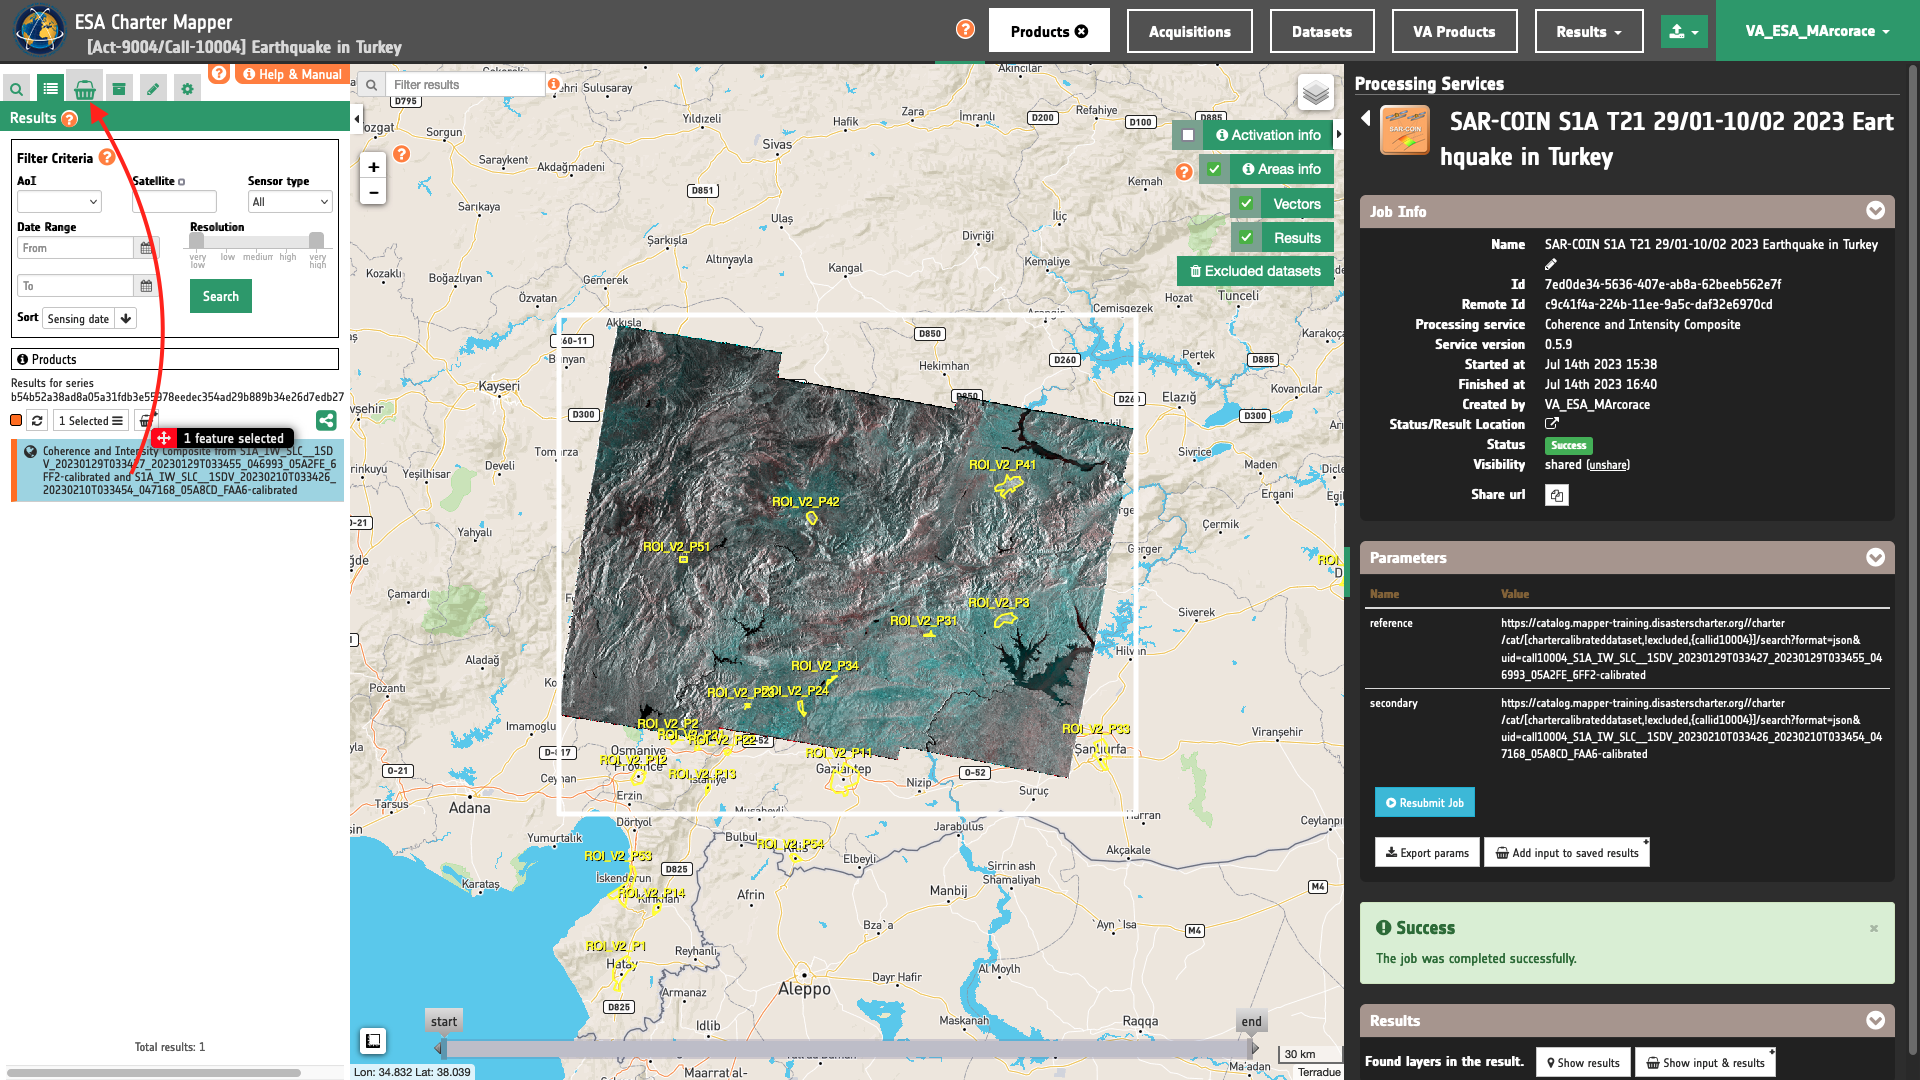
Export and import service parameters
When users select a WPS process to execute, they can set all parameters by filling the relative form. However, in some cases it can be useful to set (or to get) all parameters in a single block structure. In this way users can prepare the wps parameters in an external application (like a text editor), or they can take the wps parameter of an existent wps Job, to create a new WPS job with the same or a portion of the same parameters.
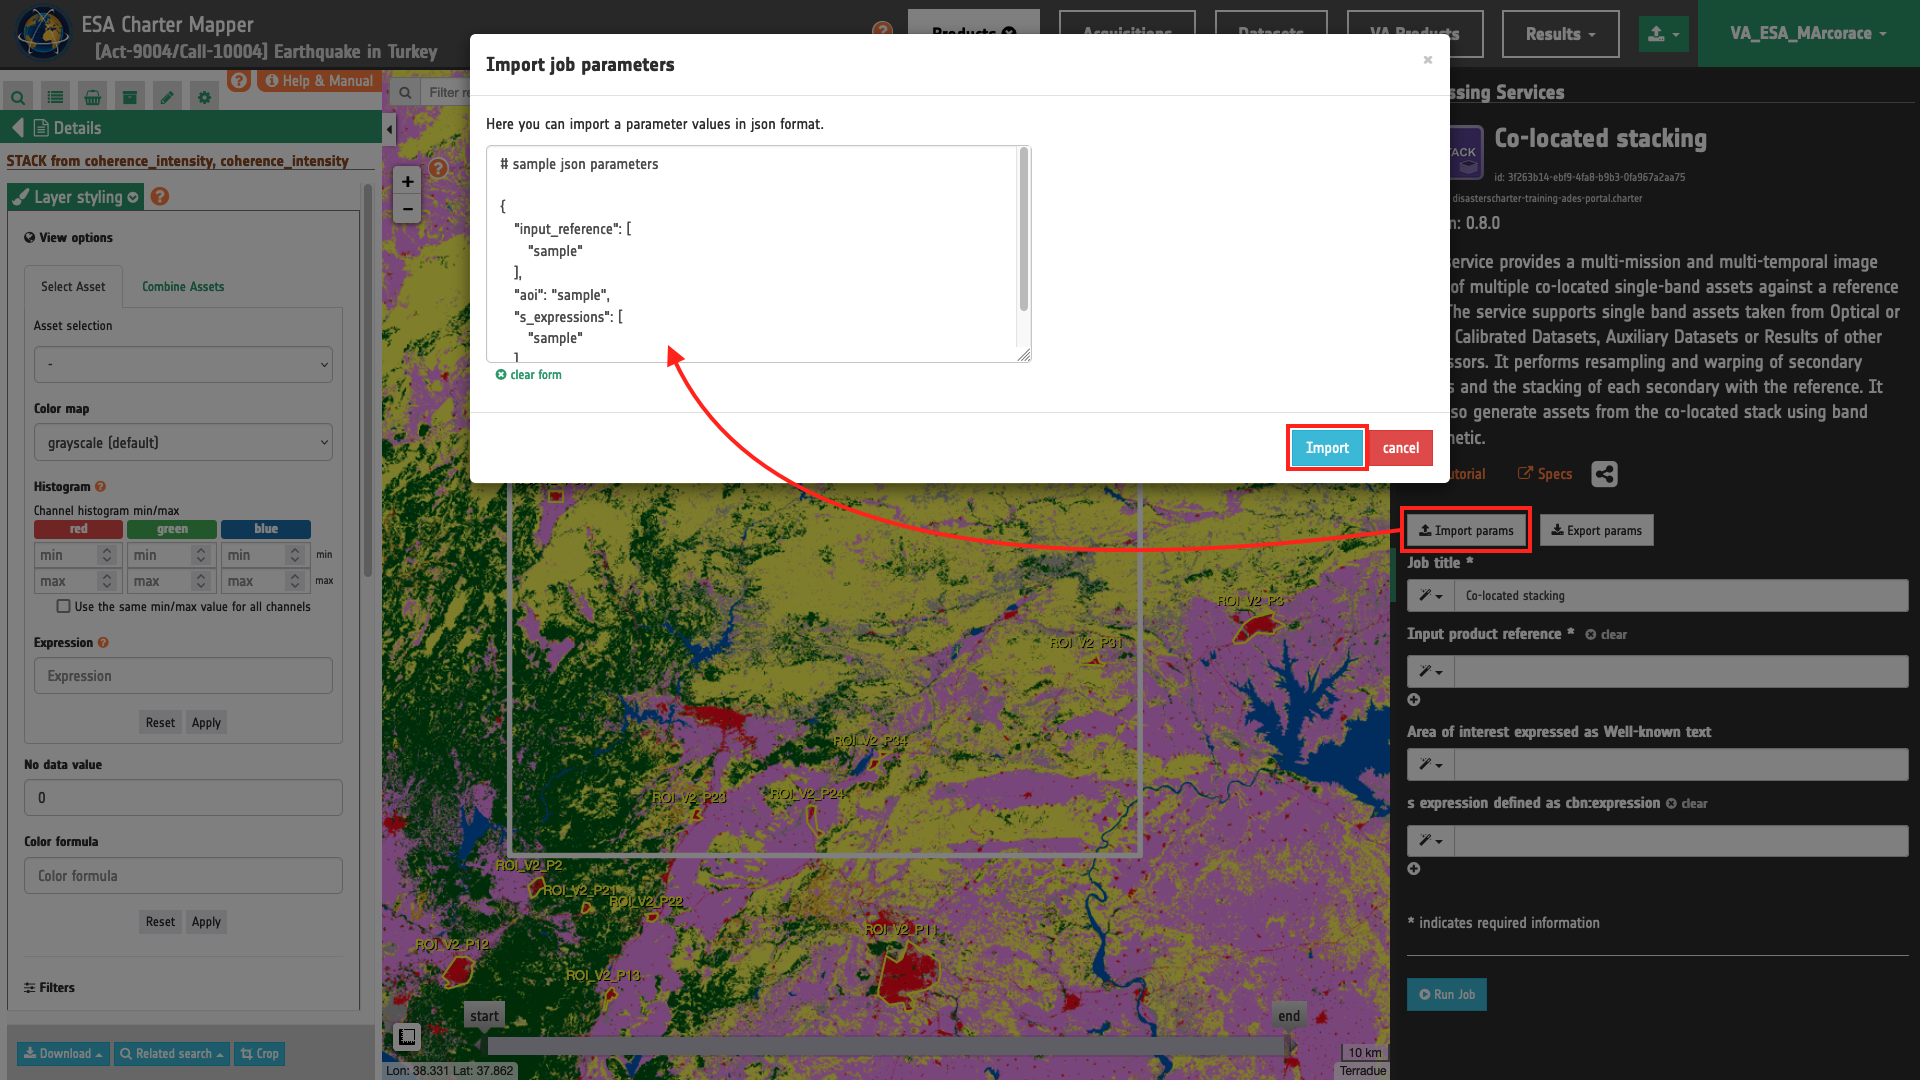
To perform this there are 2 utilities: import and export parameters.
On the WPS process description (and form) there is a "Import Parameters" button. Once clicked, a popup form with a JSON structure (auto filled with sample values to help users) in the textarea of the form. The JSON is a simple key-value pairs object, with a single string value for single parameters, and array of strings for multiple parameters. After filling the textarea, by pressing the "import button" the popup is closed and all WPS form parameters are filled by matching the parameters set in the specified JSON.
On the WPS job description under the parameter values list there is a "Export Parameters" button. Once clicked a popup is opened, showing in a text area the JSON representing all WPS parameters set for the selected job. Users can copy this JSON in the clipboard, for example to change some parameter values and re-import these parameters in a new WPS job.