HOTSPOT tutorial
![]()
This service performs a hotspot detection algorithm. It takes as input a single calibrated optical dataset containing nir and swir22 spectral bands to generate a hotspot bitmask, representing areas of active fire.
 HOTSPOT service description and specifications are available in this section.
Select the processing service
After the opening of the activation workspace, in the right panel of the interface, open the Processing Services tab.
Select the processing service Hotspot Detection (HOTSPOT).
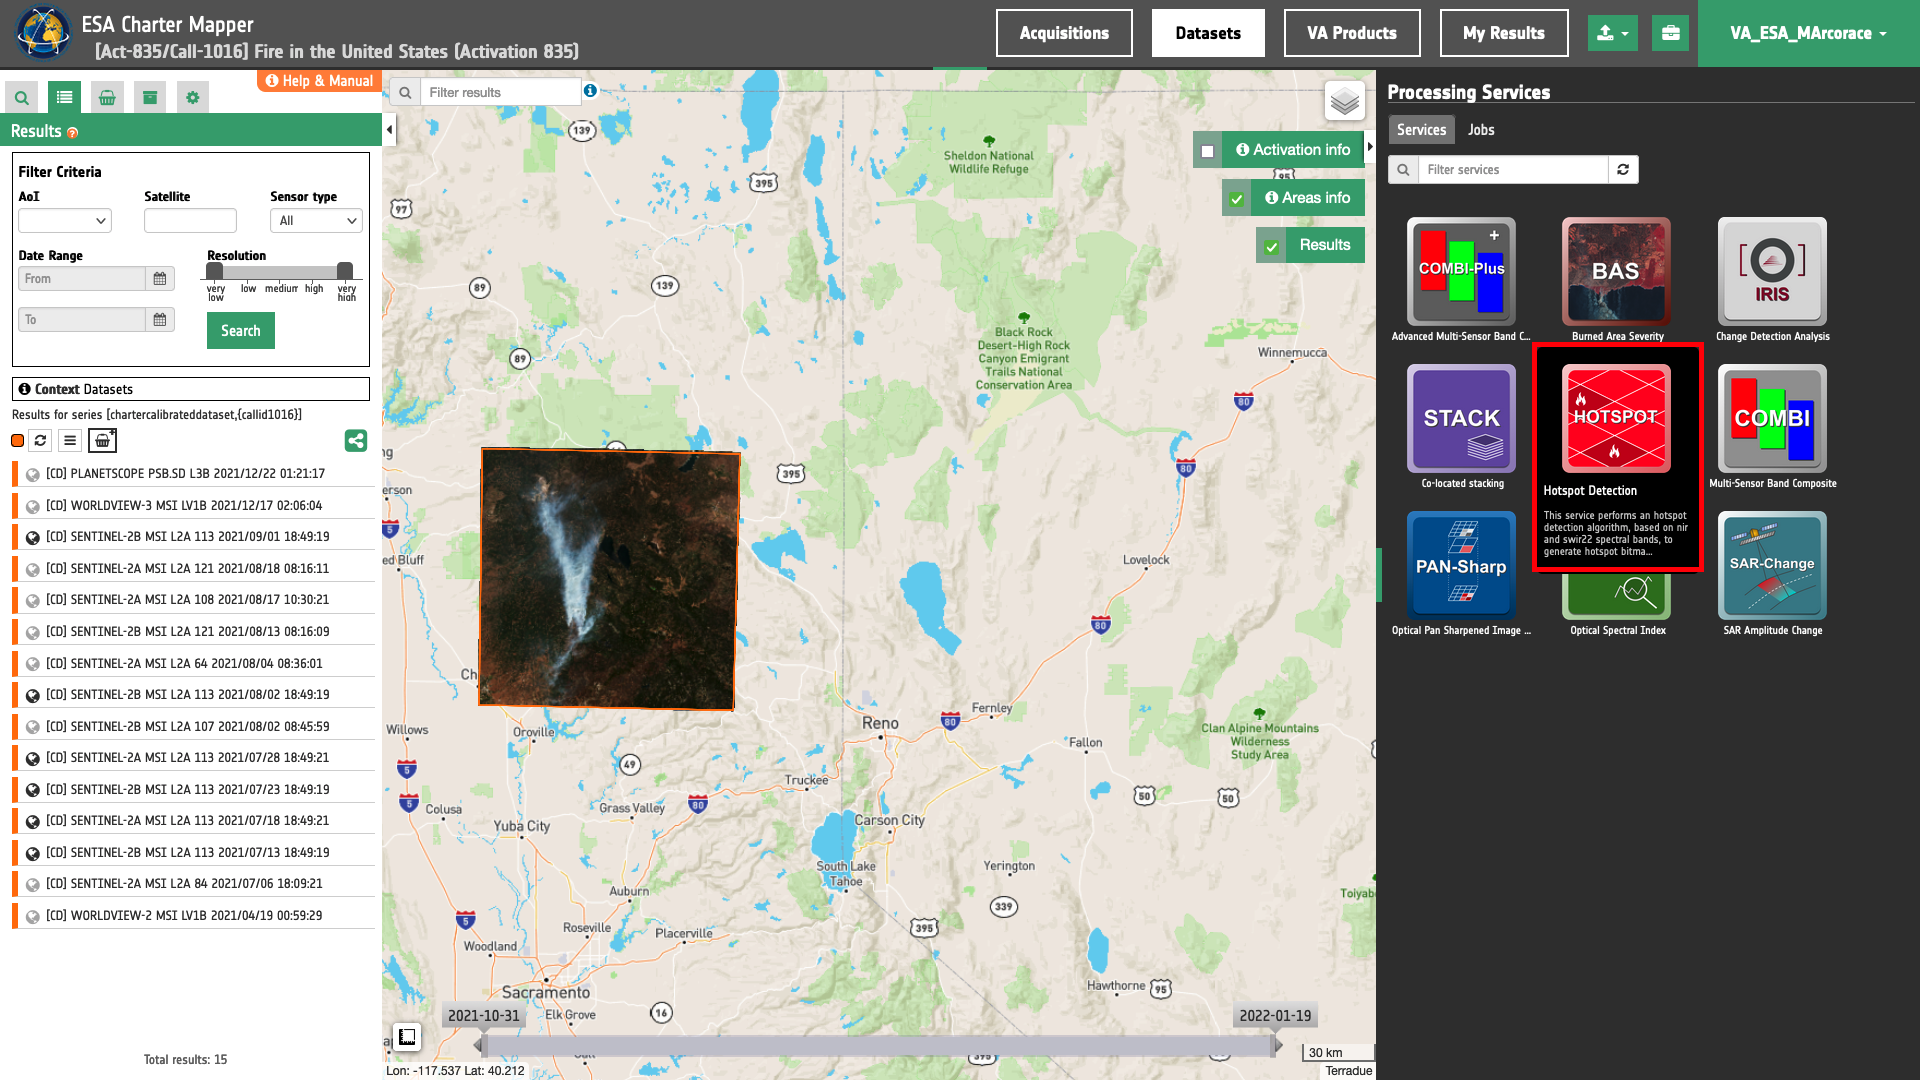
The "Hotspot Detection (HOTSPOT)" panel is displayed with parameters values to be filled-in.
Find the data using multiple filter criterias
-
Select the area for which you want to do an analysis, e.g over Northern California in the US. In this tutorial the
HOTSPOTservice is used to assess burned ares occurred during the Dixie Fire event of 2021 1. -
From the Navigation and Search toolbar (located in the upper left side of the map), click on Spatial Filter and draw a square AOI over Lassen and Butten counties in California, US. This spatial filter allows you to select only the EO data acquired over this area.
Tip
Use the Geocoding control to find some places on the map (e.g. Butte County, California, US). Inserted text could be a country, city name, street, mountain, river, etc.
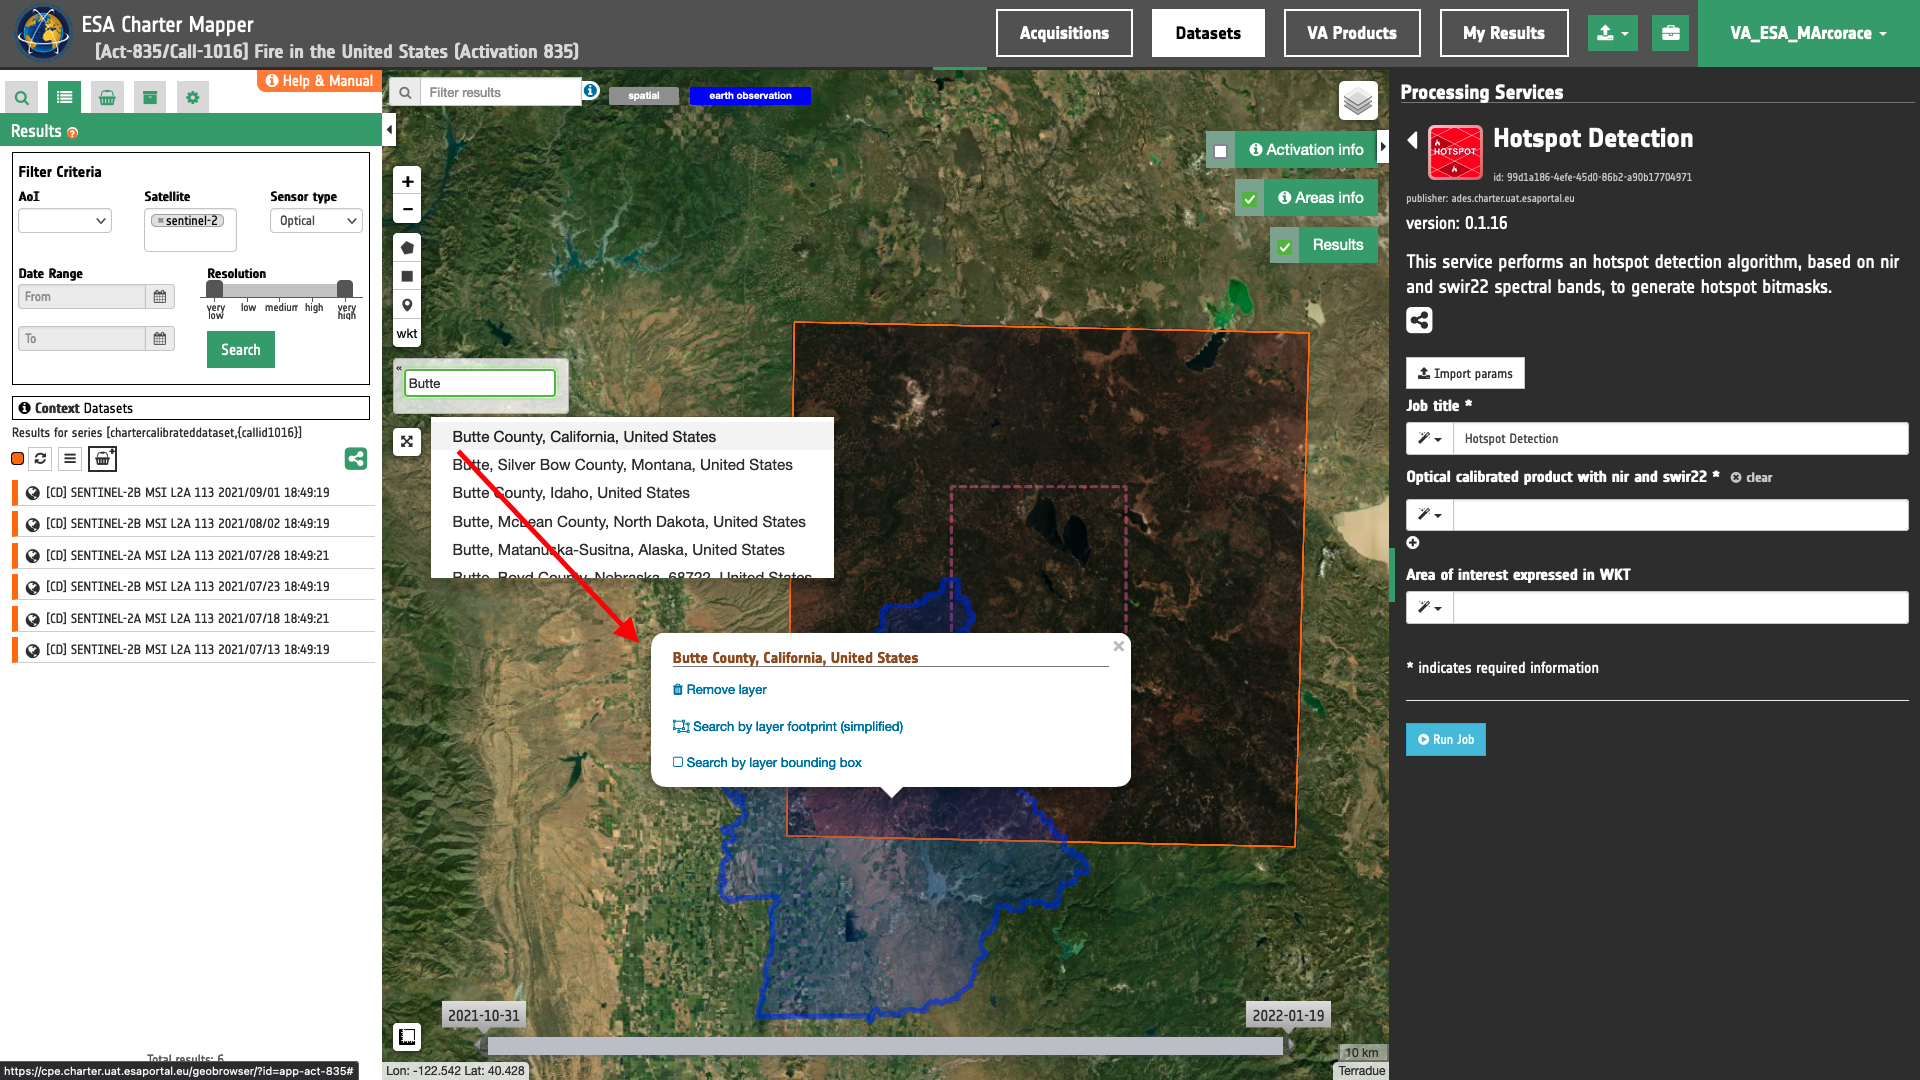
-
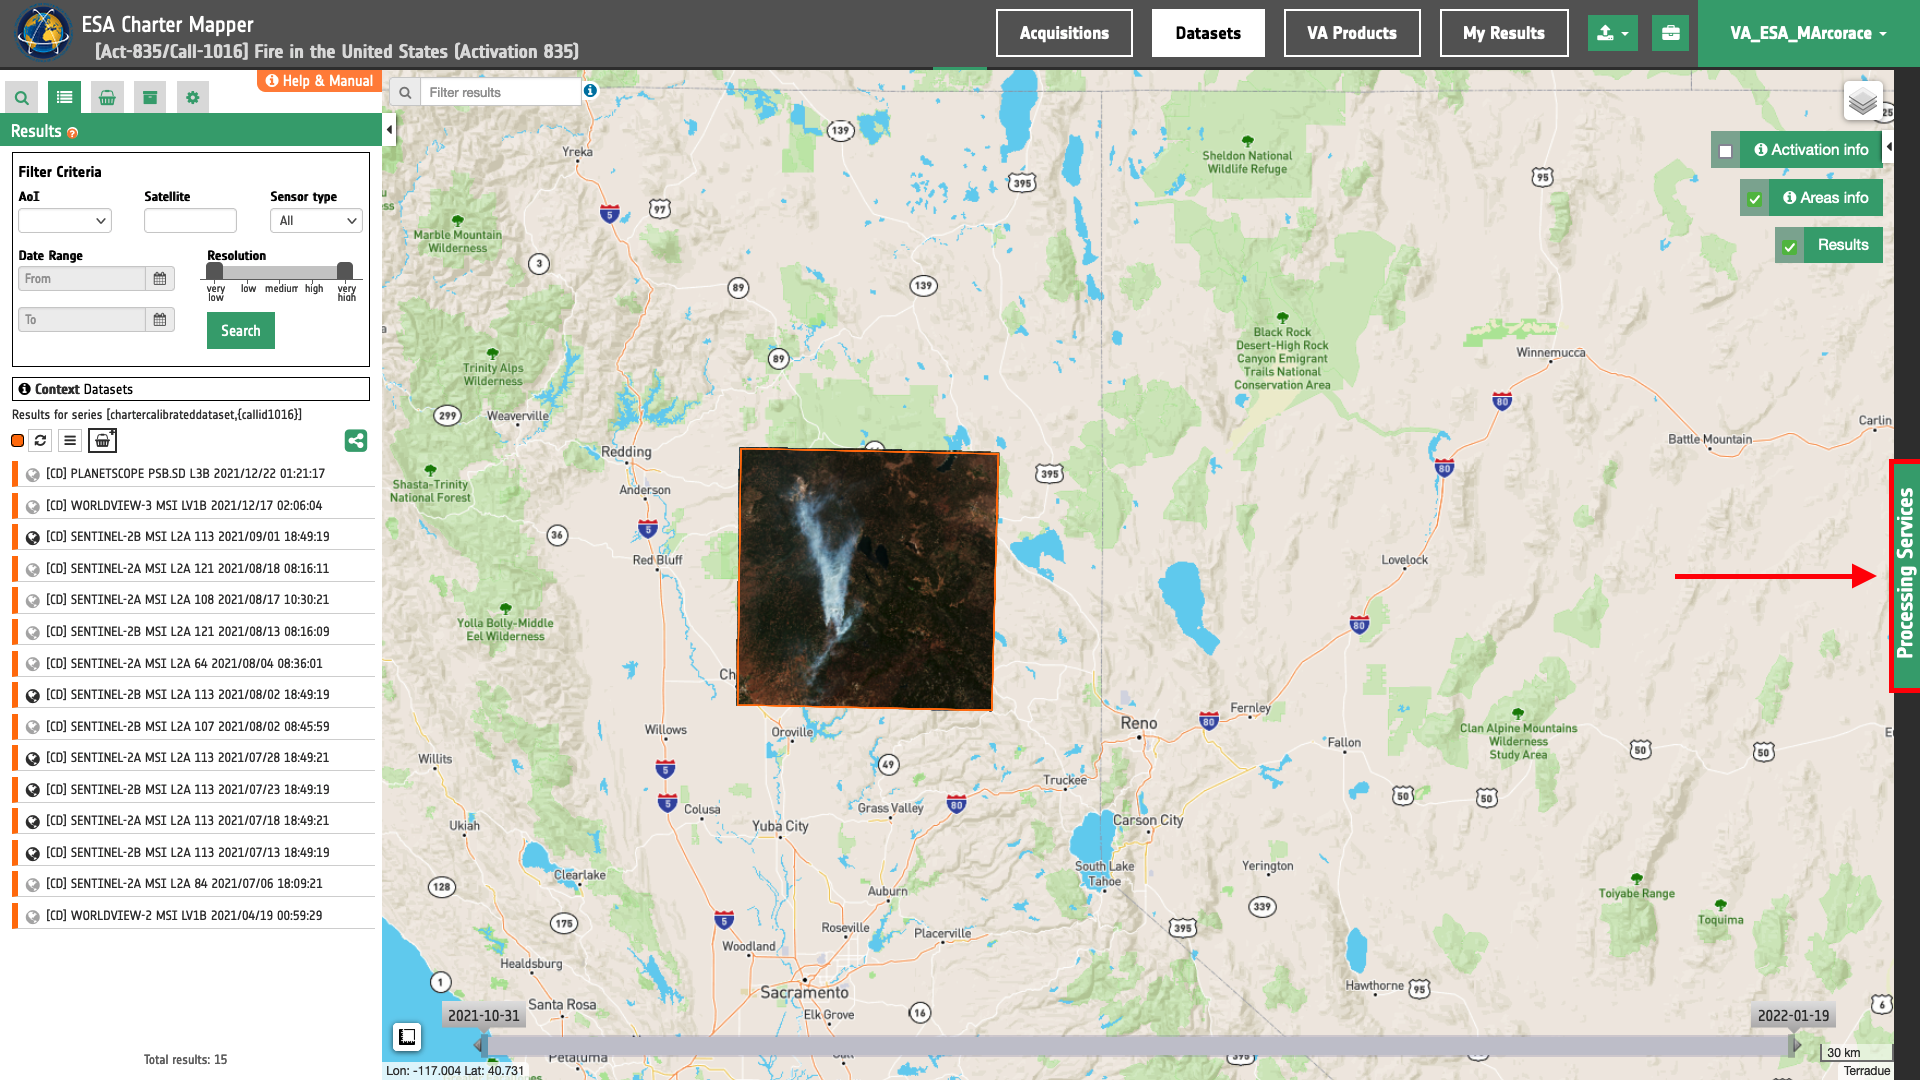
From the top of the left panel, use Filter Criterias to search for “Optical” and "Sentinel-2" data collections from the list.
-
After the query the list will be updated as the one shown in the next image.
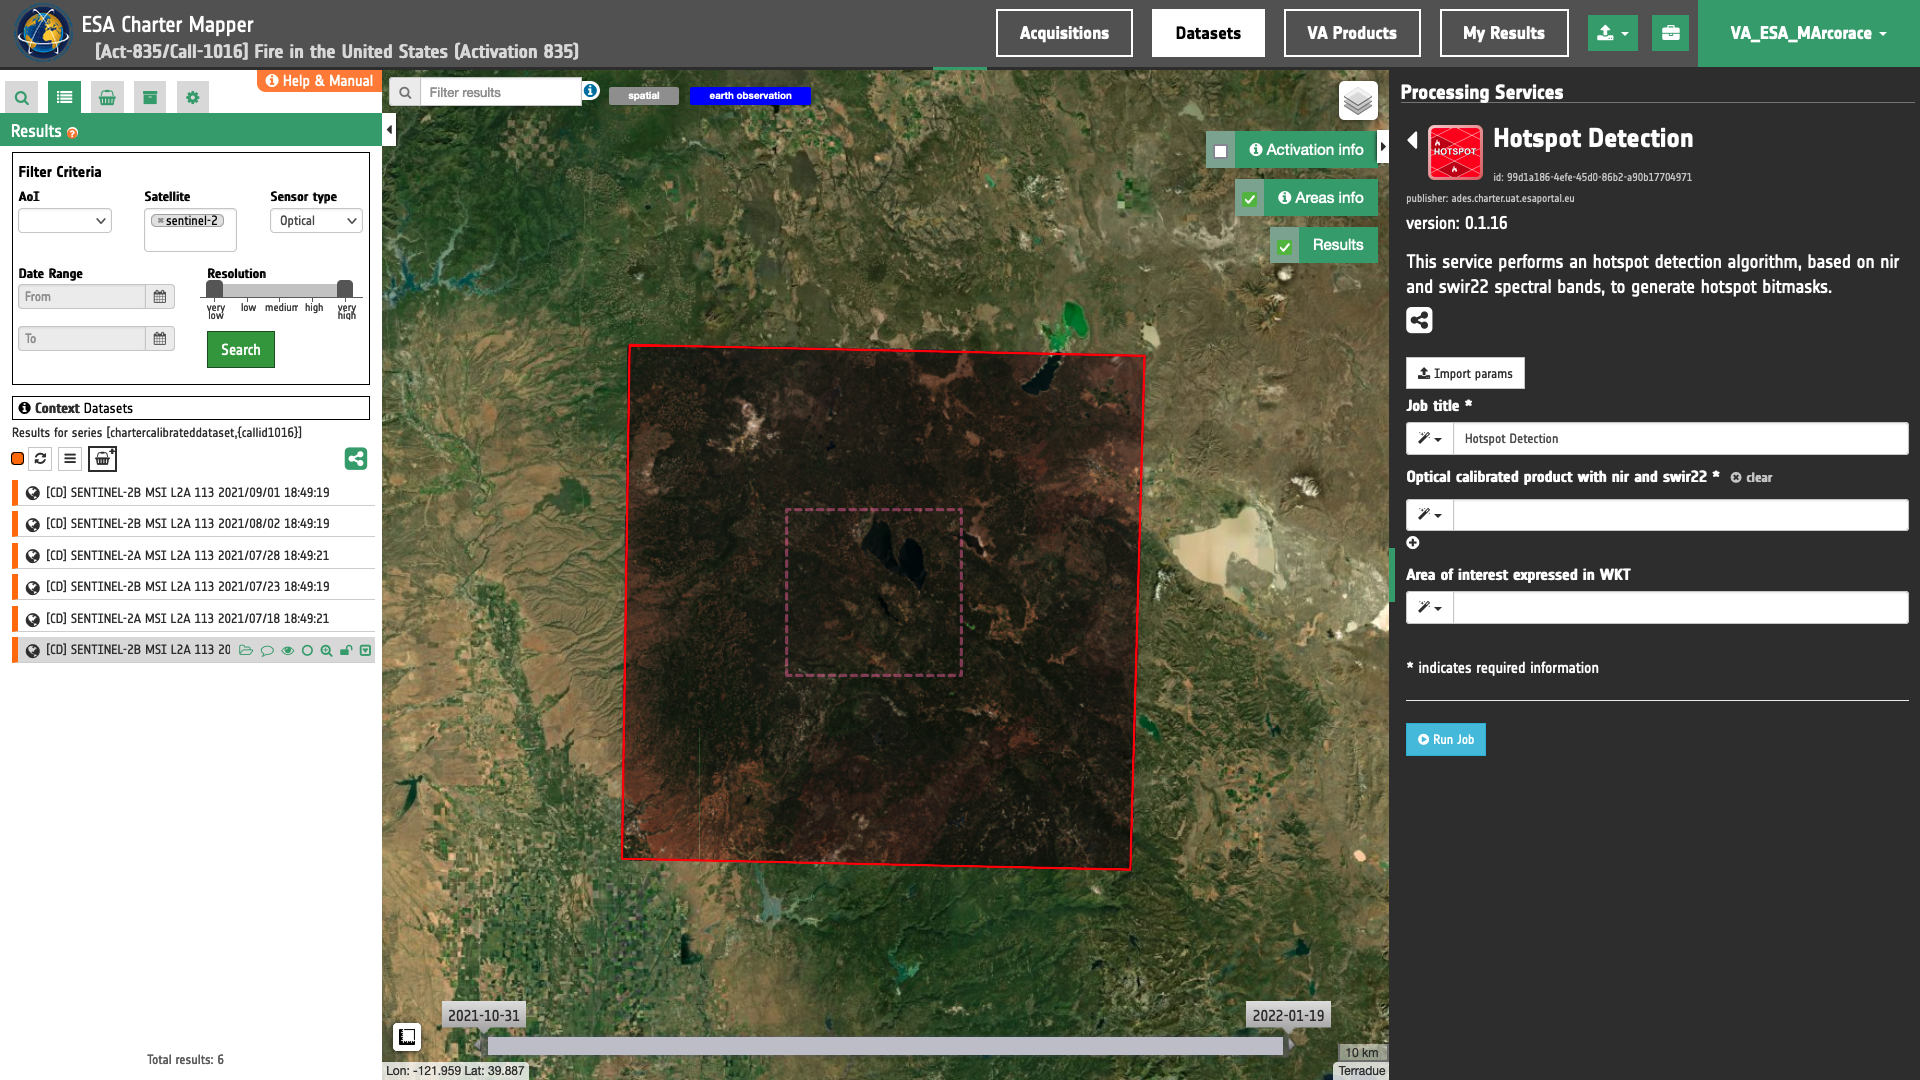
-
Now it is possible to select an Optical Calibrated Dataset to be used for the Hotspot Detection. HOTSPOT requires in input a multispectral calibrated dataset from
Landsat-8/9 OLIorSentinel-2 MSImissions having at least the following TOA/BOA reflectance single band assets:-
red,
-
nir,
-
and swir22.
-
-
As an example you can choose the Calibrated Dataset: SENTINEL-2B MSI L2A 113 2021/07/13 18:49:19
Tip
Under View Options and Select assets it is possible to access multiple pre-defined RGB composites. The True Color RGB combination (TRC) is the default overview displayed on the map for a Calibrated Dataset:
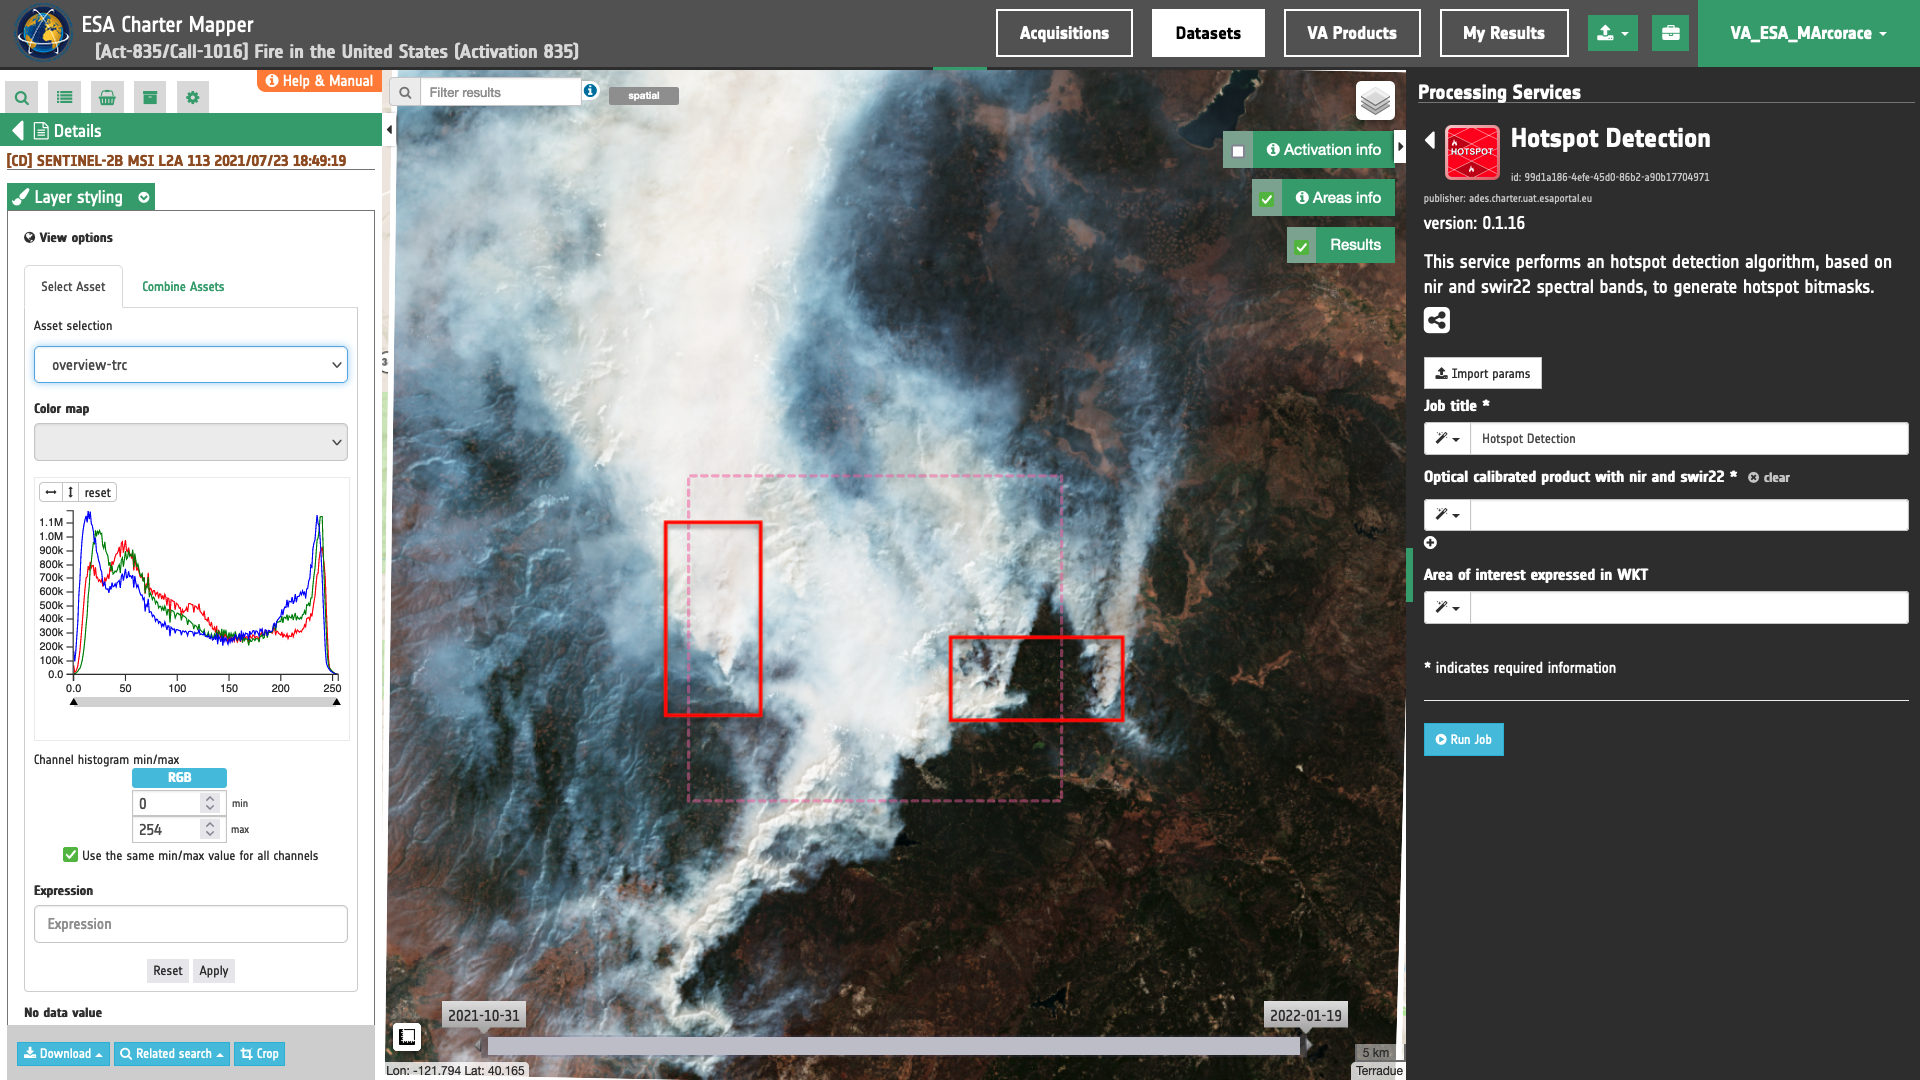
However, to better identify hotspots in areas affected by fire smoke the Atmospheric Penetration RGB combination (ATP) can be used:
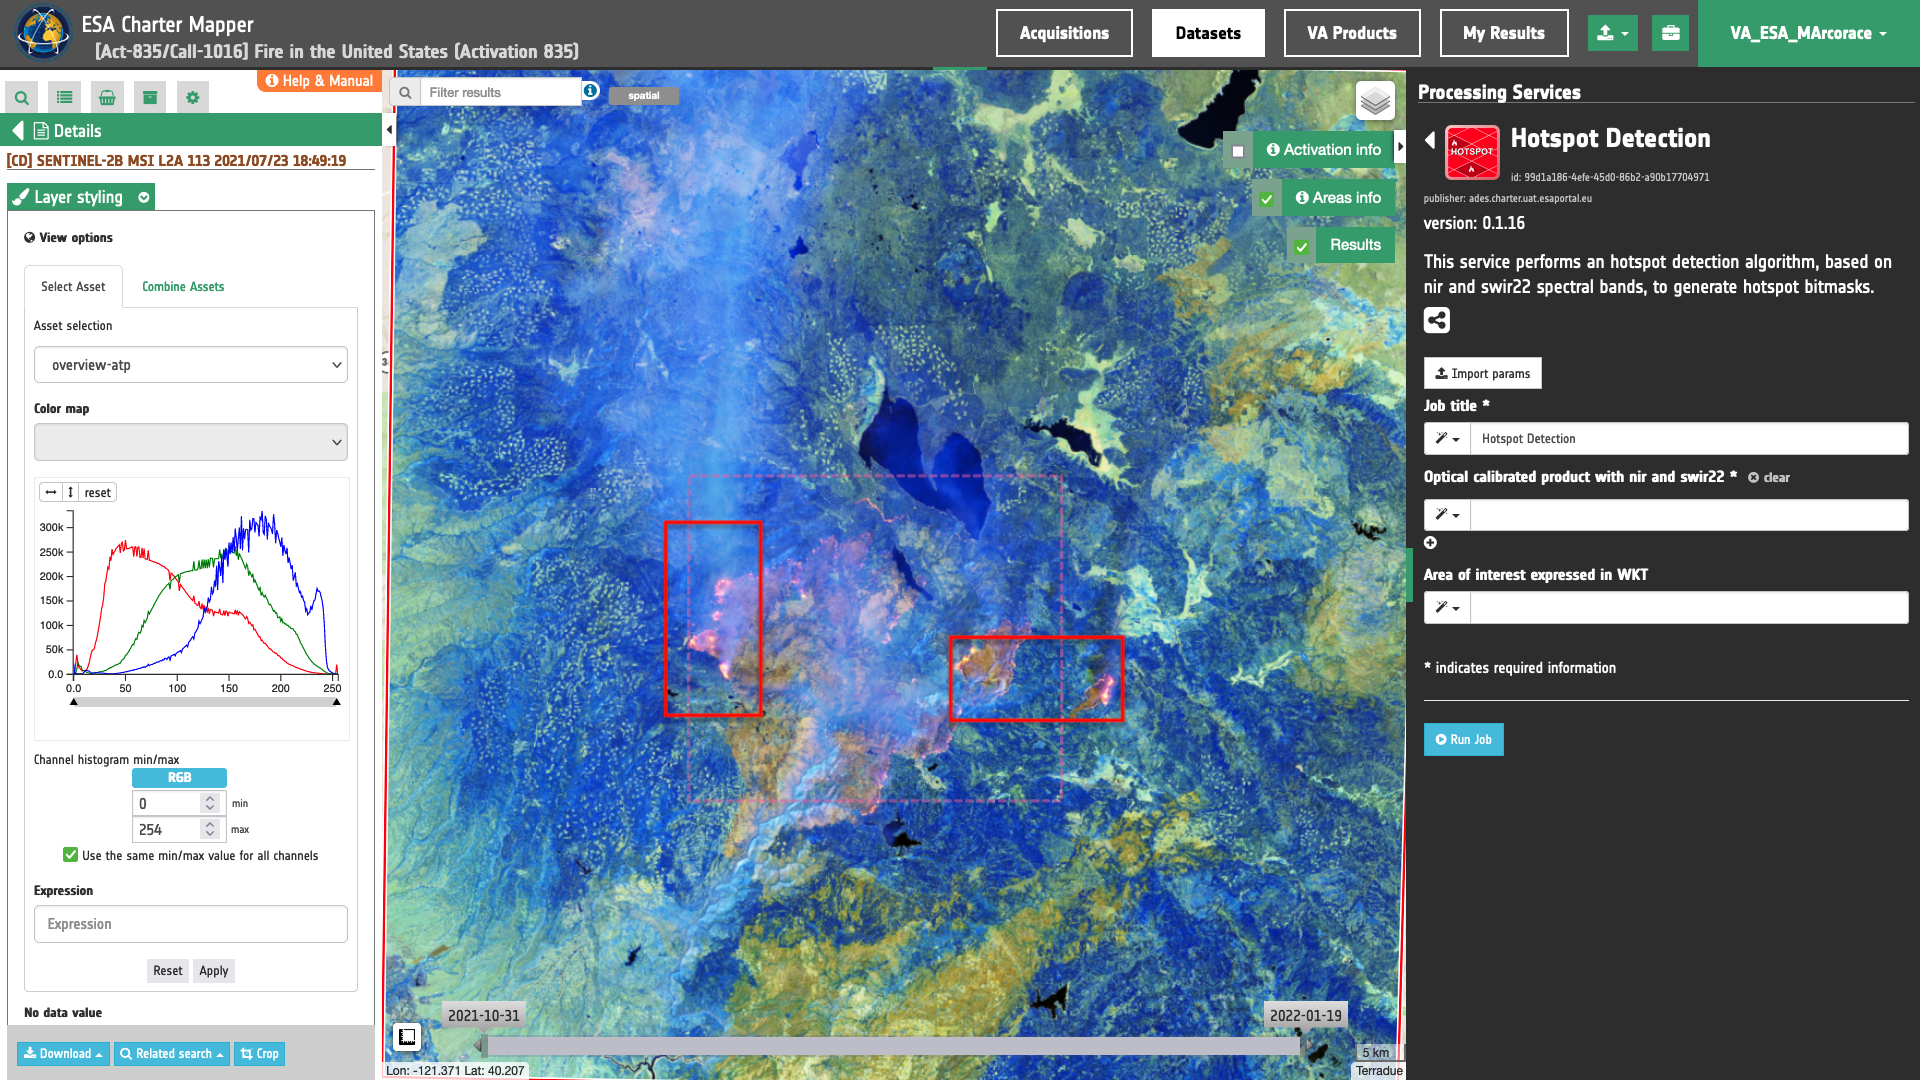
In addition to that, CIV and SIR RGB combinations can be also used to better interpret the effects of the wildfire (e.g. over vegetated areas).
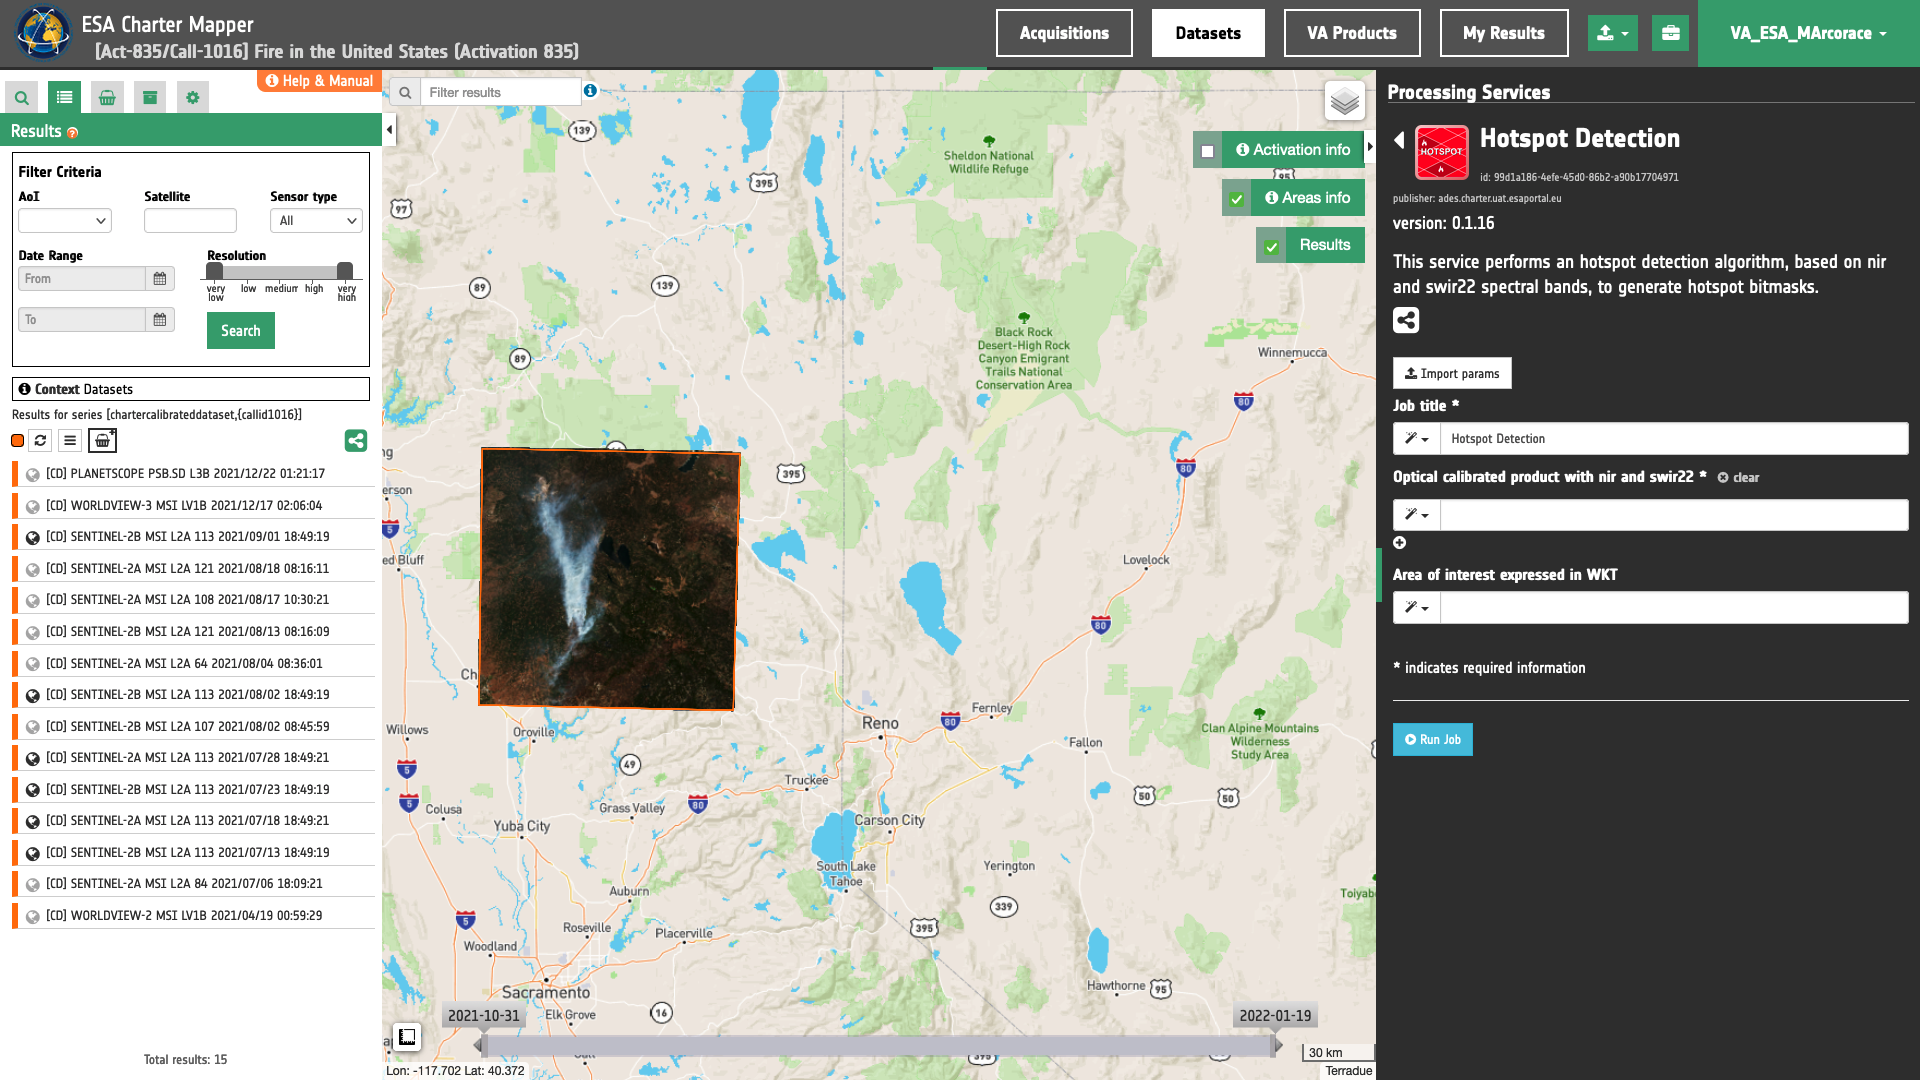
Fill the parameters
After the definition of spatial and time filters, you can employ HOTSPOT, by using the identified Calibrated Dataset from the Sentinel-2 mission.
To do so you can fill the parameters as described in the following sections.
Job name
- Insert as job name:
HOTSPOT - 13/07/2021 - Dixie Fire - CAL US
Reference input
Drag and Drop the selected item [CD] SENTINEL-2B MSI L2A 113 2021/07/13 18:49:19 in the Optical calibrated product with nir and swir22 field.
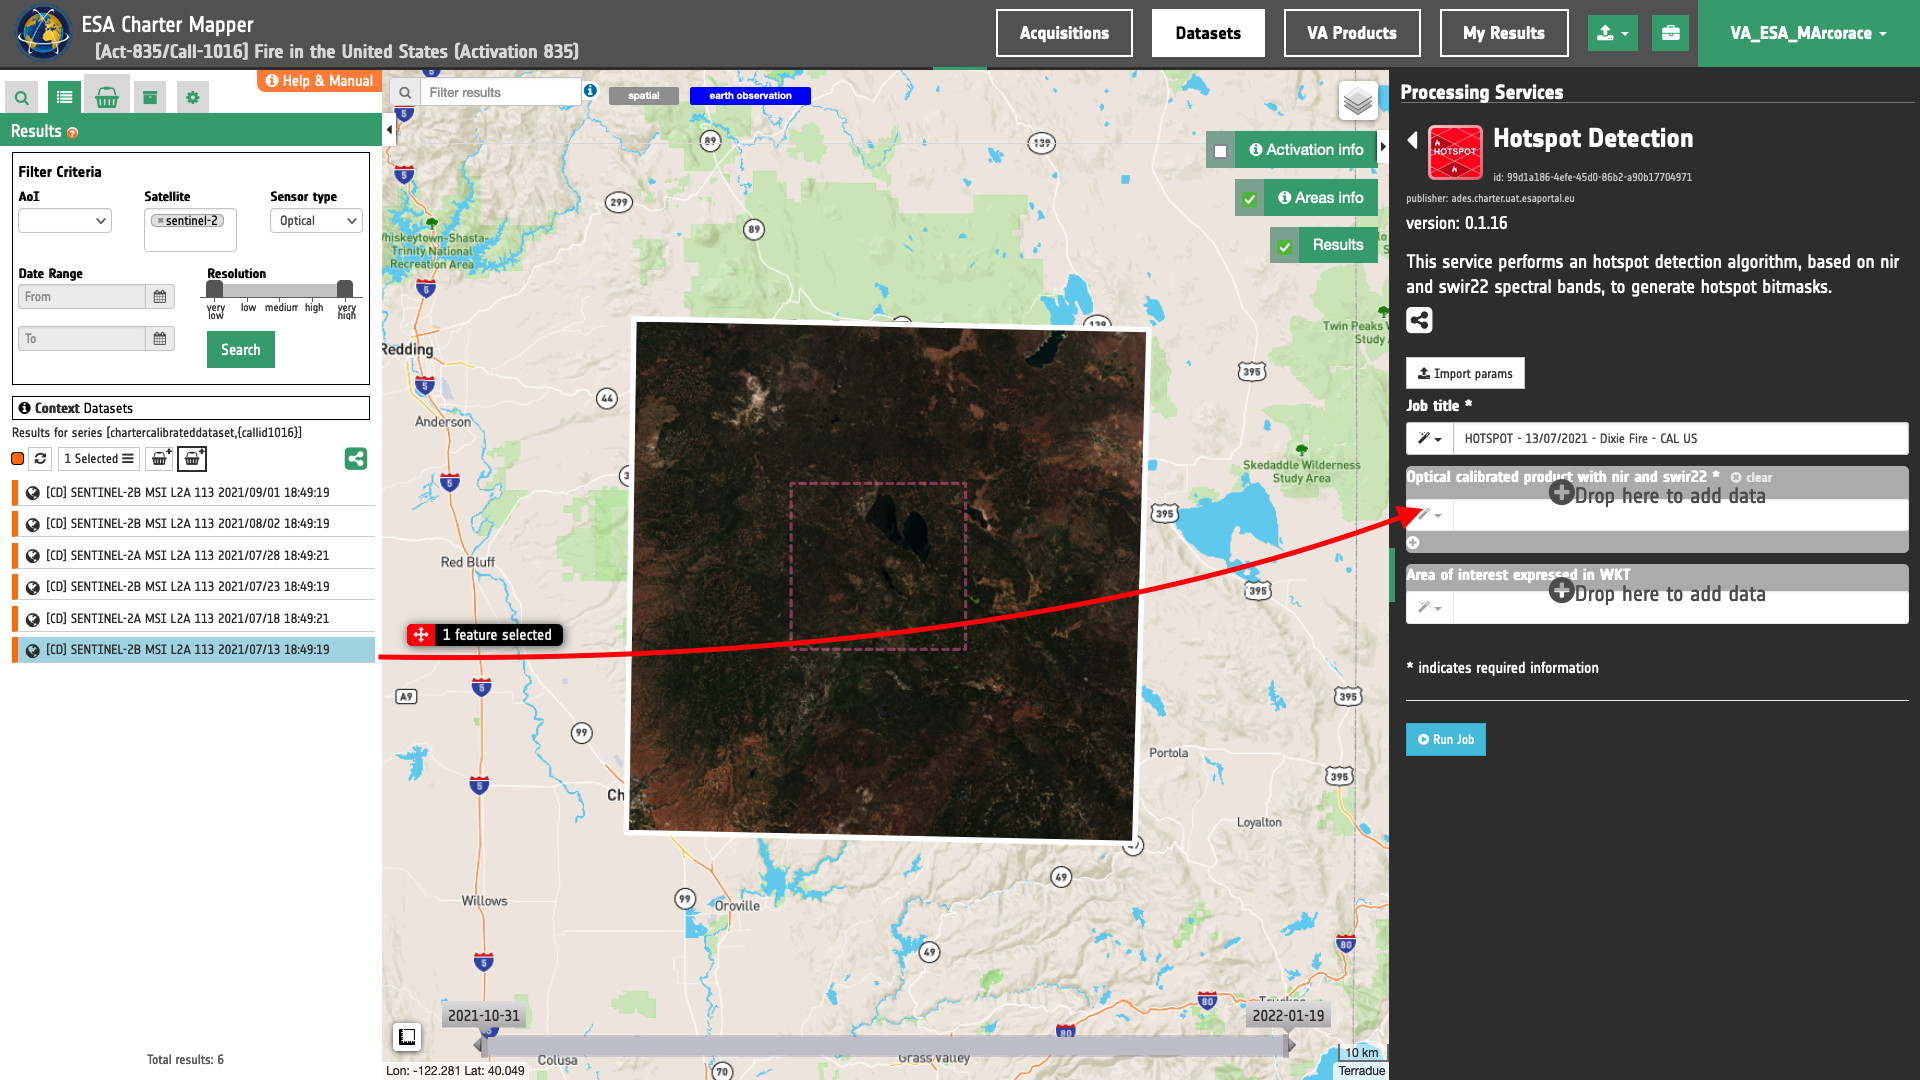
Warning
Drag and drop the Dataset (e.g. "[CD] SENTINEL-2B MSI L2A 113 2021/07/13 18:49:19") and not the single-band asset (e.g. "swir22") into Optical calibrated product with nir and swir22 field.
Area of interest expressed as Well-known text
The “Area of interest as Well Known Text” can be defined by using the drawn polygon defined with the area filter.
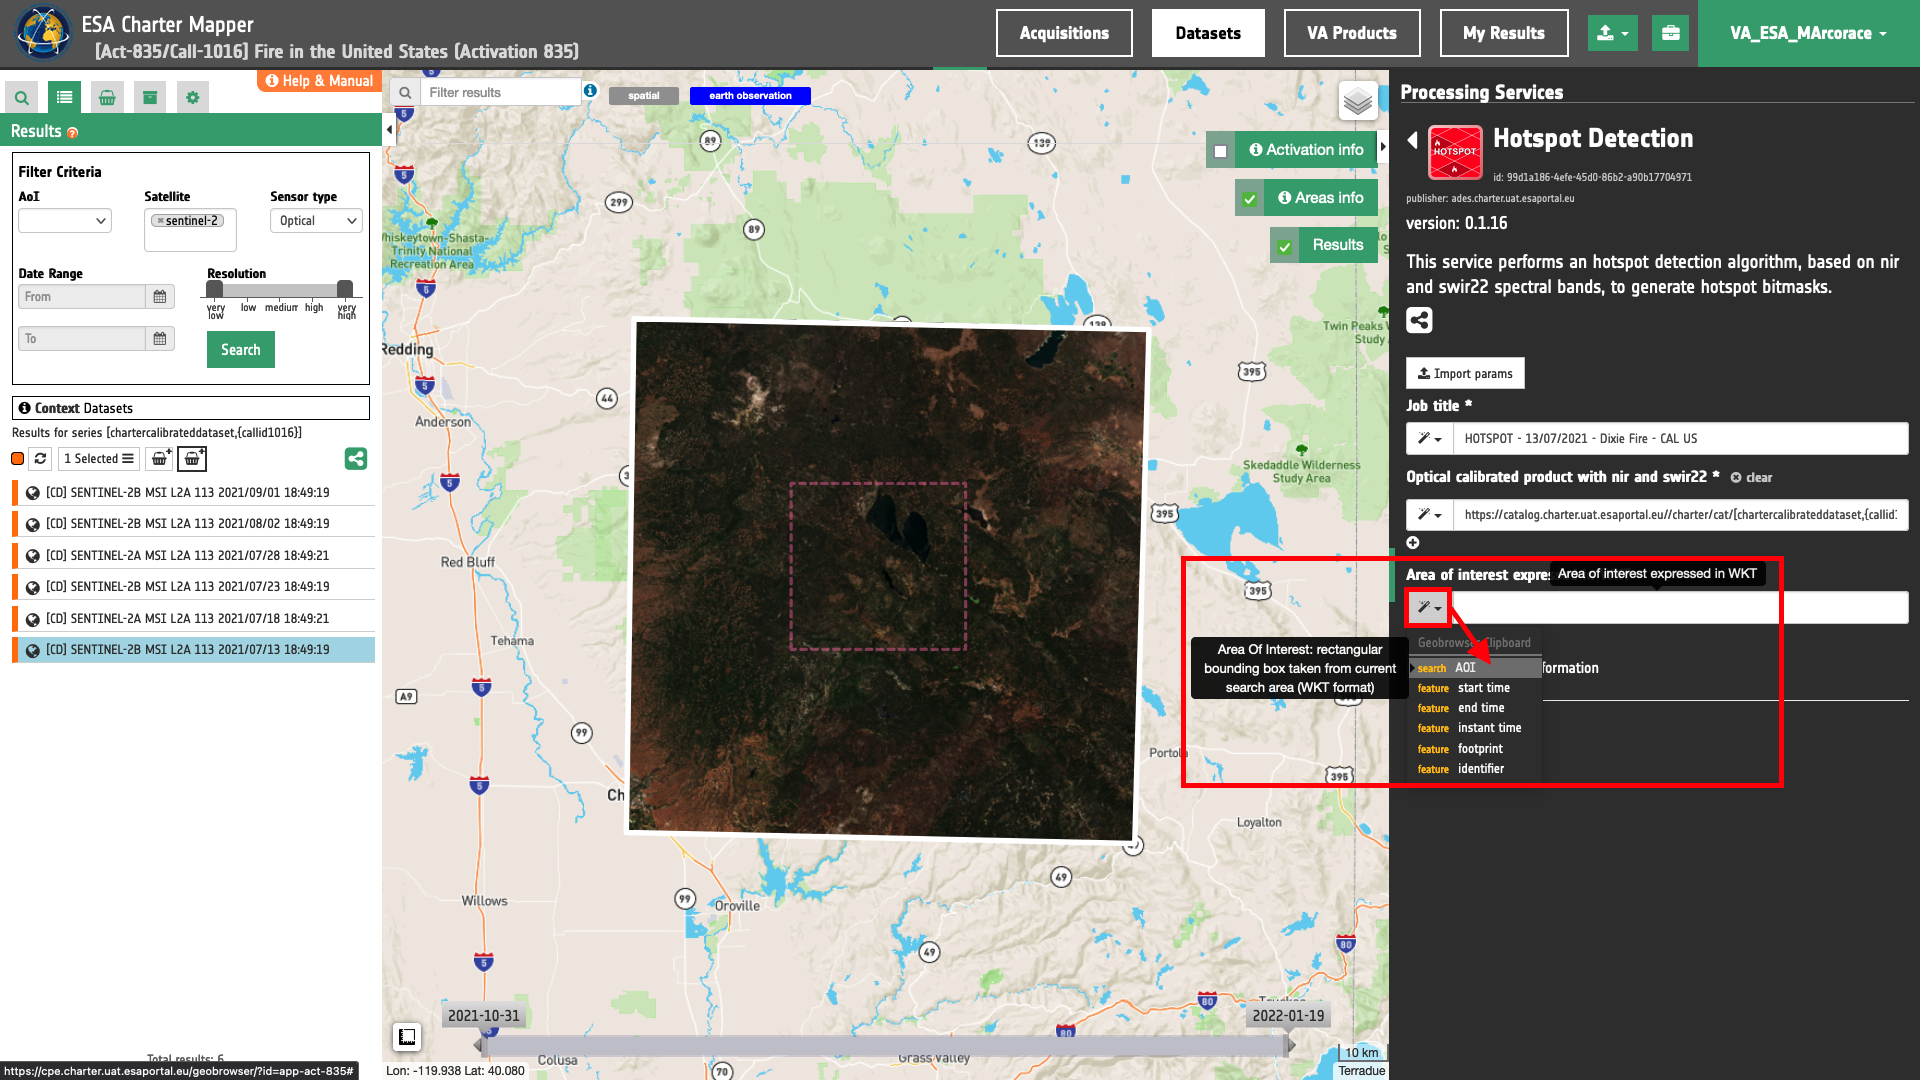
Tip
In the definition of “Area of interest as Well Known Text” it is possible to apply as AOI the drawn polygon defined with the area filter. To do so, click on the button in the left side of the "Area of interest expressed as Well-known text" box and select the option AOI from the list. The platform will automatically fill the parameter value with the rectangular bounding box taken the from current search area in WKT format.
Note
This parameter is optional.
Run the job
Click on the button Run Job and see the Running Job
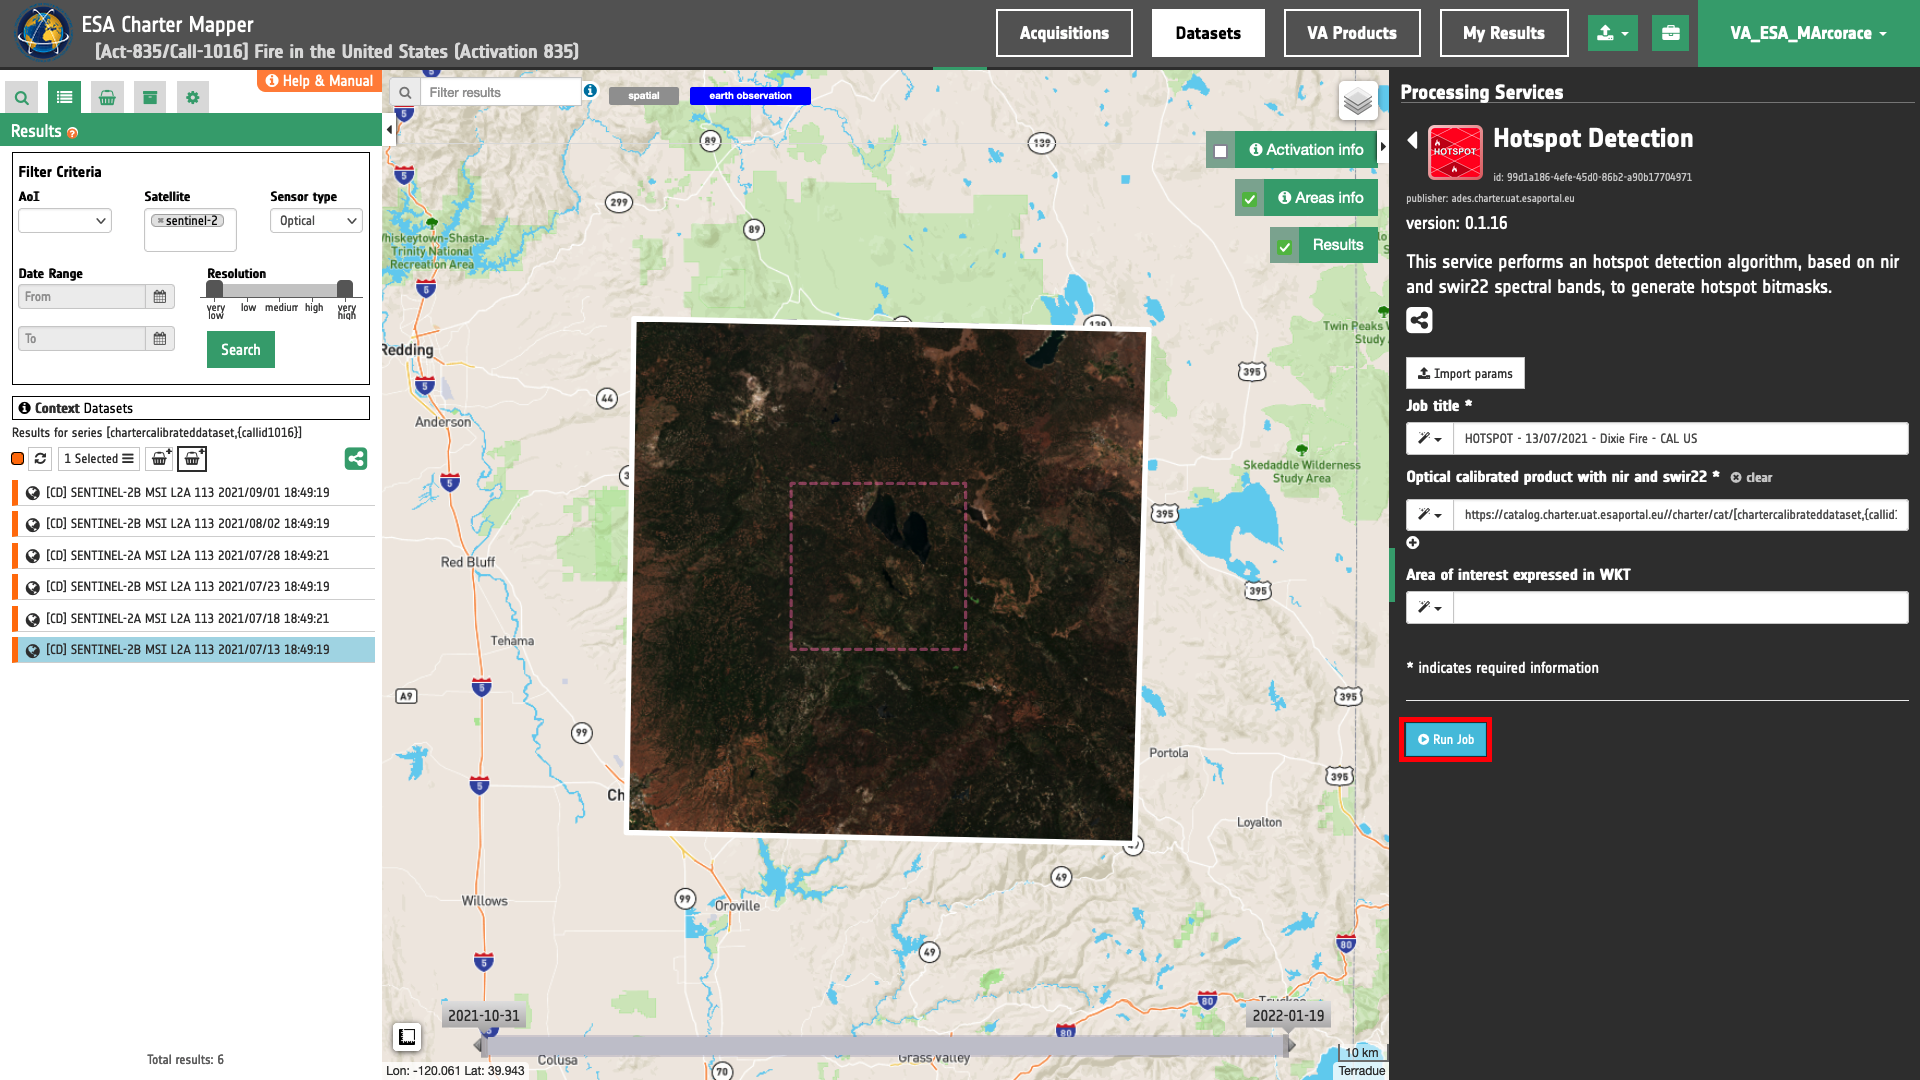
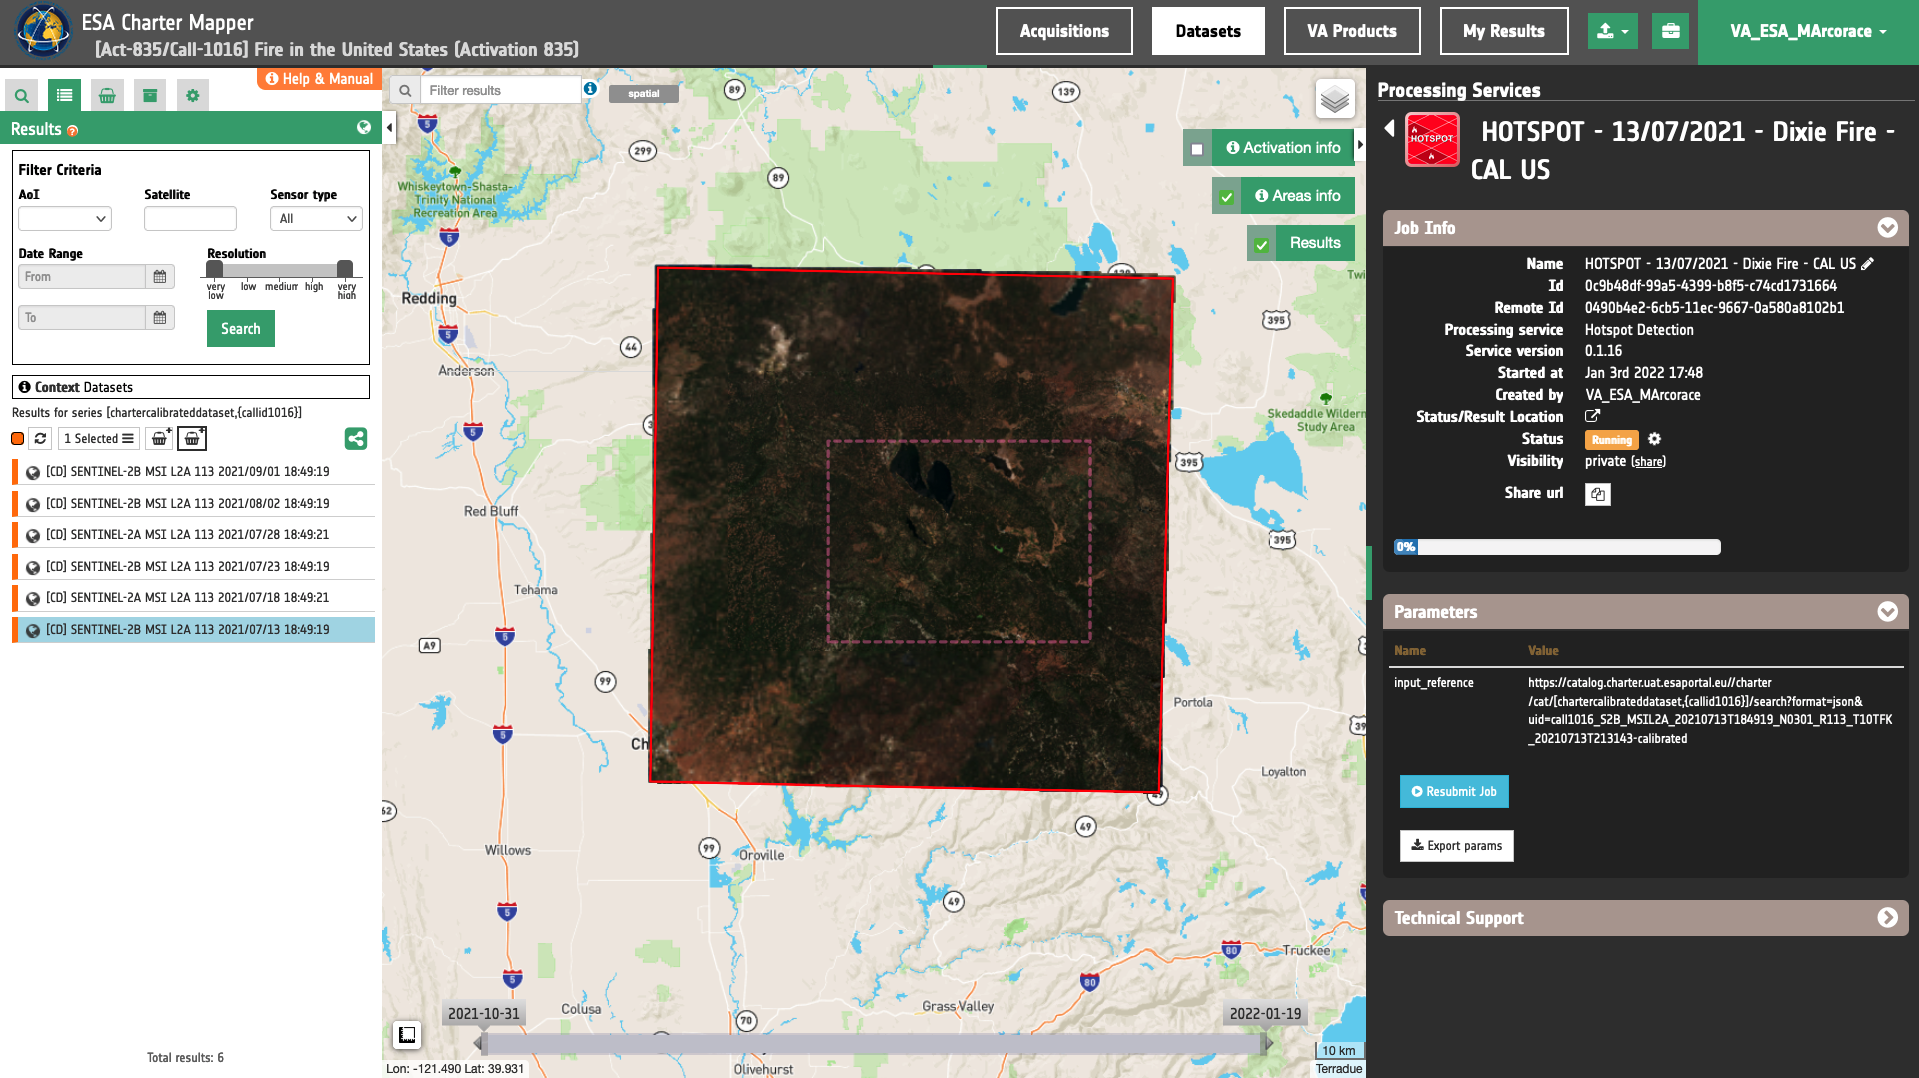
You can monitor job progress through the progress bar.
Results: download and visualization
Once the job is completed, click on the button Show results at the bottom of the processing service panel.
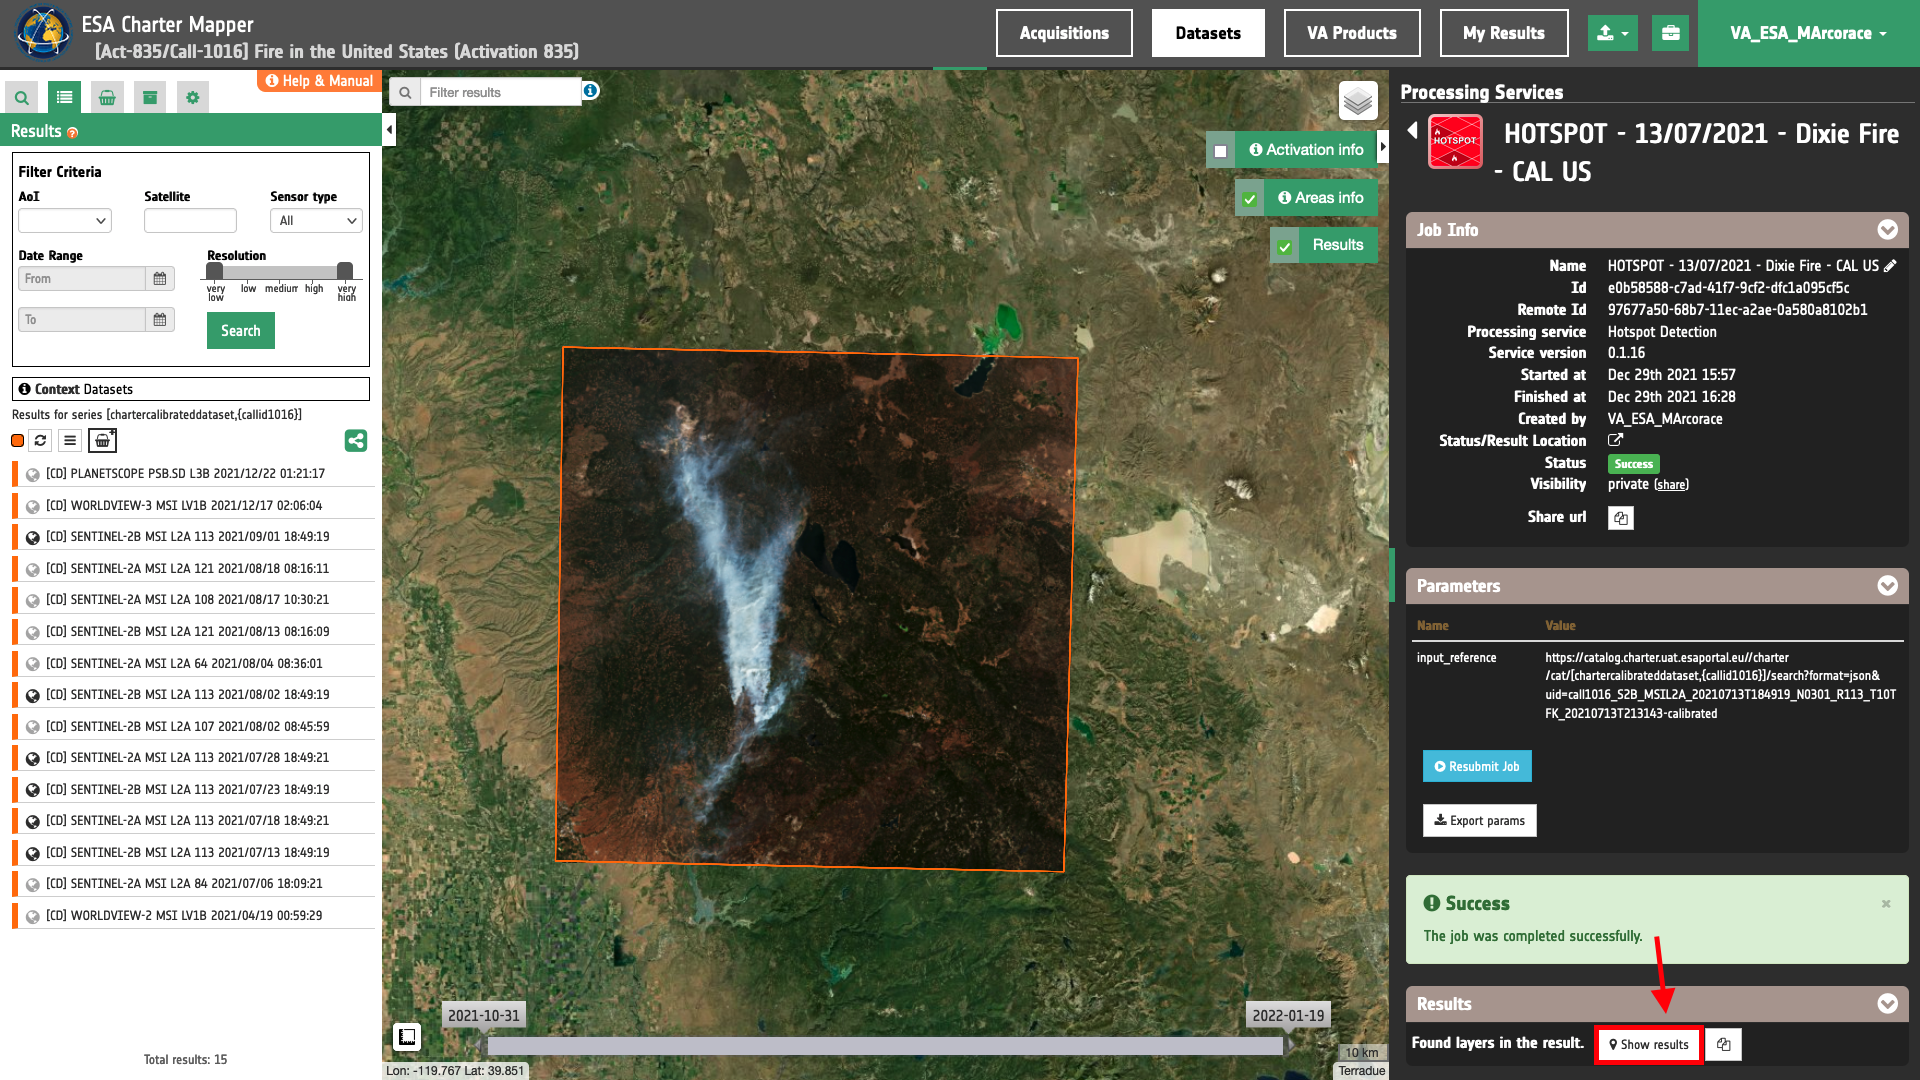
Tip
You can also save the parameters employed in this job by clicking on the Export params button in the right panel. This allows you to copy all your entries to the clipboard. This is meant to be used for a quick re-submission of a similar job after a fine tuning of the parameters (e.g. to add a color formula later).
Below is reported the syntax which includes all the parameters employed in this example.
{
   "input_reference": "https://catalog.charter.uat.esaportal.eu//charter/cat/[chartercalibrateddataset,{callid1016}]/search?format=json&uid=call1016_S2B_MSIL2A_20210713T184919_N0301_R113_T10TFK_20210713T213143-calibrated"
}
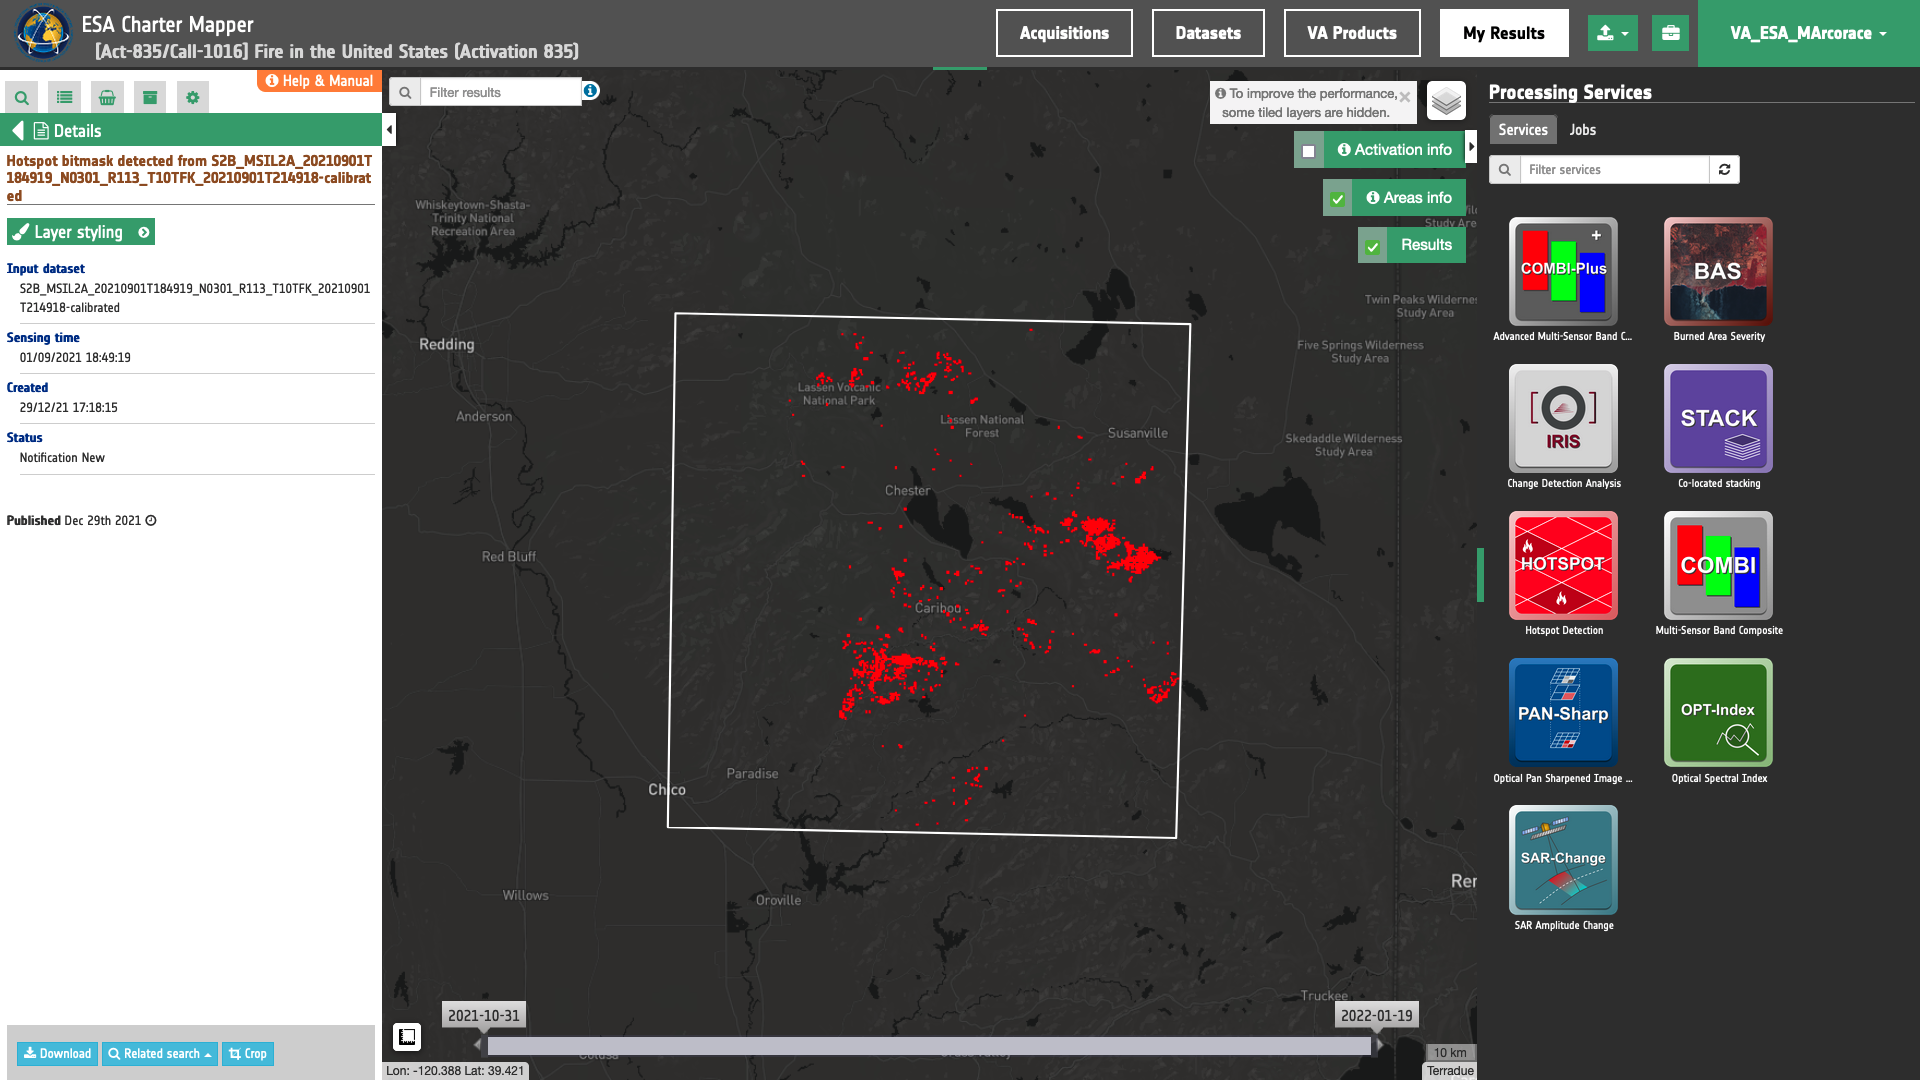
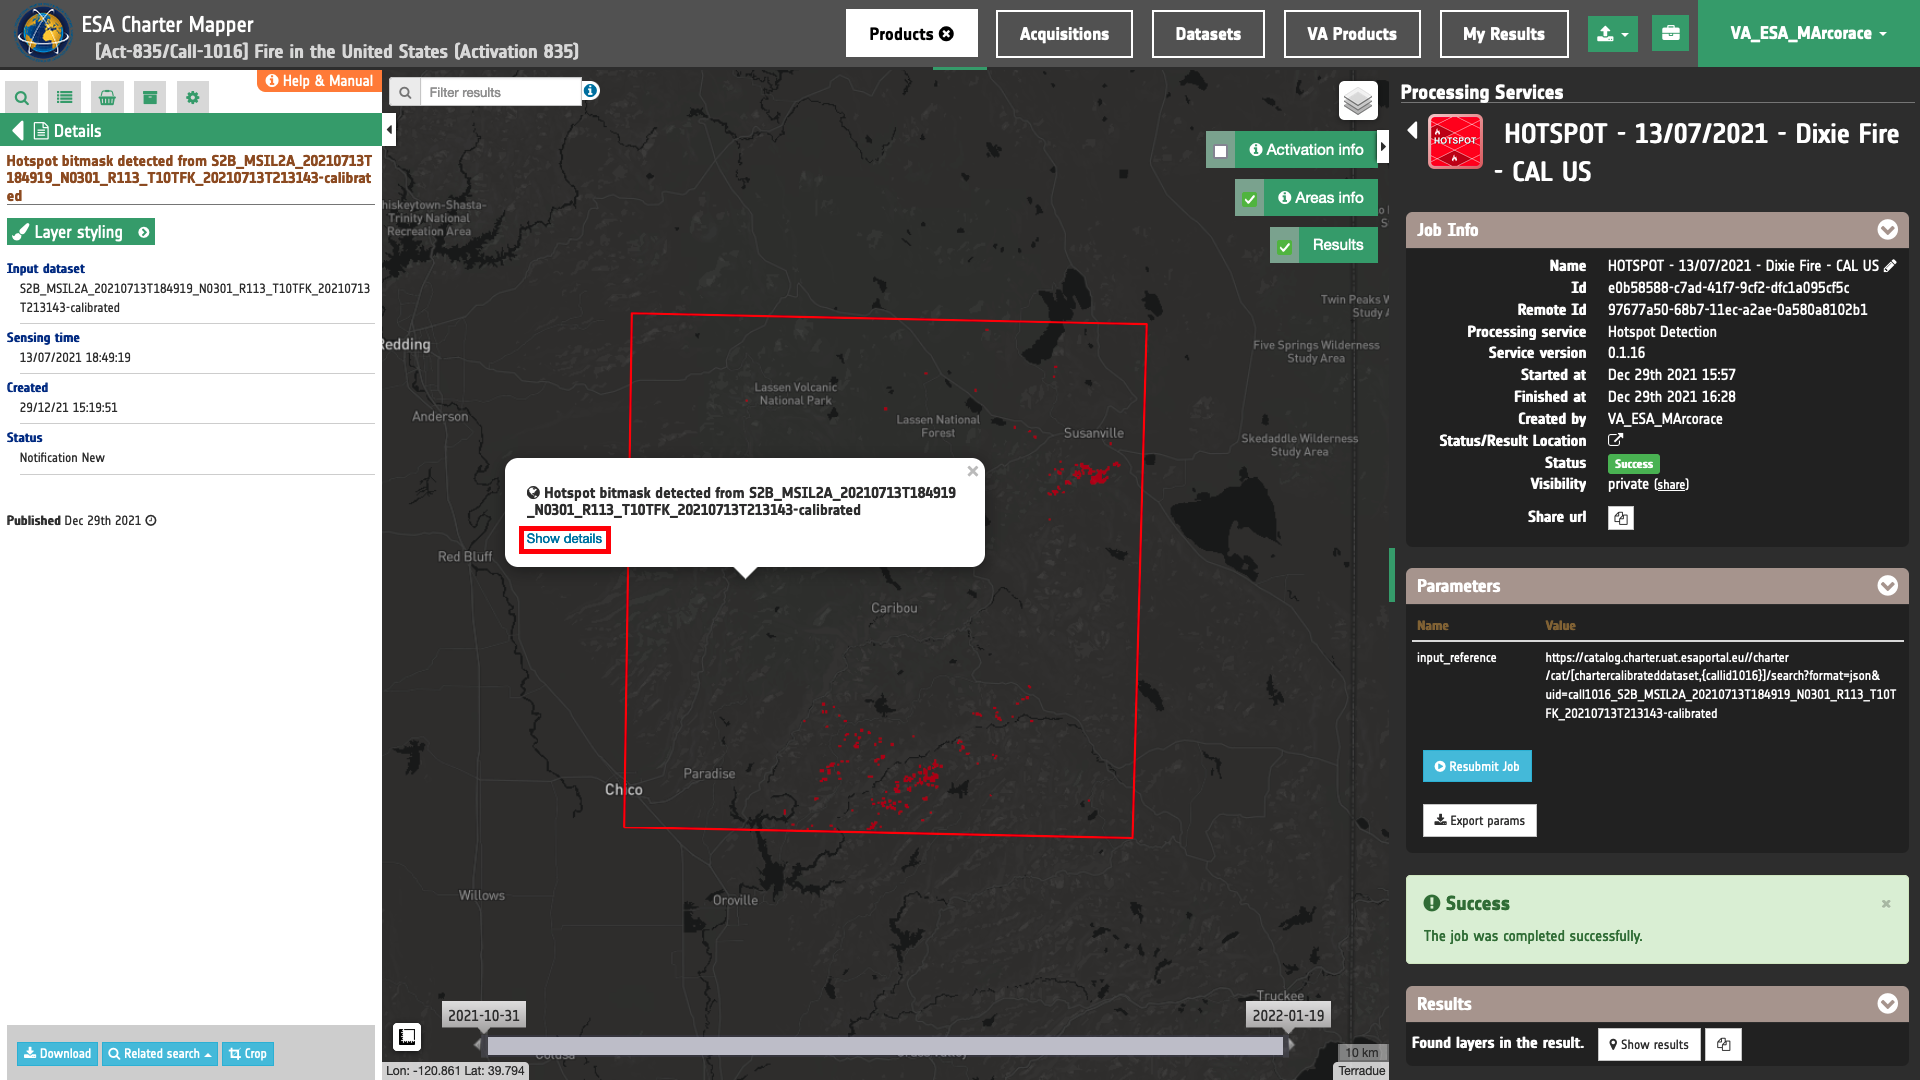
Visualization
See the result on the map. The preview appears within the area defined in the spatial filter.
To get more information about the product just click on the preview in the map, a bubble showing the name of the layer “Hotspot bitmask detected from S2B_MSIL2A_20210901T184919_N0301_R113_T10TFK_20210901T214918-calibrated” will appear and then click on the Show details button.
Tip
To quickly access Product Details double click on the layer from the Results list.
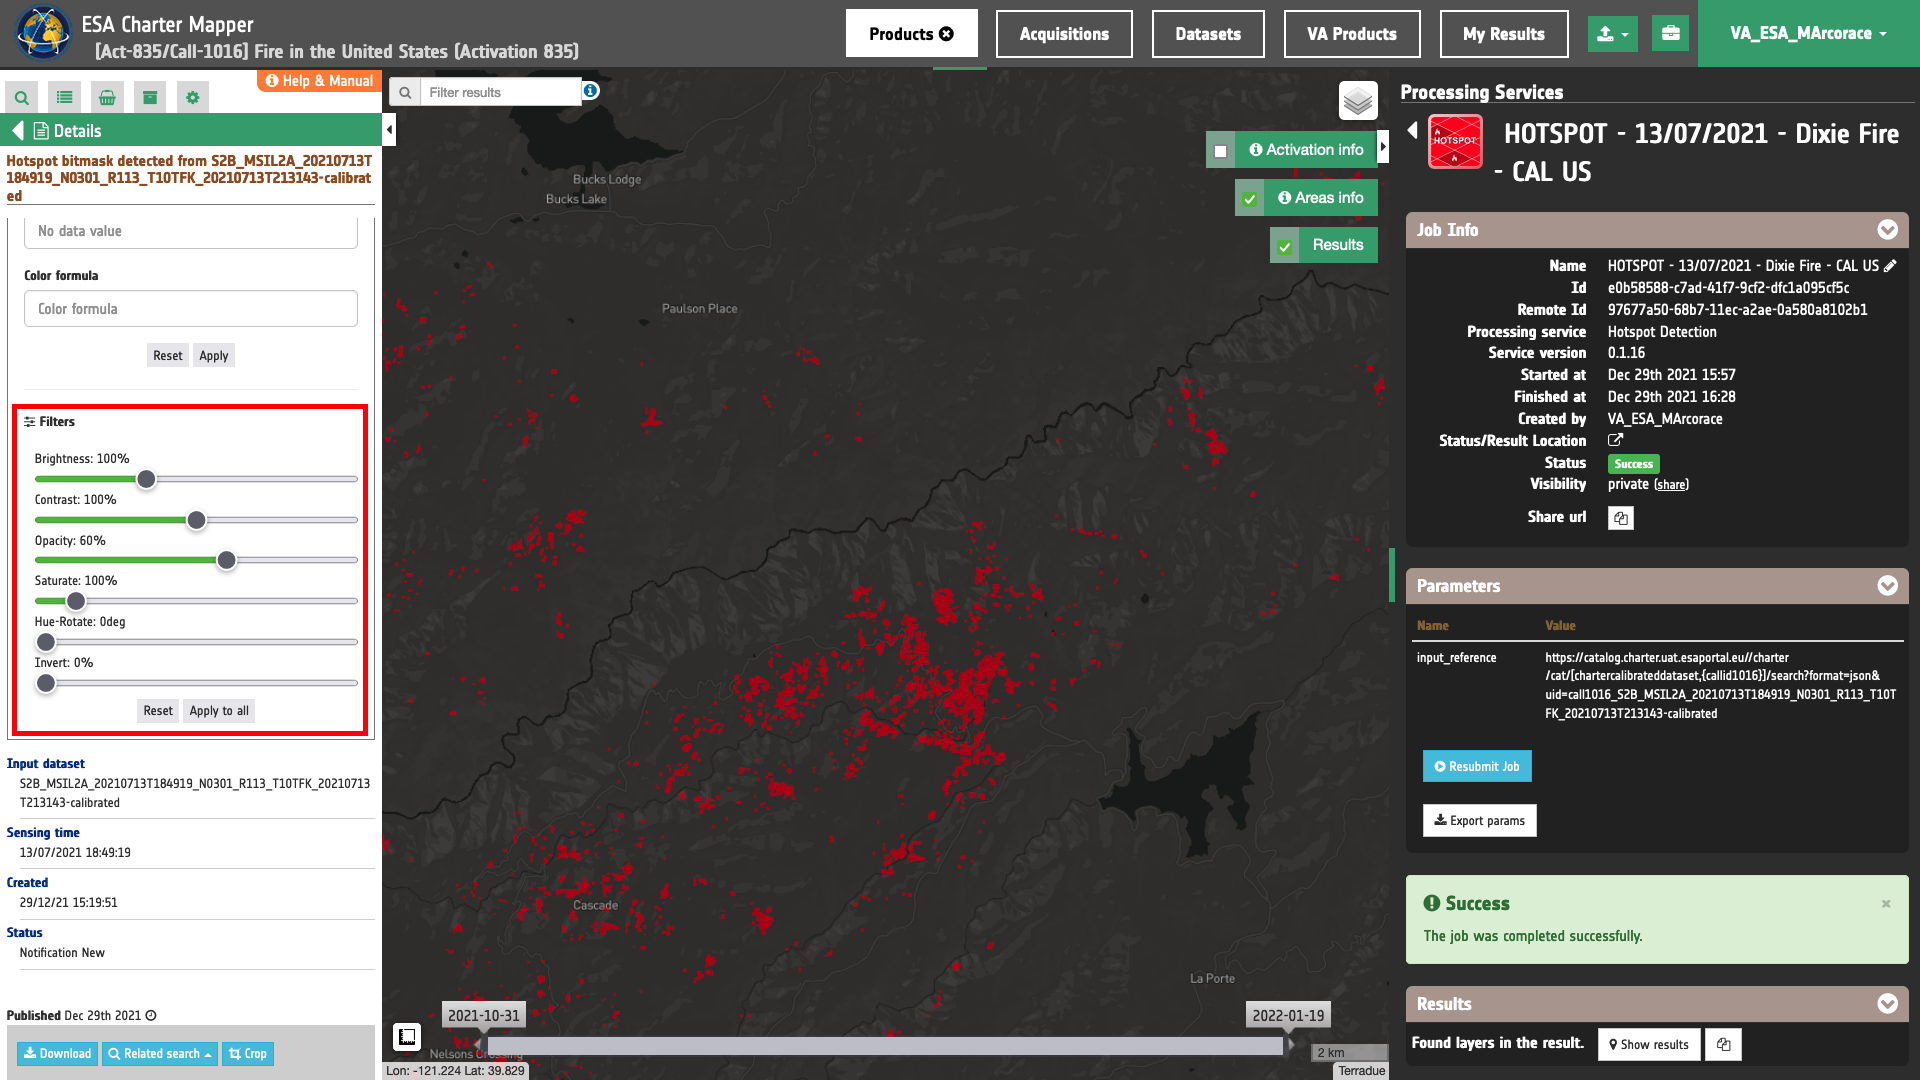
In the left panel of the interface, the details of Job Result will appear with Product metadata. Furthermore by clicking on Layer styling you can also access to the View options. In here it is possible to see histogram/s of the Product which is visible in the map, set color formula, change Filters (e.g. Brightness, Opacity).
Tip
To visually compare the product overview with the underlying base layer (e.g. Dark map) you can set the Opacity filter under View options as 50%.
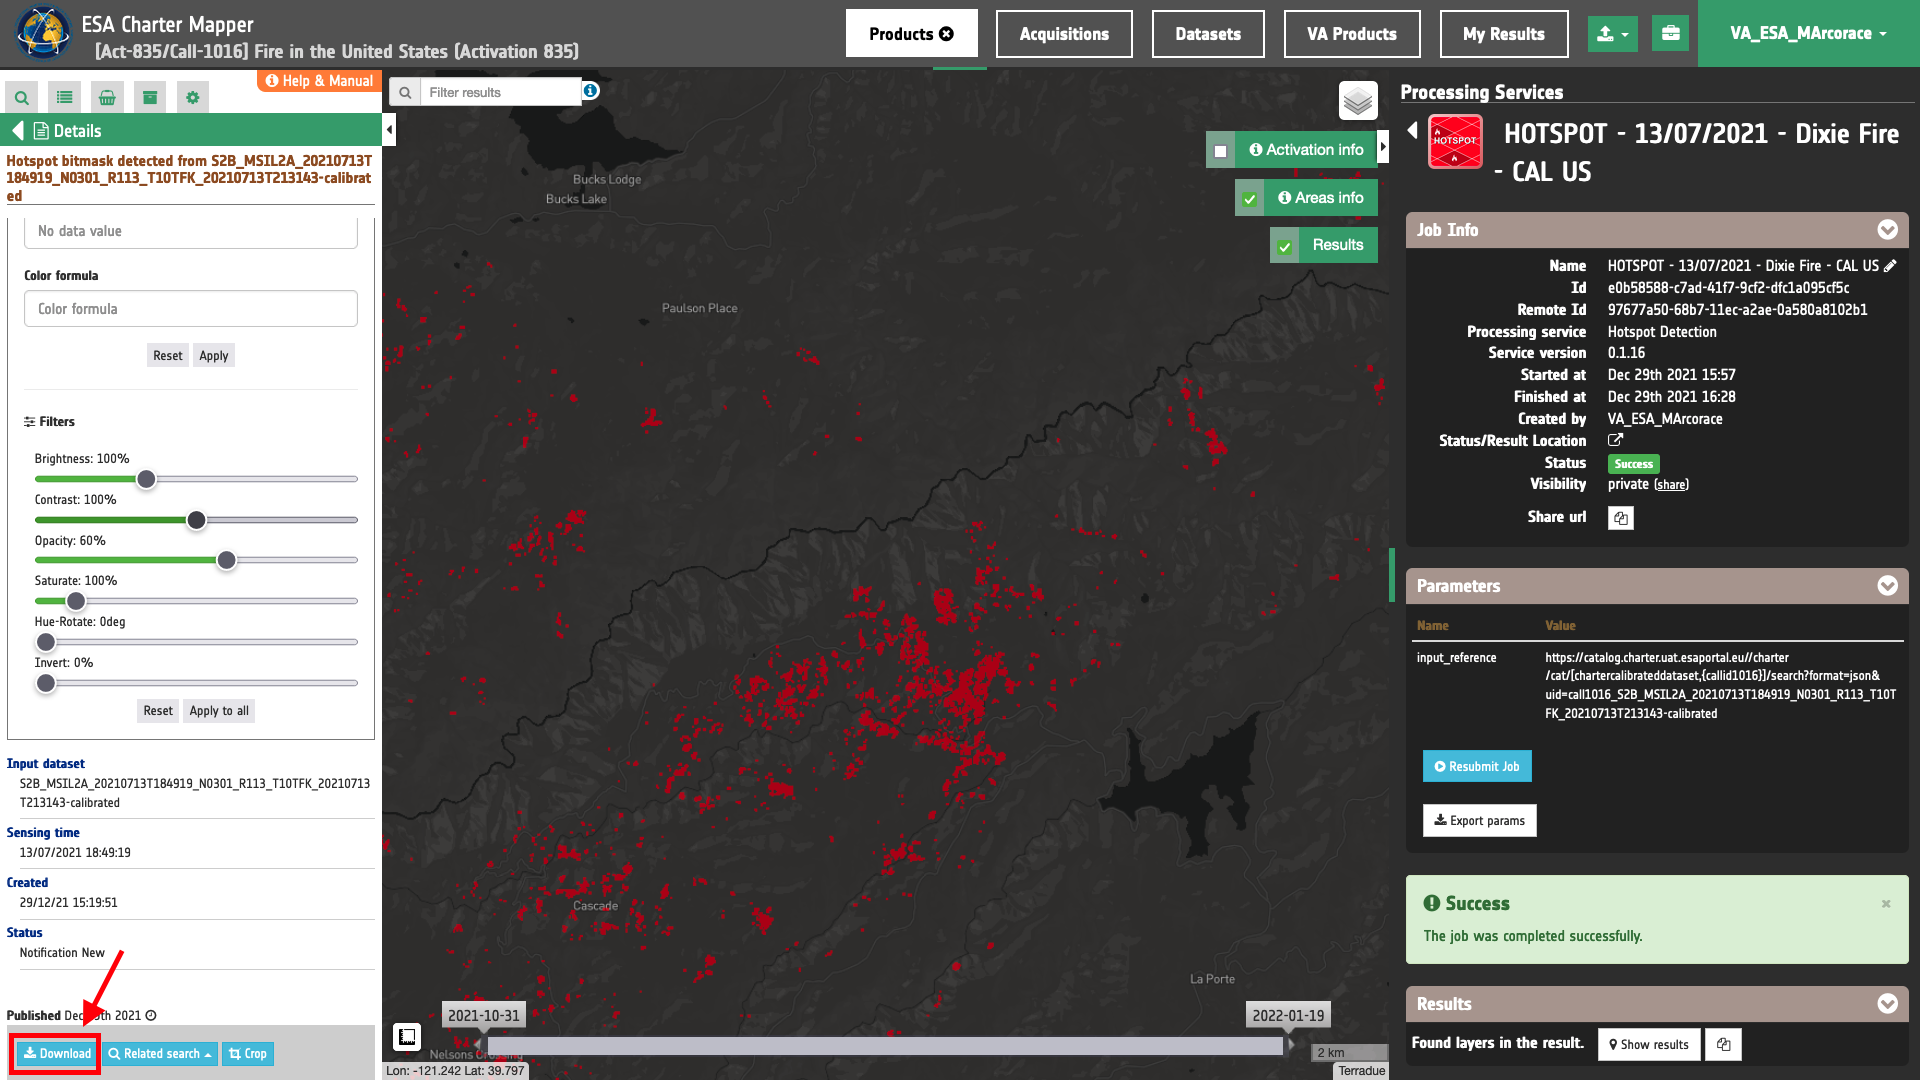
Download
In the Hotspot Detection (HOTSPOT) service the following files are produced:
- hotspot: single band asset
hotspotrepresenting a bitmask of active fires (1=fire, 0=no-fire) derived from the input calibrated dataset, given as single band 1-bit raster in COG format, - overview-hotspot: overview asset derived from the hotspot bitmask showing active fires in red with transparency, given as 4-band 8-bit RGBA in COG format.
These products can be downloaded by clicking on the Download button located at the bottom of the Product Details tab in the left panel.
Other examples for multitemporal hotspot detection
HOTSPOT can be resubmitted again by using other calibrated datasets to monitor multiple stages of the event as shown in the below examples:
HOTSPOT 18/07/2021 Dixie Fire, US

HOTSPOT 23/07/2021 Dixie Fire, US

HOTSPOT 28/07/2021 Dixie Fire, US

HOTSPOT 02/08/2021 Dixie Fire, US

HOTSPOT 01/09/2021 Dixie Fire, US