Advanced EO data Visualization
Customized RGB composite using Combine assets
In addition to pre-defined overviews the ESA Charter Mapper can also provide custom composites derived from a combination of single band assets defined by the user. As an example, in Figure 1 and 2 are shown True color and Color Infrared (vegetation) composites derived on the fly in the ESA Charter Mapper using multiple assets from Kompsat-3 AEISS data.
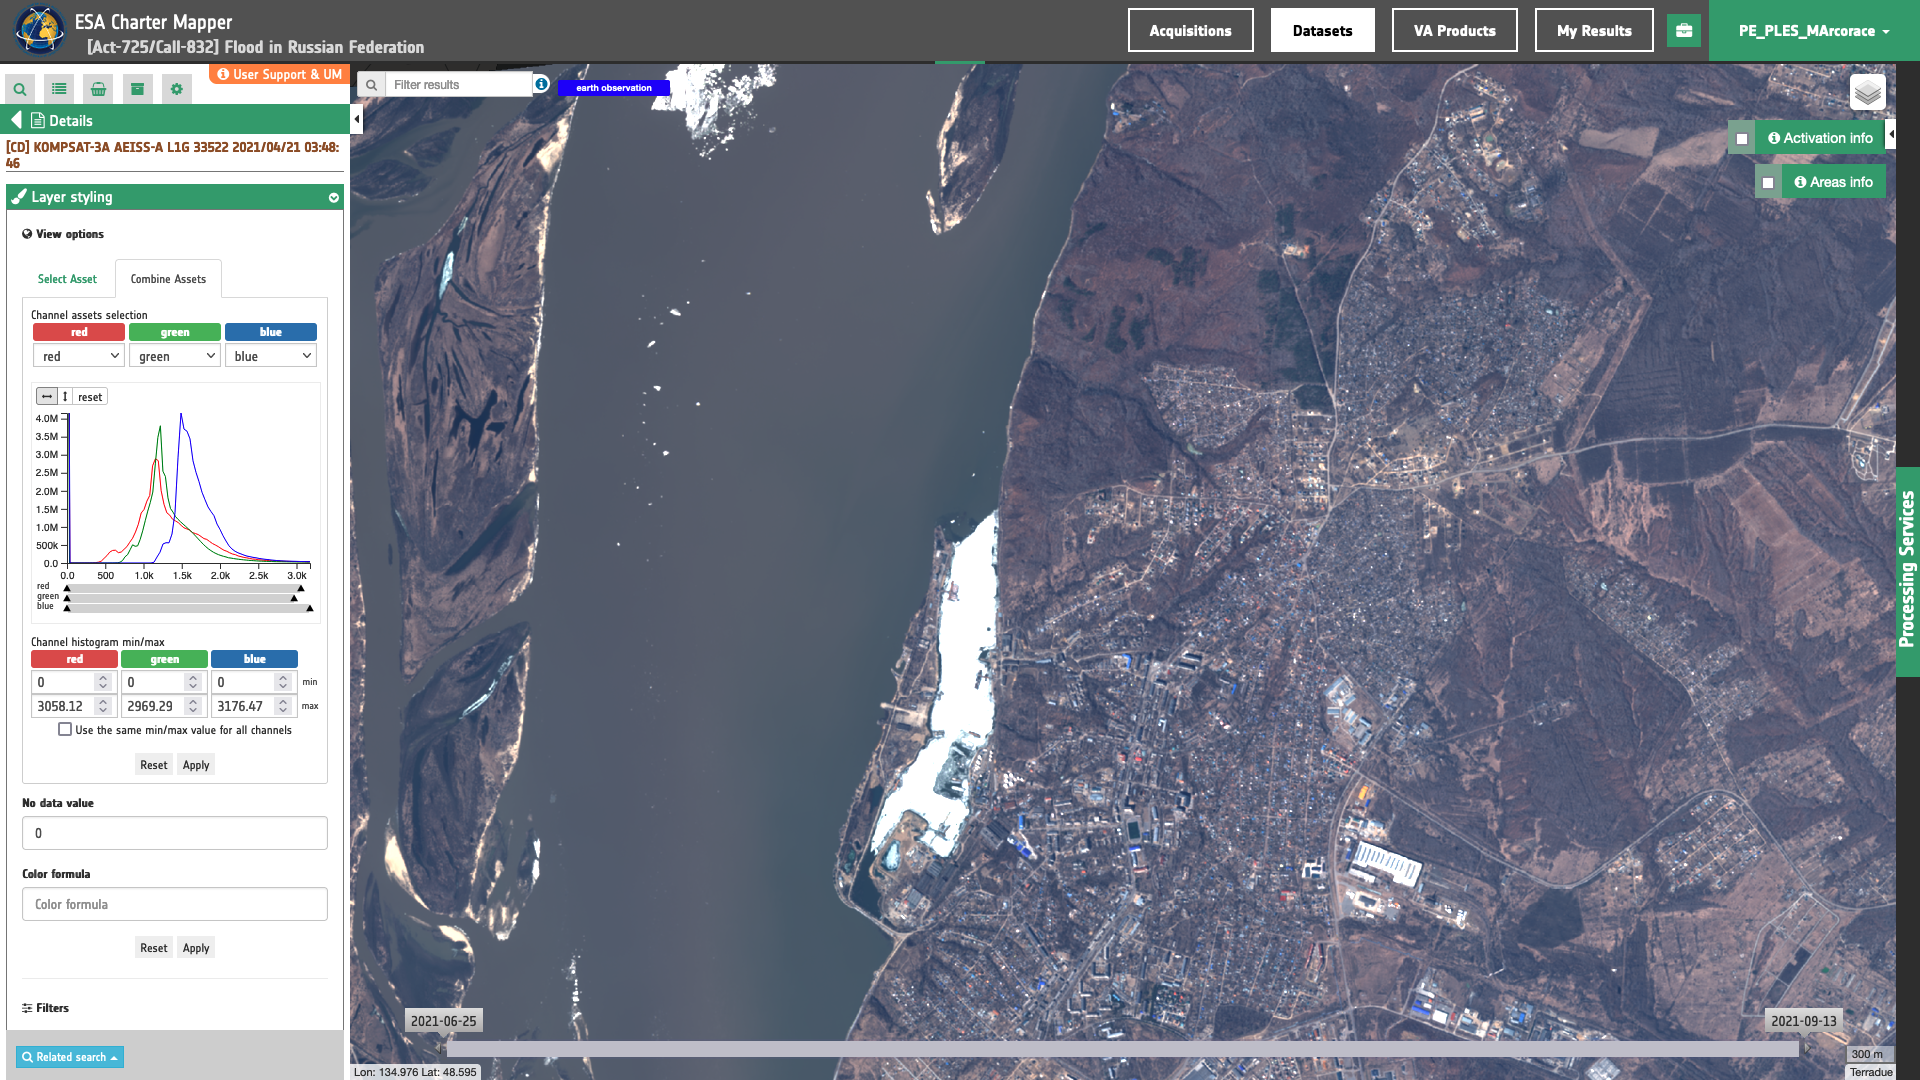
Figure 1 - True Color (TRC) full resolution RGB derived on the fly in the ESA Charter Mapper using the Combine Assets function and a combination of intra-sensor single-band assets from Kompsat-3 AEISS calibrated data acquired over the Russian Federation (Image credit: KARI).
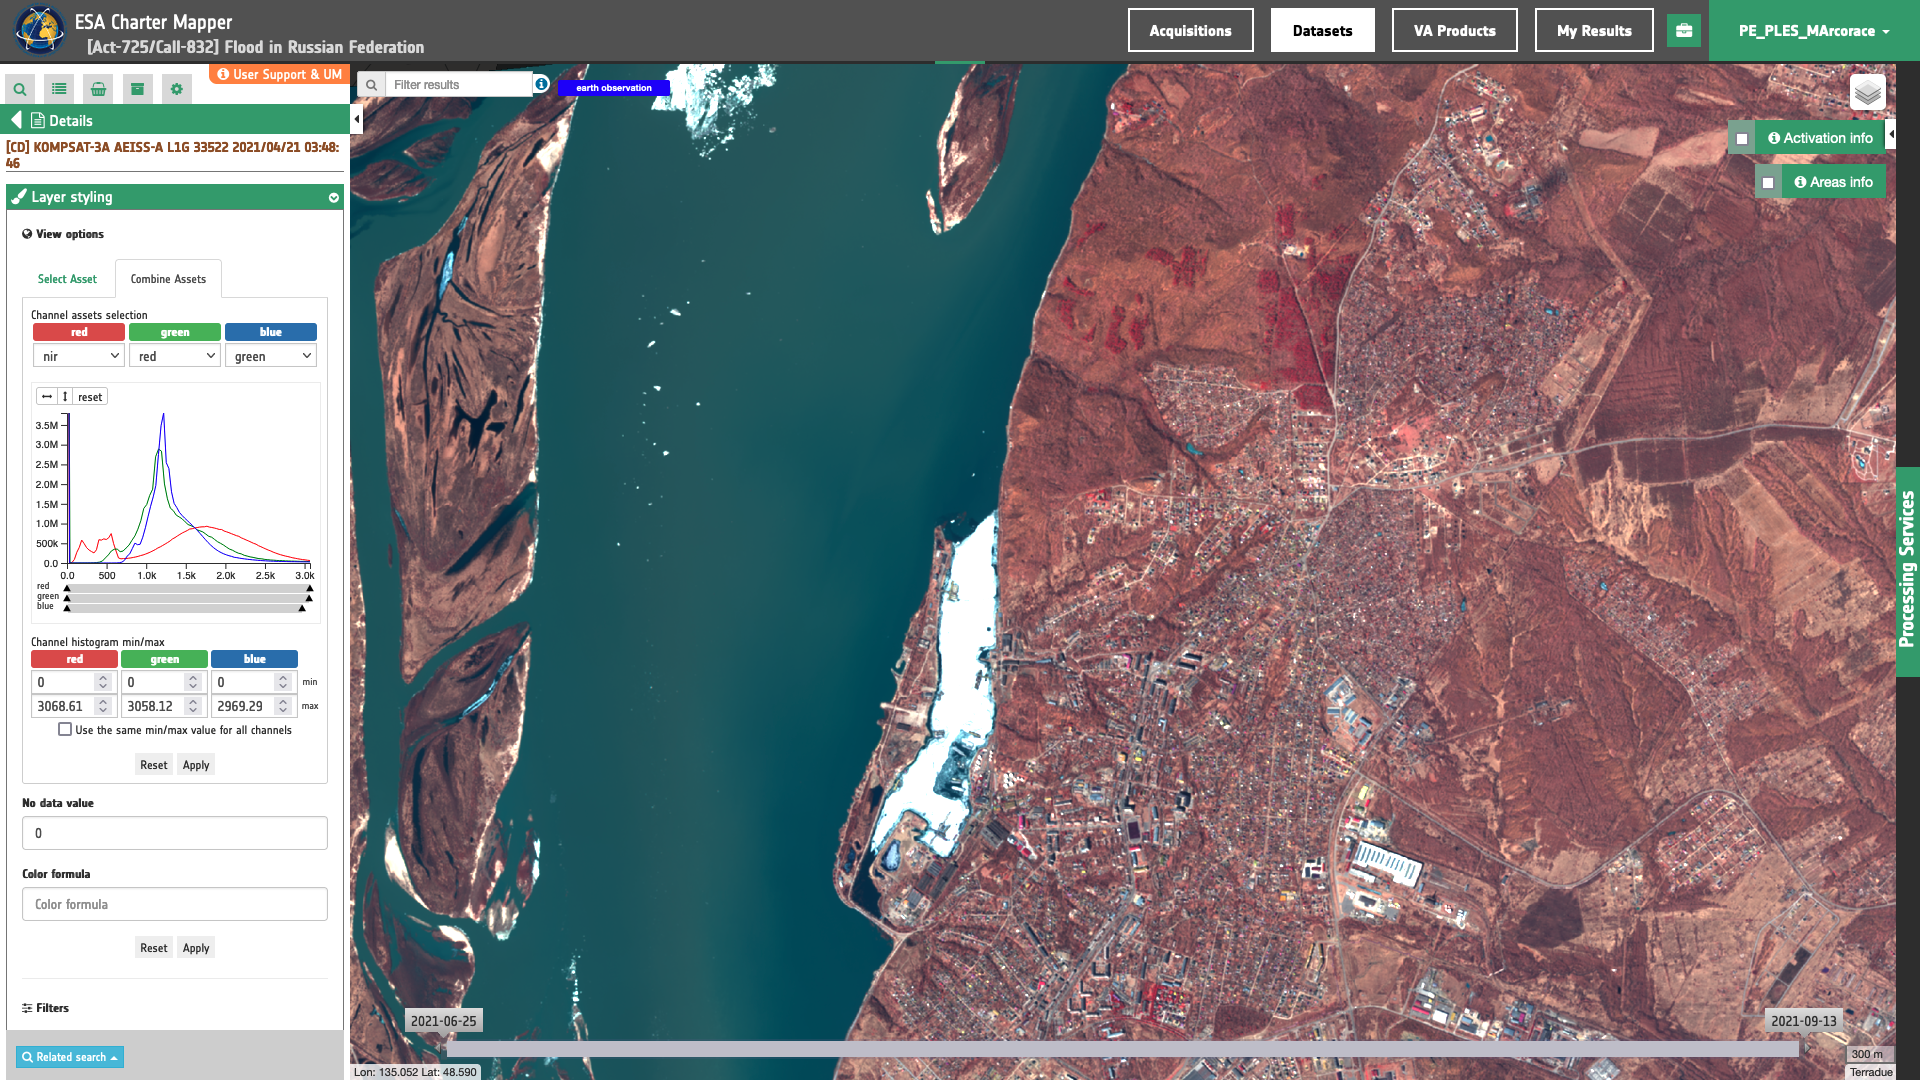
Figure 2 - Color Infrared Vegetation (CIV) full resolution RGB derived on the fly in the ESA Charter Mapper using the Combine Assets function and a combination of intra-sensor single-band assets from Kompsat-3 AEISS calibrated data acquired over the Russian Federation (Image credit: KARI).
The Combine Asset funtion is not only dedicated for single assets derived from source calibrated EO data ingested from COS-2, but also for the advanced visualization of single assets from the Products of the ESA Charter Mapper Processing Services. For instance using the Combine Assets function, under the Layer Styling options of the Product layer derived from the Optical Spectral Index service, multiple spectral indexes can be put together to create an RGB band composite. In this way RGB can be immediately made by using just the resulting product of the Optical Spectral Index service. See for example the below on the fly RGB using R=NDBI G=NDVI and B=NDWI with a S2 image over the Hiroshima bay in Japan. Built up areas in red tones, vegetated land in green tones and water in shades of blue.
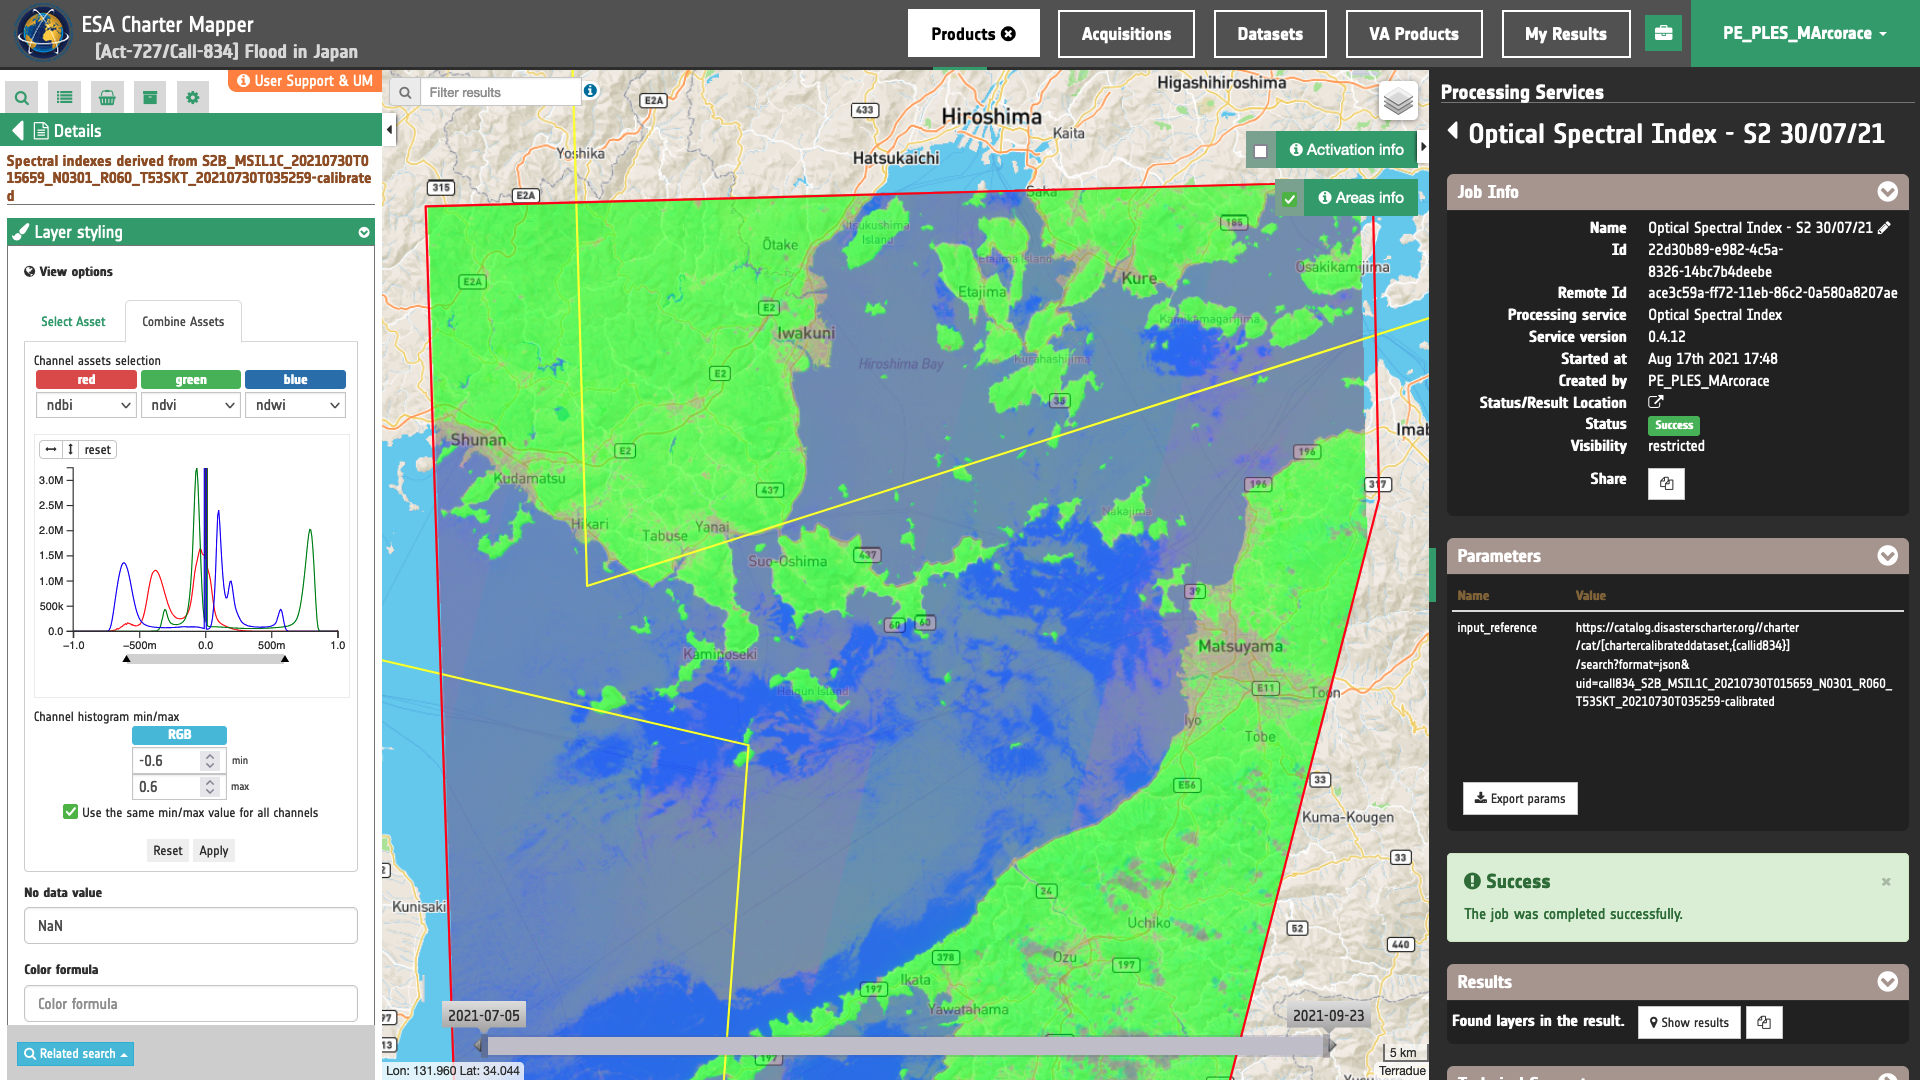
Figure 3 - False color RGB composite using multiple spectral indexes derived from Sentinel-2 MSI data acquired over the Hiroshima bay in Japan (Image credit: ESA, Copernicus).
Combine assets can be used also to highlight a single spectral index by using one of the RGB channels. In figure 4 is shown an example which is useful to highlight vegetated areas in green after the setting of NDVI=G with min=0.3 and max=0.7, and with NDVI=B=R with min=max=0.
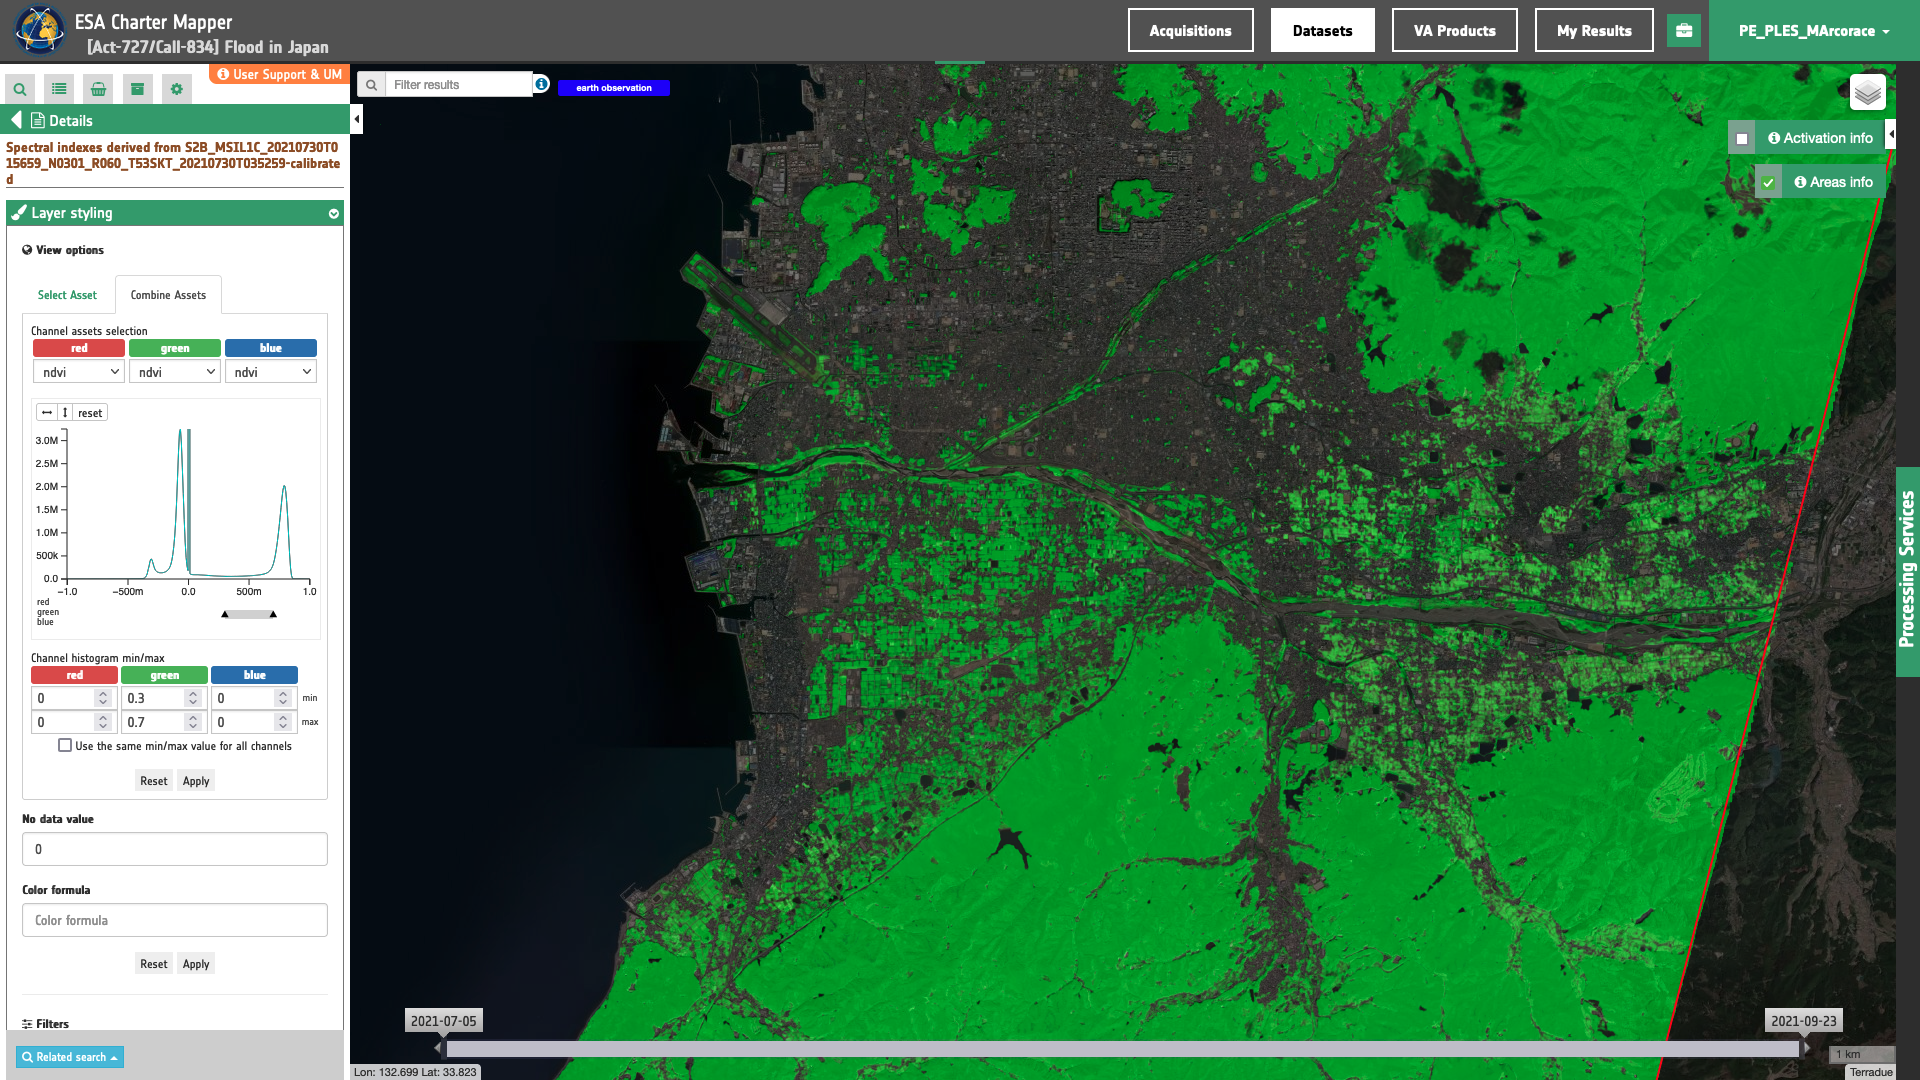
Figure 4 - RGB composite using the NDVI index after the manual stretching on the G-channel derived from Sentinel-2 MSI data acquired over the Hiroshima bay in Japan (Image credit: ESA, Copernicus).
Histograms visualization under Combine Assets
Also under the Combine Asset the ESA Charter Mapper offer the possibility automatically perform a 2% cumulative count cut of the histogram (see below figures 5 and 6).
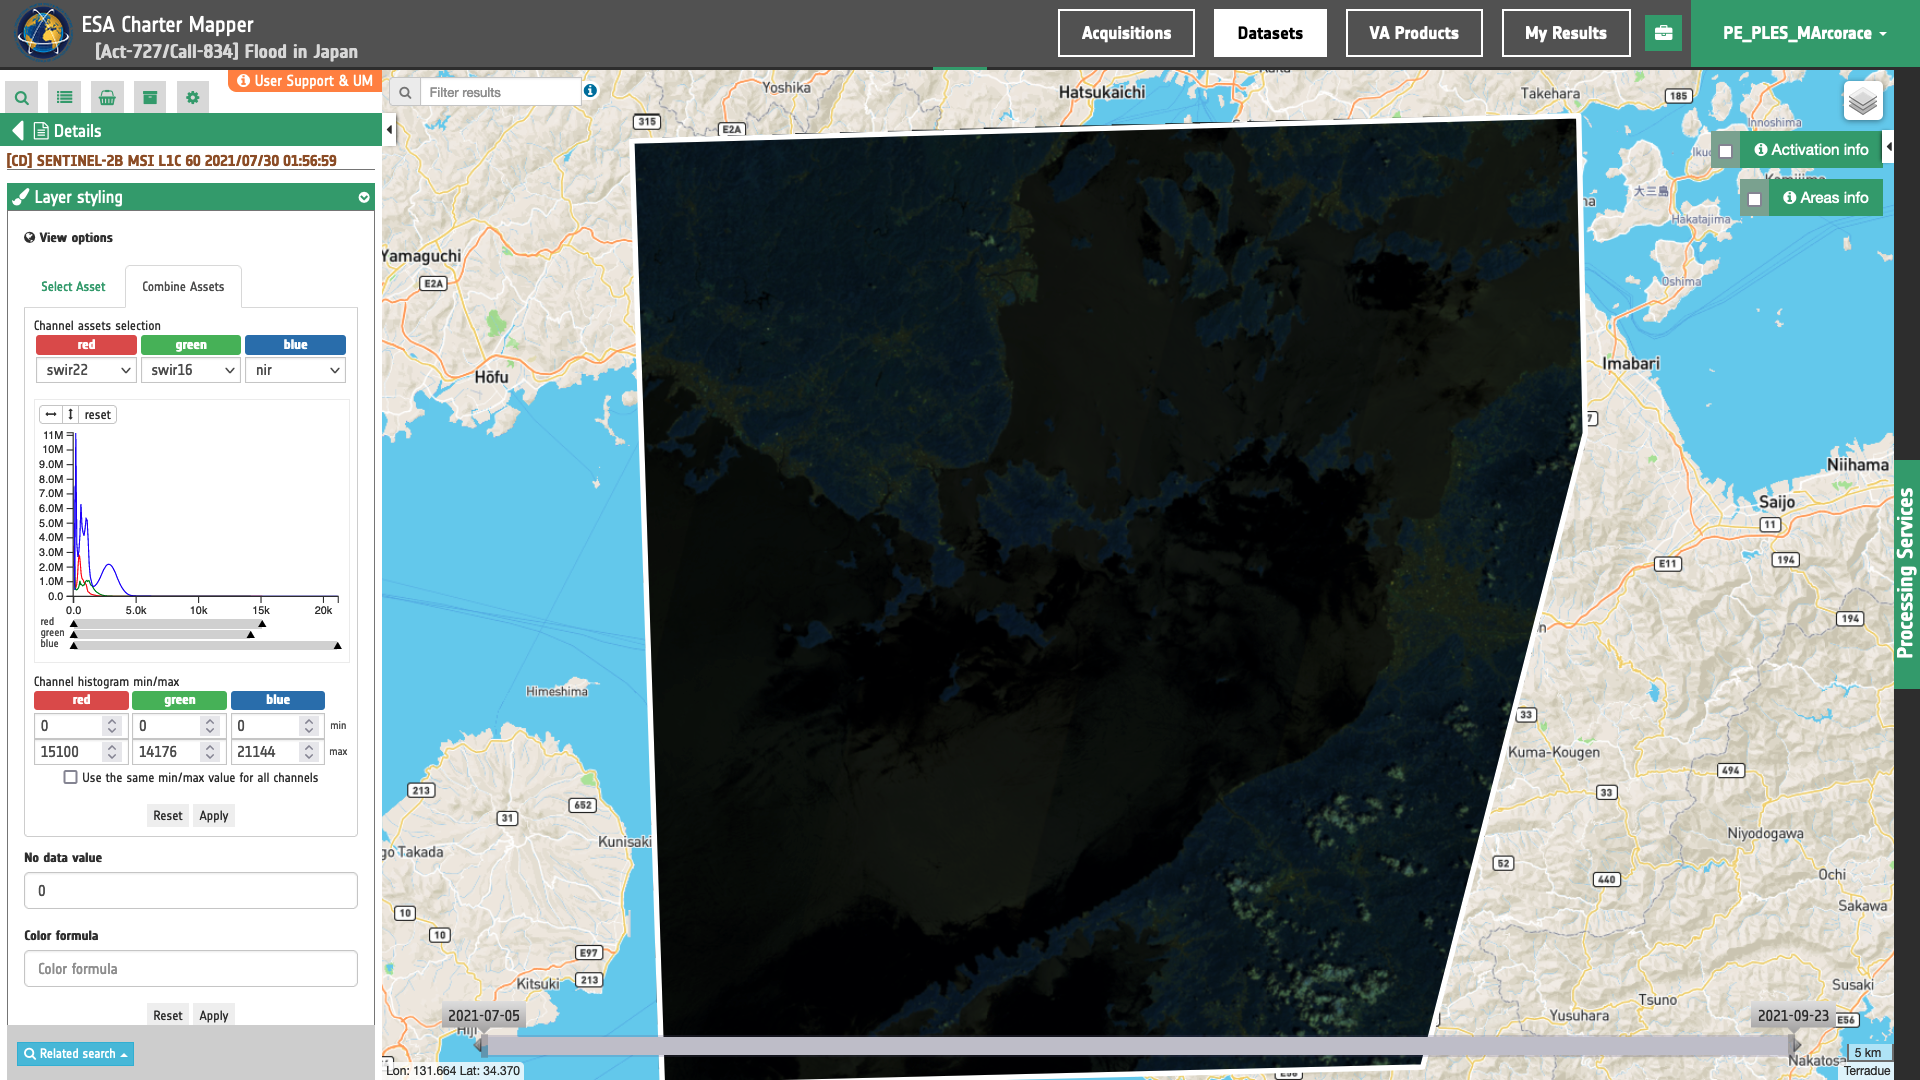
Figure 5 - Visualization of ATP band composite on the fly from TOA reflectance and associated RGB histograms into the ESA Charter Mapper with no image stretching from Sentinel-2 MSI data acquired over Japan (image credit: ESA Copernicus).
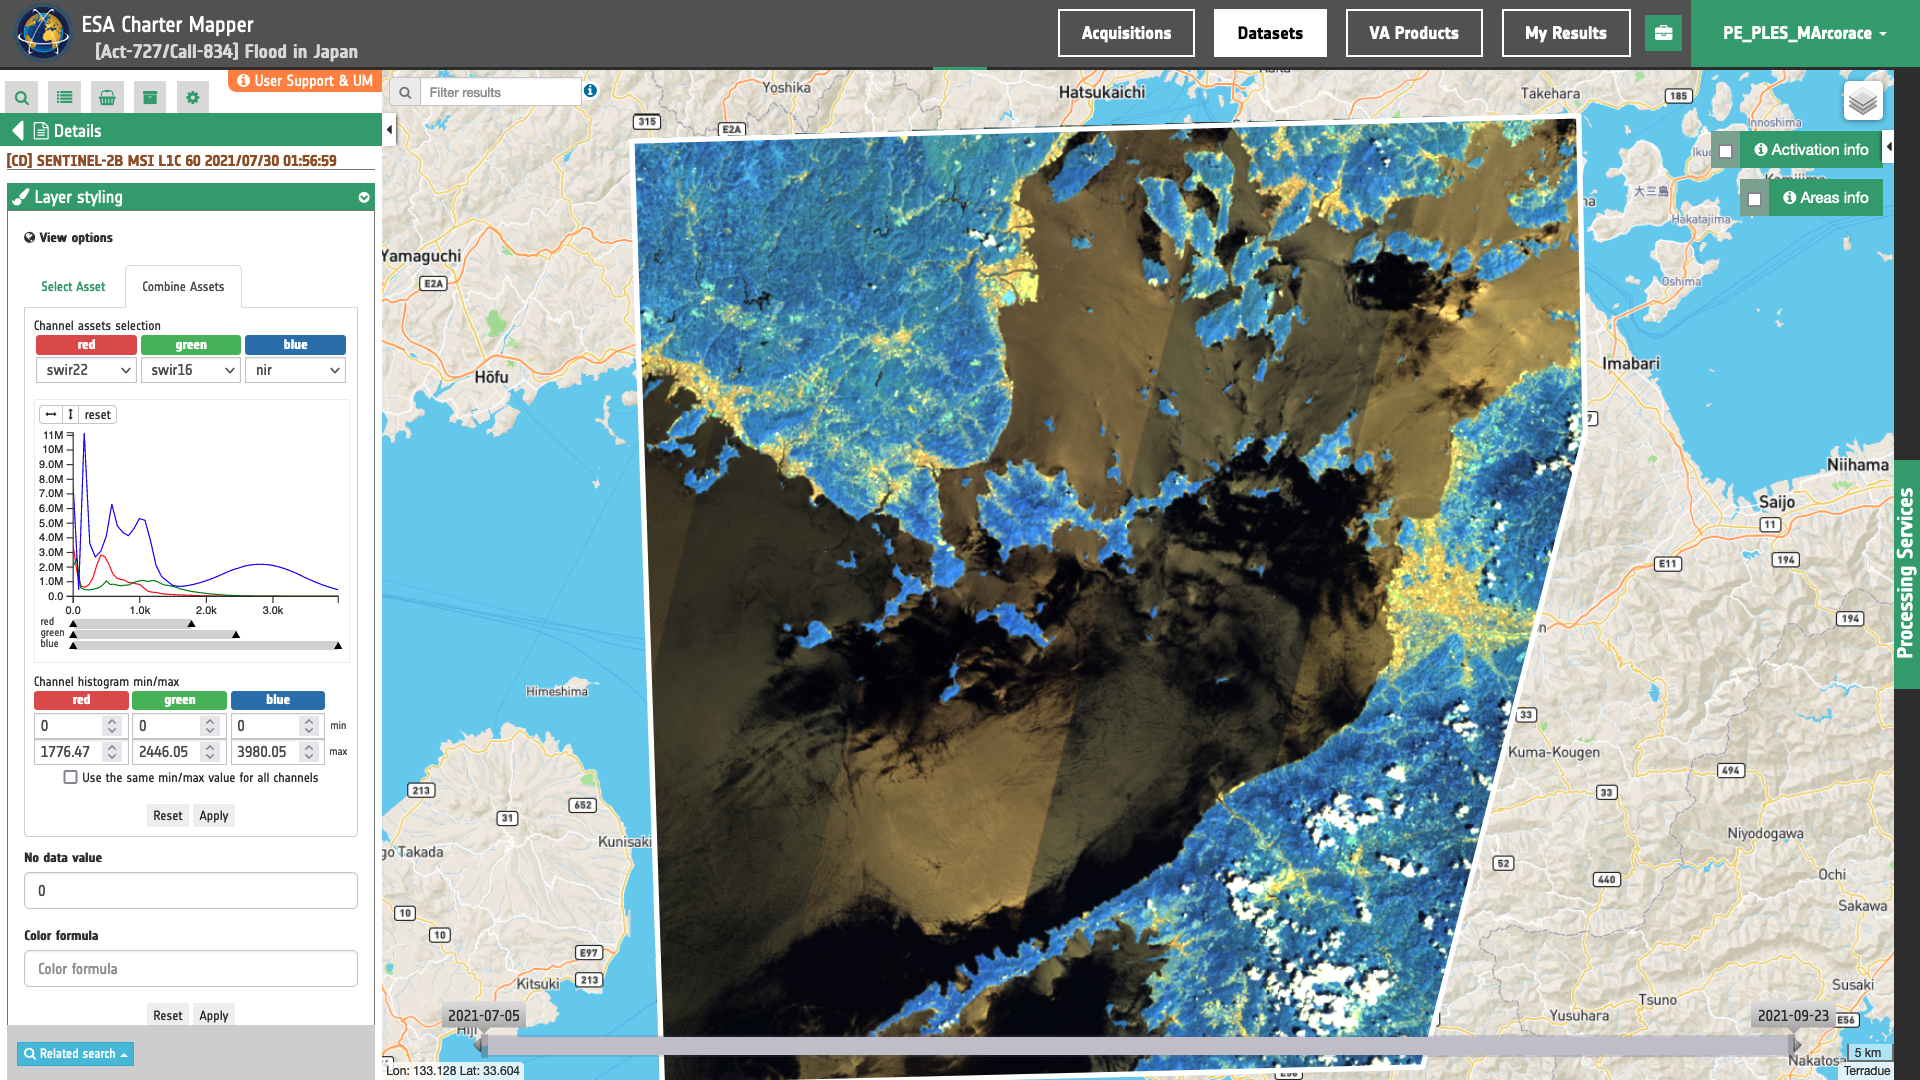
Figure 6 - Visualization of ATP band composite on the fly from TOA reflectance and associated RGB histograms into the ESA Charter Mapper after a 2% cumulative count cut from Sentinel-2 MSI data acquired over Japan (image credit: ESA Copernicus).
In case the chosen single-band assets for green and blue channels are identical, only two red and cyan histograms will appear.
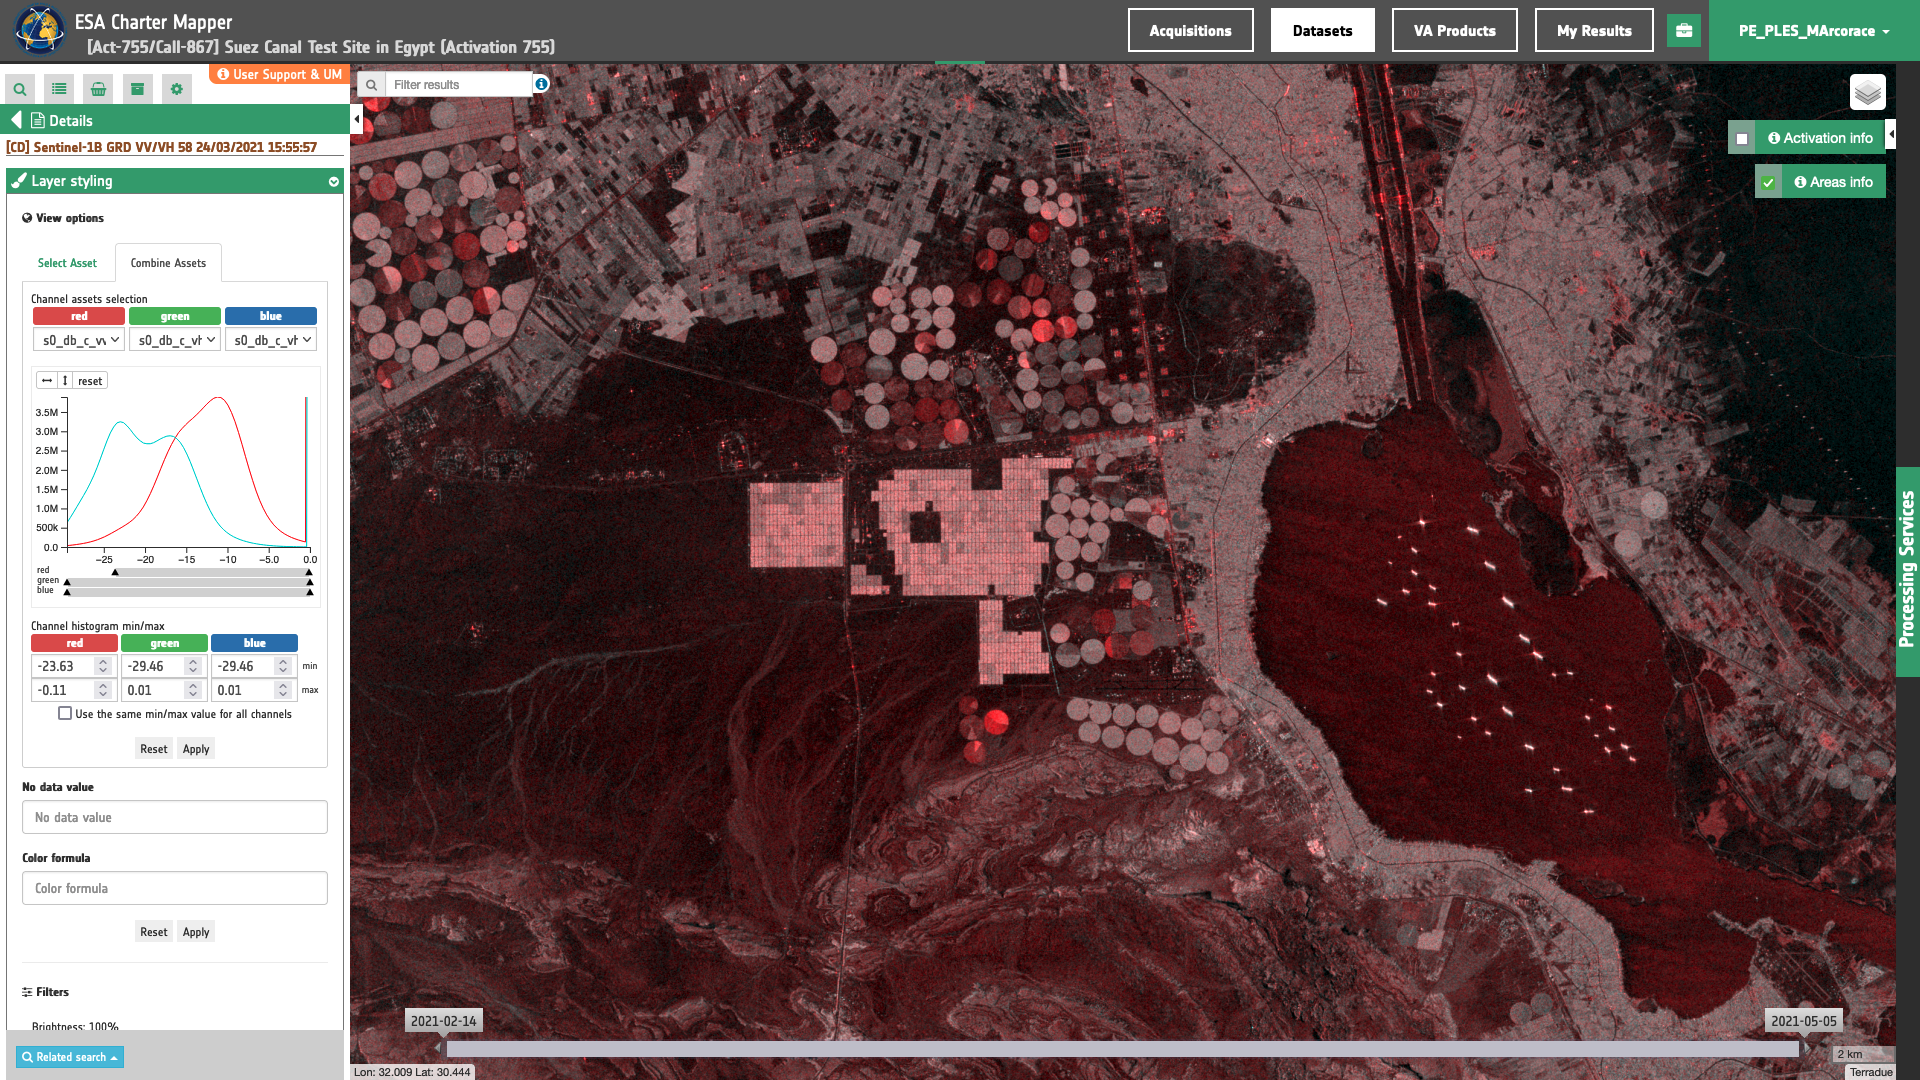
Figure 7 - Visualization of a Red-Cyan band composite on the fly from Sigma Nought in dB VV/VH and associated Red and Cyan histograms into the ESA Charter Mapper after a 2% cumulative count cut from Sentinel-1 dual-pol data in IW mode acquired over the Suez Canal in Egypt (image credit: ESA Copernicus).
Color operations
In the creation of the overview products the employment of a color formula (rio-color for COG in TiTiler) is necessary to apply color-oriented operations based on bias, contrast and saturation. The color formula can be inserted by the user during the creation of intra-sensor RGB on the fly in the TiTiler widget in the Layer Details tab under Layer Styling > Combine Assets > Color Formula. See Figure 8 and 9 for an example of TRC visualization without and with the color formula.
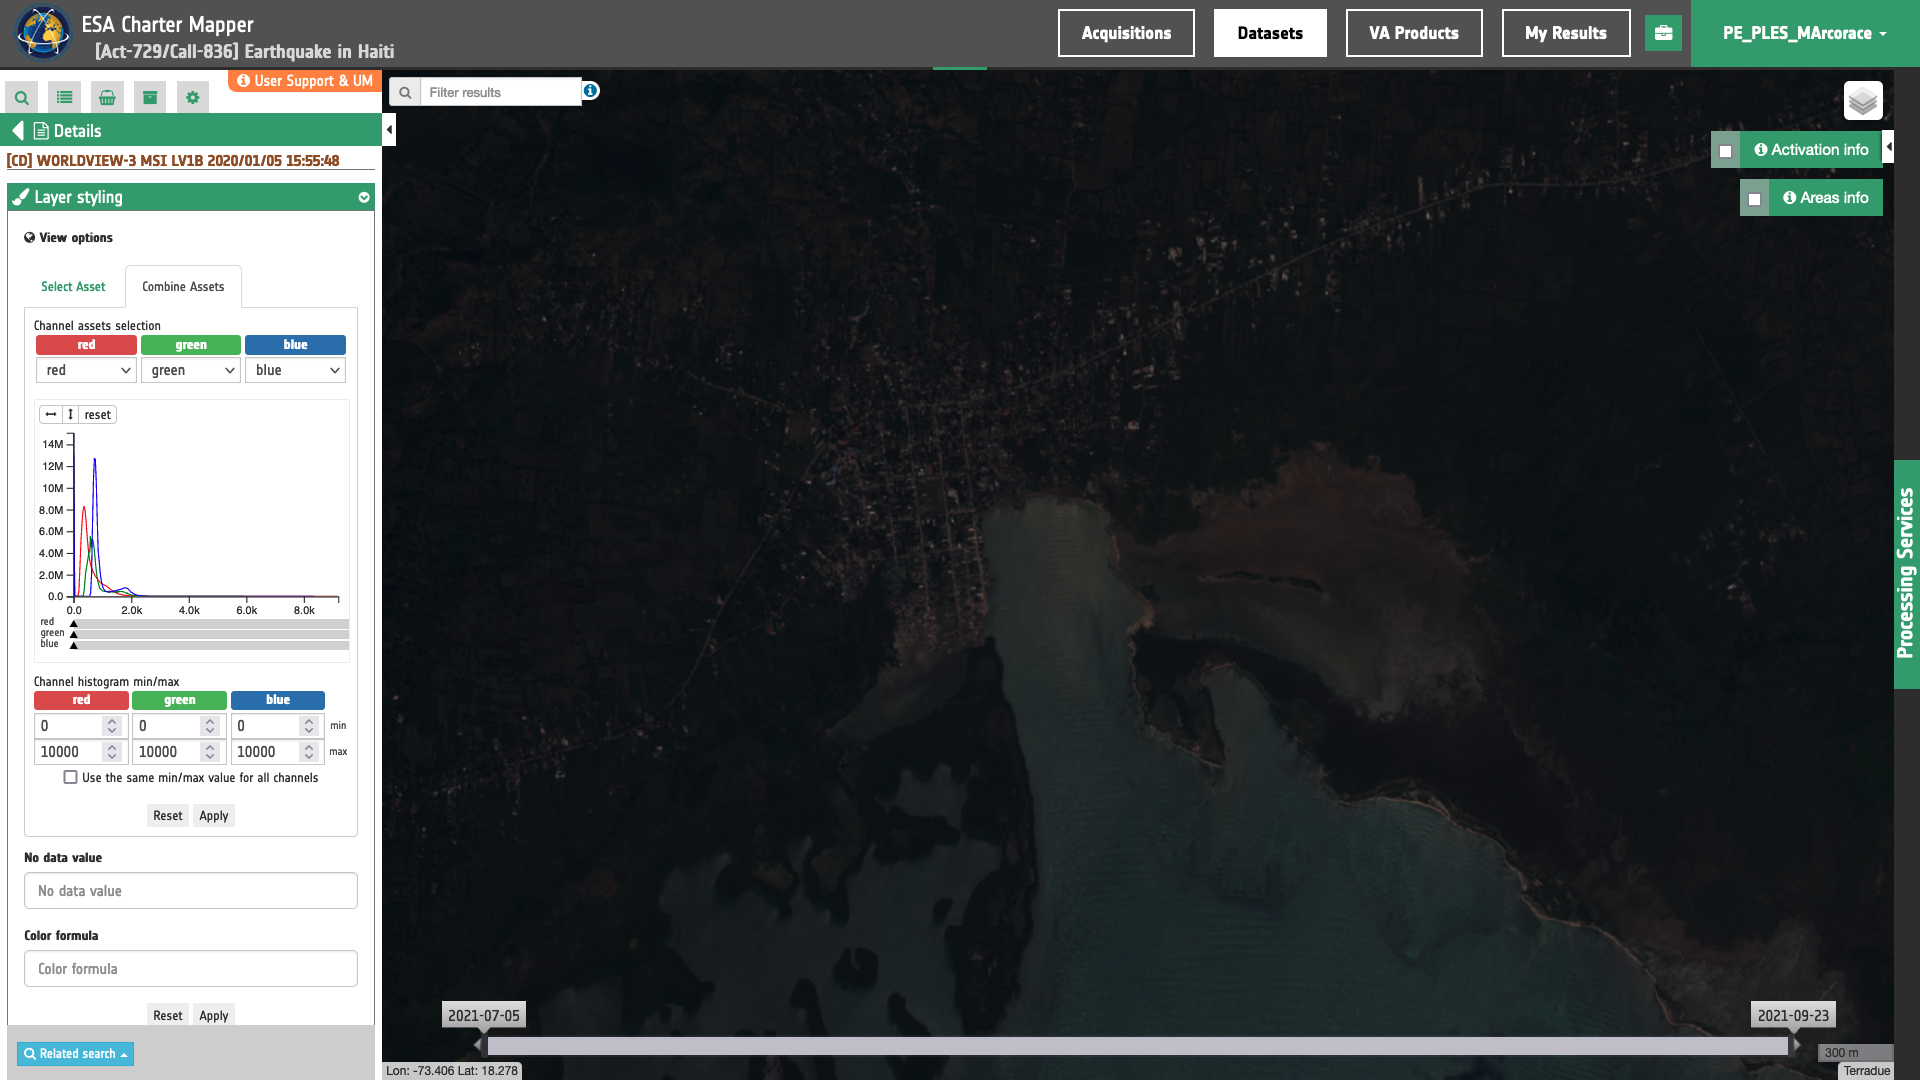
Figure 8 - True Color RGB band composites obtained without the application of color formula from multispectral WorldView-3 data acquired over Haiti (Image credit: DigitalGlobe).
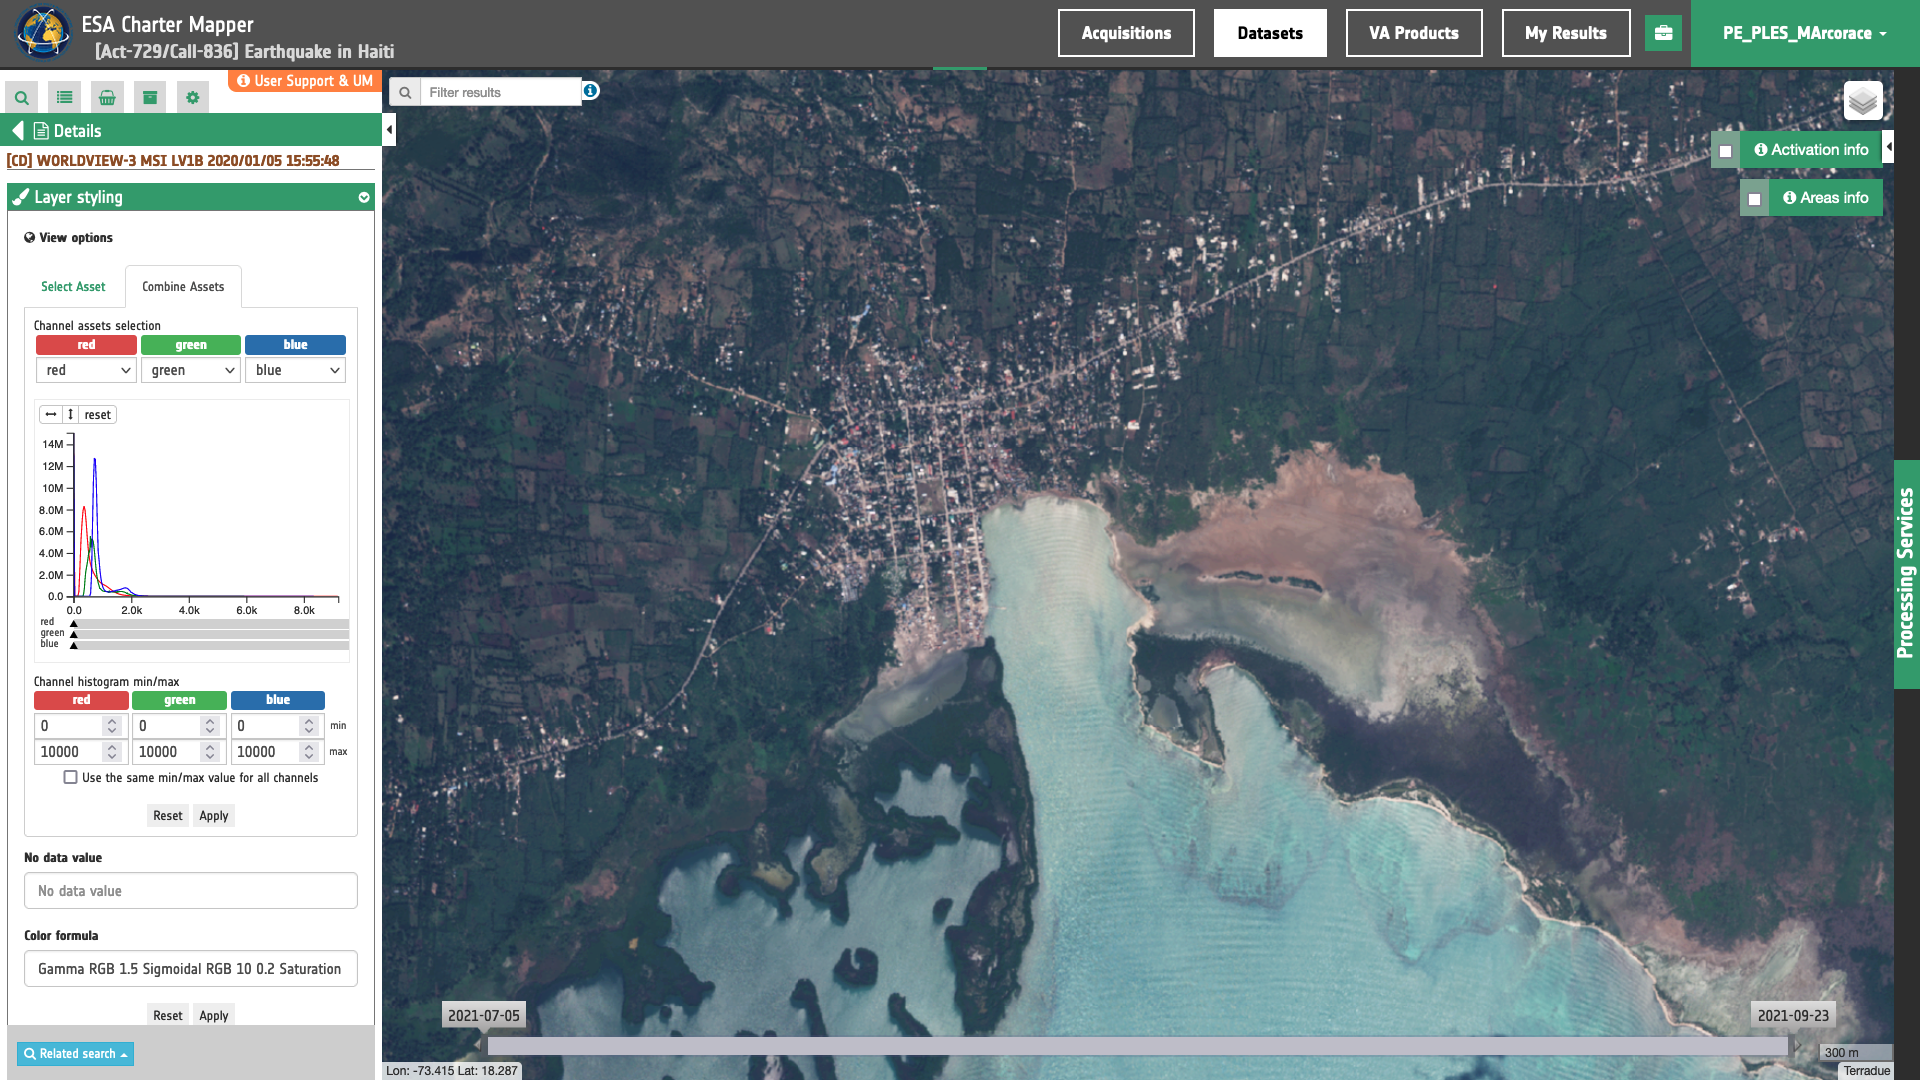
Figure 9 - True Color RGB band composites obtained with the application of a color formula from multispectral WorldView-3 data acquired over Haiti (Image credit: DigitalGlobe).
For more information, the color formula syntax is described in this section about the TiTiler tool of the ESA Charter Mapper Geobrowser and its application in the ESA Charter Mapper is described here.
Other visualization tools
Other visualization tools are the Enhanced Raster Visualization Functions, the Swap of overlapping layers, and the Box zoom.
More information about the ESA Charter Mapper geobrowser tools can be found here.