CVA tutorial
![]()
This service employs Change Vector Analysis (Bovolo et Bruzzone, 2007) to derive a binary change detection map from a set of pre- and post-event calibrated assets derived from the same mission.
 CVA service description and specifications are available in this section.
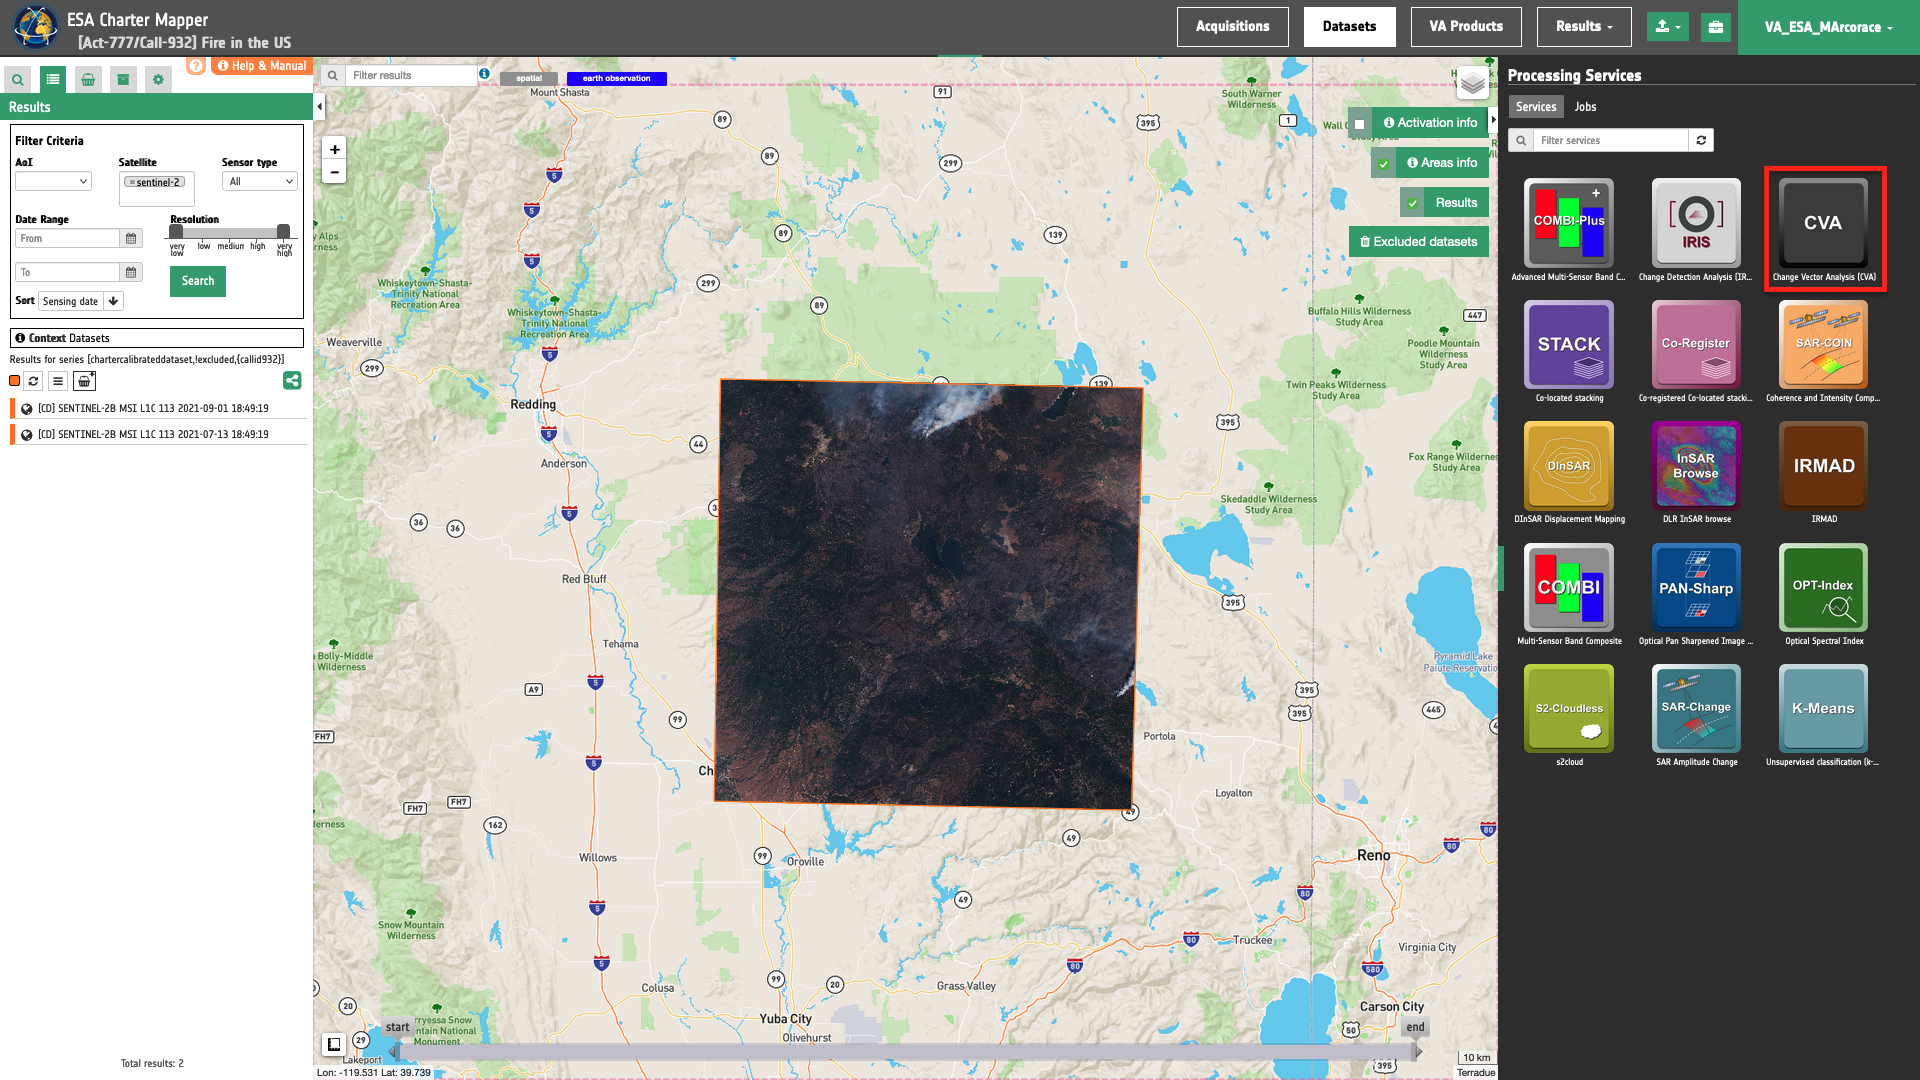
Select the processing service
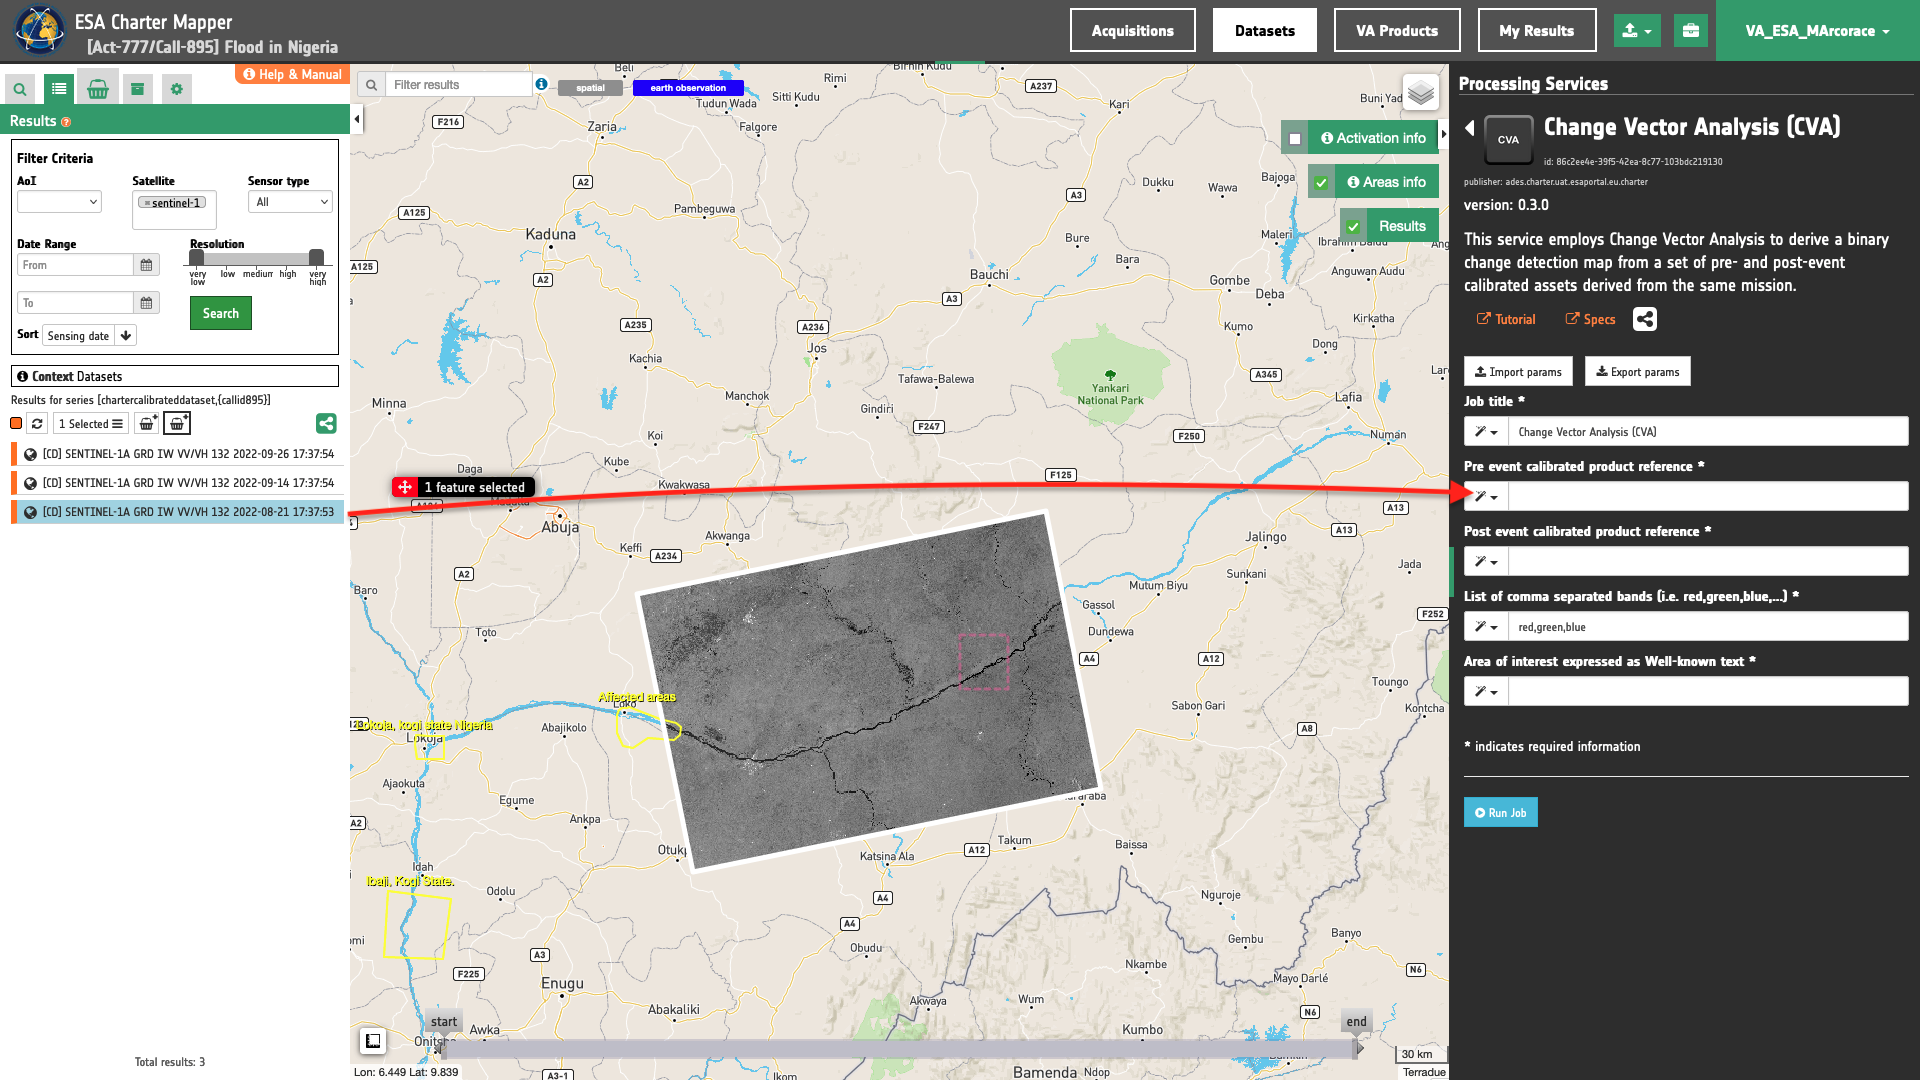
After the opening of the activation workspace, in the right panel of the interface, open the Processing Services tab. Select the processing service Change Vector Analysis (CVA).
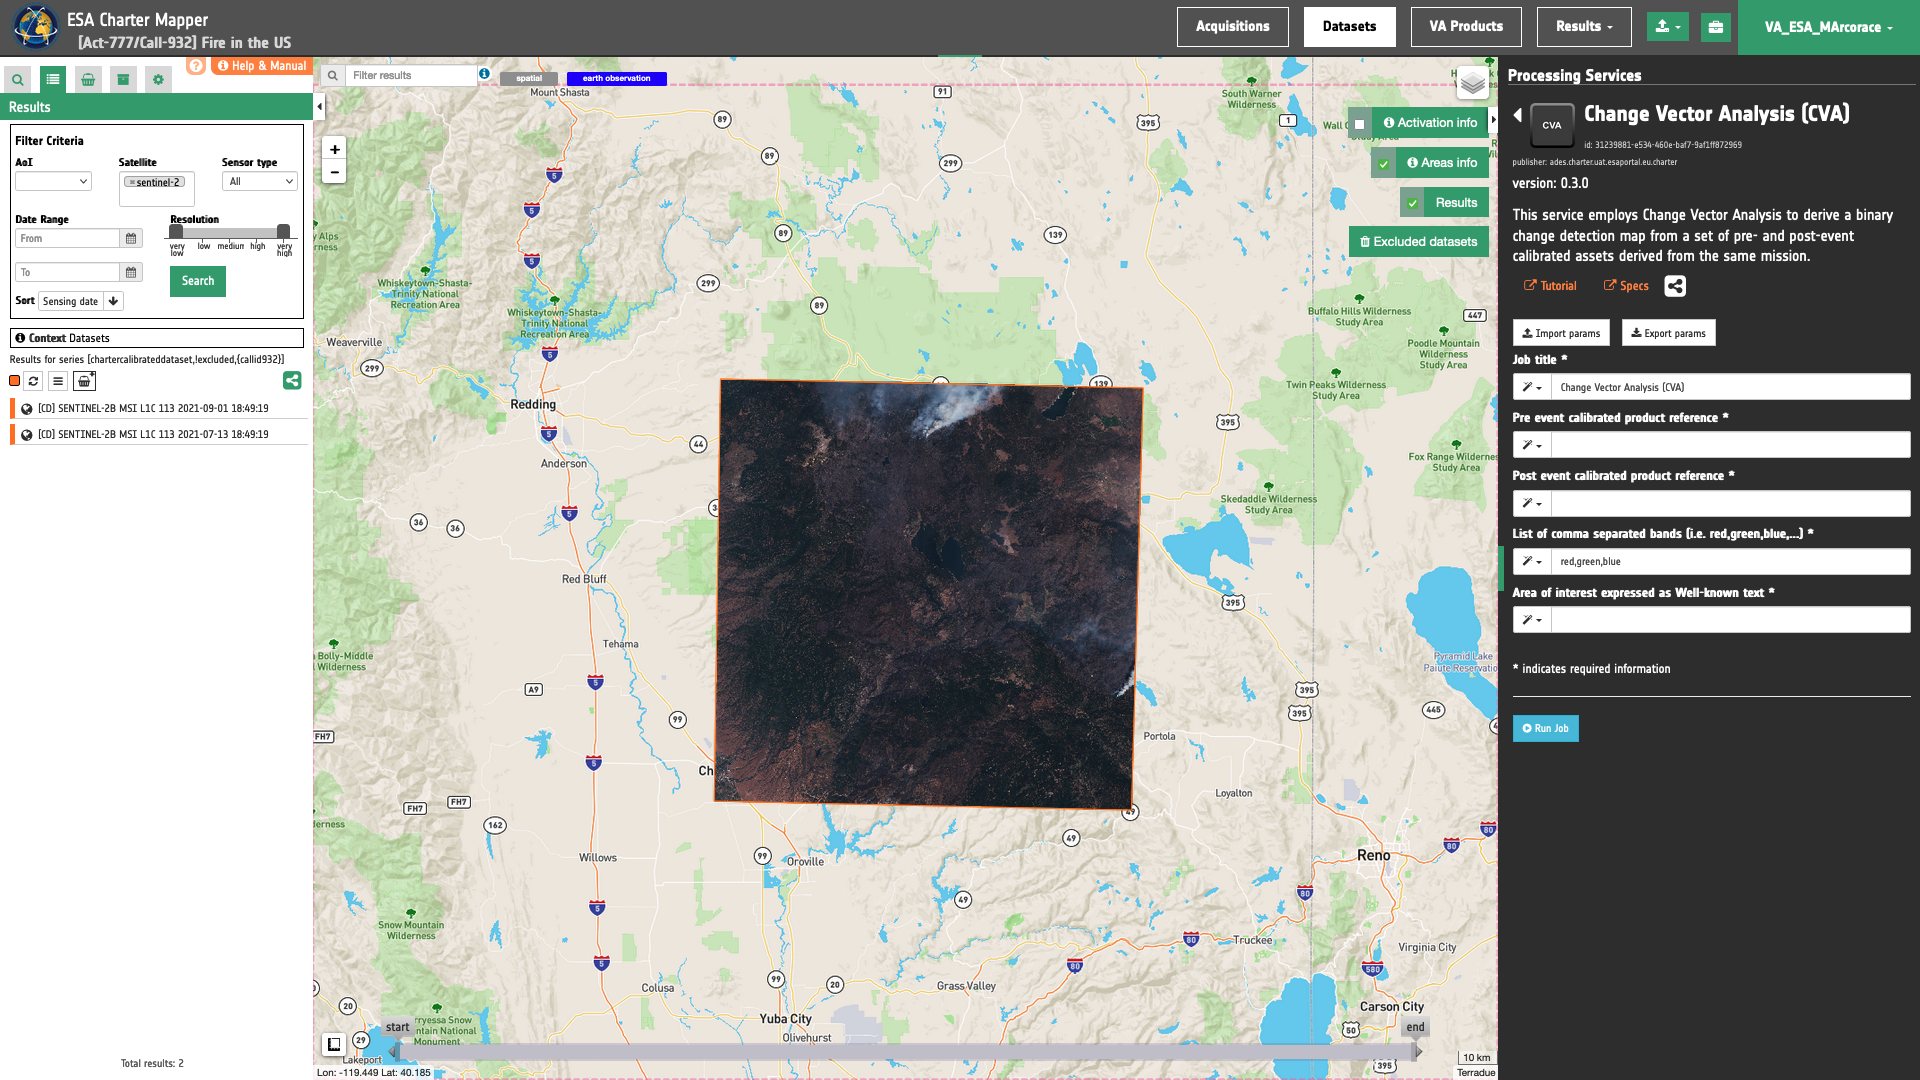
The "Change Vector Analysis (CVA)" panel is displayed with parameters values to be filled-in.
Use case 1: evaluate changes in multispectral assets due to wildfire from pre- and post-event optical calibrated datasets
Abstract
This first use case explains how to derive a CVA change mask over a burnt area from a stack of co-located pre- and post-event multispectral reflectance assets.
Find the data using multiple filter criterias
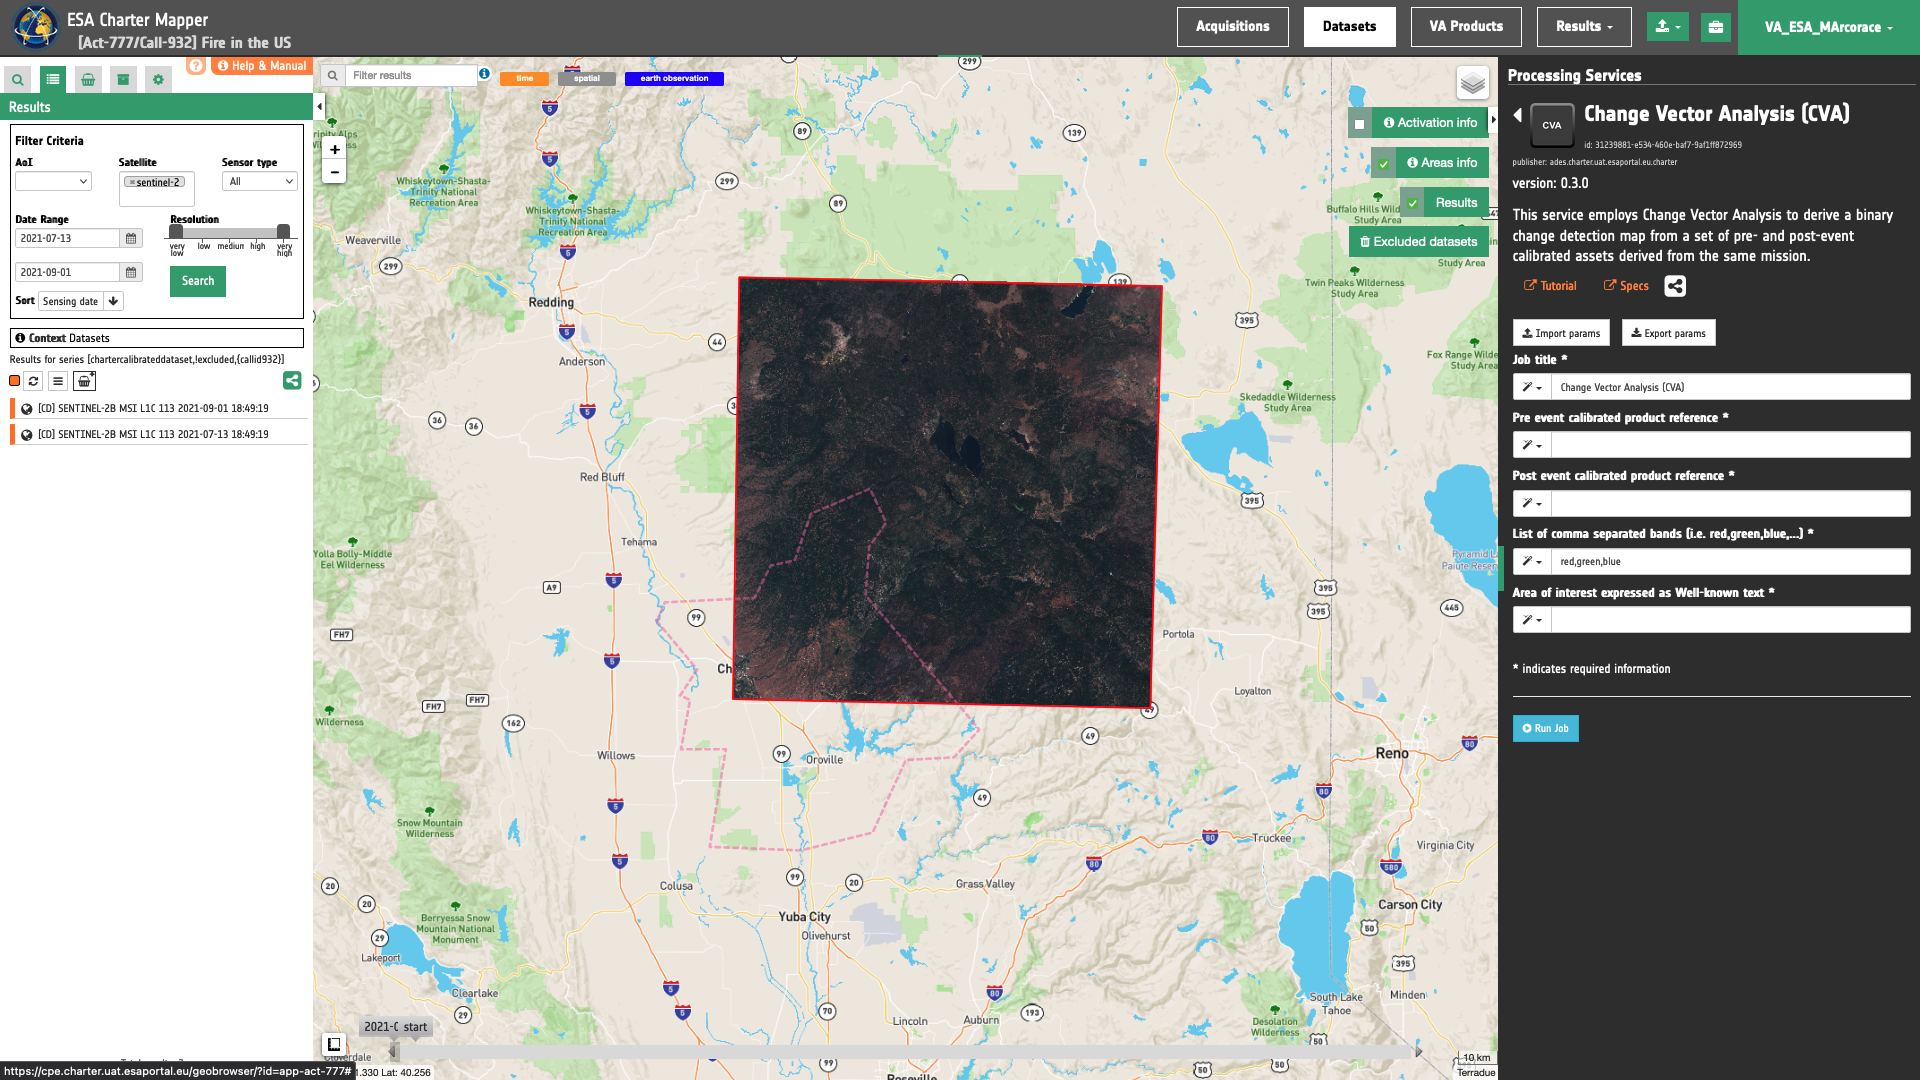
Select the area for which you want to do an analysis, e.g over California, US.
From the Navigation and Search toolbar (located in the upper left side of the map), click on Spatial Filter and draw a square AOI over Lassen and Butte counties in California, US. This spatial filter allows you to select only the EO data acquired over this area.
Tip
Use the Geocoding control to find some places on the map (e.g. Butte County, California, US). Inserted text could be a country, city name, street, mountain, river, etc.
From the top of the left panel, use Filter Criterias to search for “Optical” and "Sentinel-2" data collections from the list.
After the query the list will be updates as the one shown in the next image.
Now it is possible to choose a pair of pre- and post-event reflectance images from Optical Calibrated Datasets to be used for the change vector analysis. As an example you can choose the following pair:
-
Pre-event [CD]: SENTINEL-2B MSI L1C 113 2021/07/13 18:49:19
-
Post-event [CD]: SENTINEL-2B MSI L1C 113 2021/09/01 18:49:19
Fill the paramters
After the definition of spatial and time filters, you can employ CVA, by using a suitable pair of Calibrated Datasets from Sentinel-2 data.
To do so you can fill the parameters as described in the following sections.
Job name
- Insert as job name:
CVA RGBNIR Dixie Fire 2021 US
Input pair of calibrated datasets
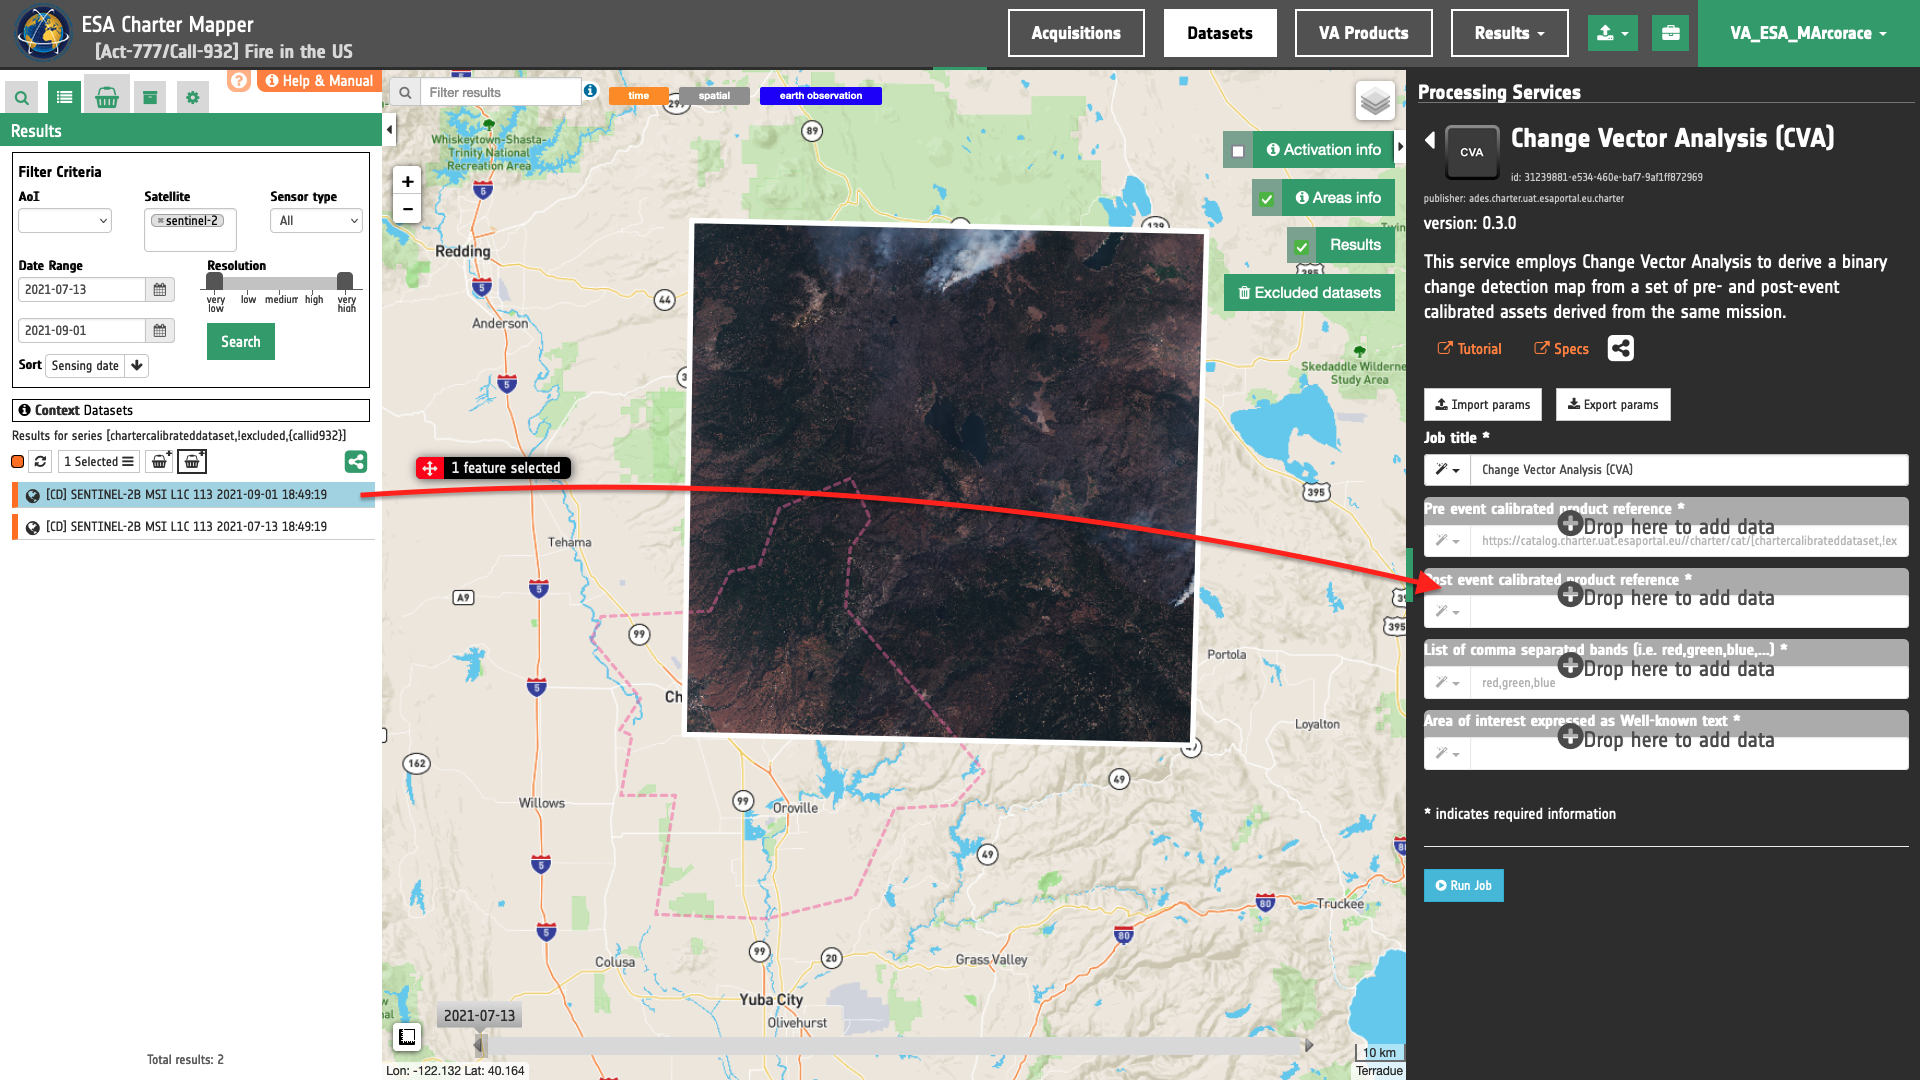
Drag and Drop the selected items:
-
Pre-event Calibrated Dataset
-
Post-event Calibrated Dataset
in the Pre-event calibrated product reference and the Post-event calibrated product reference fields respectively.
List of comma-separated assets
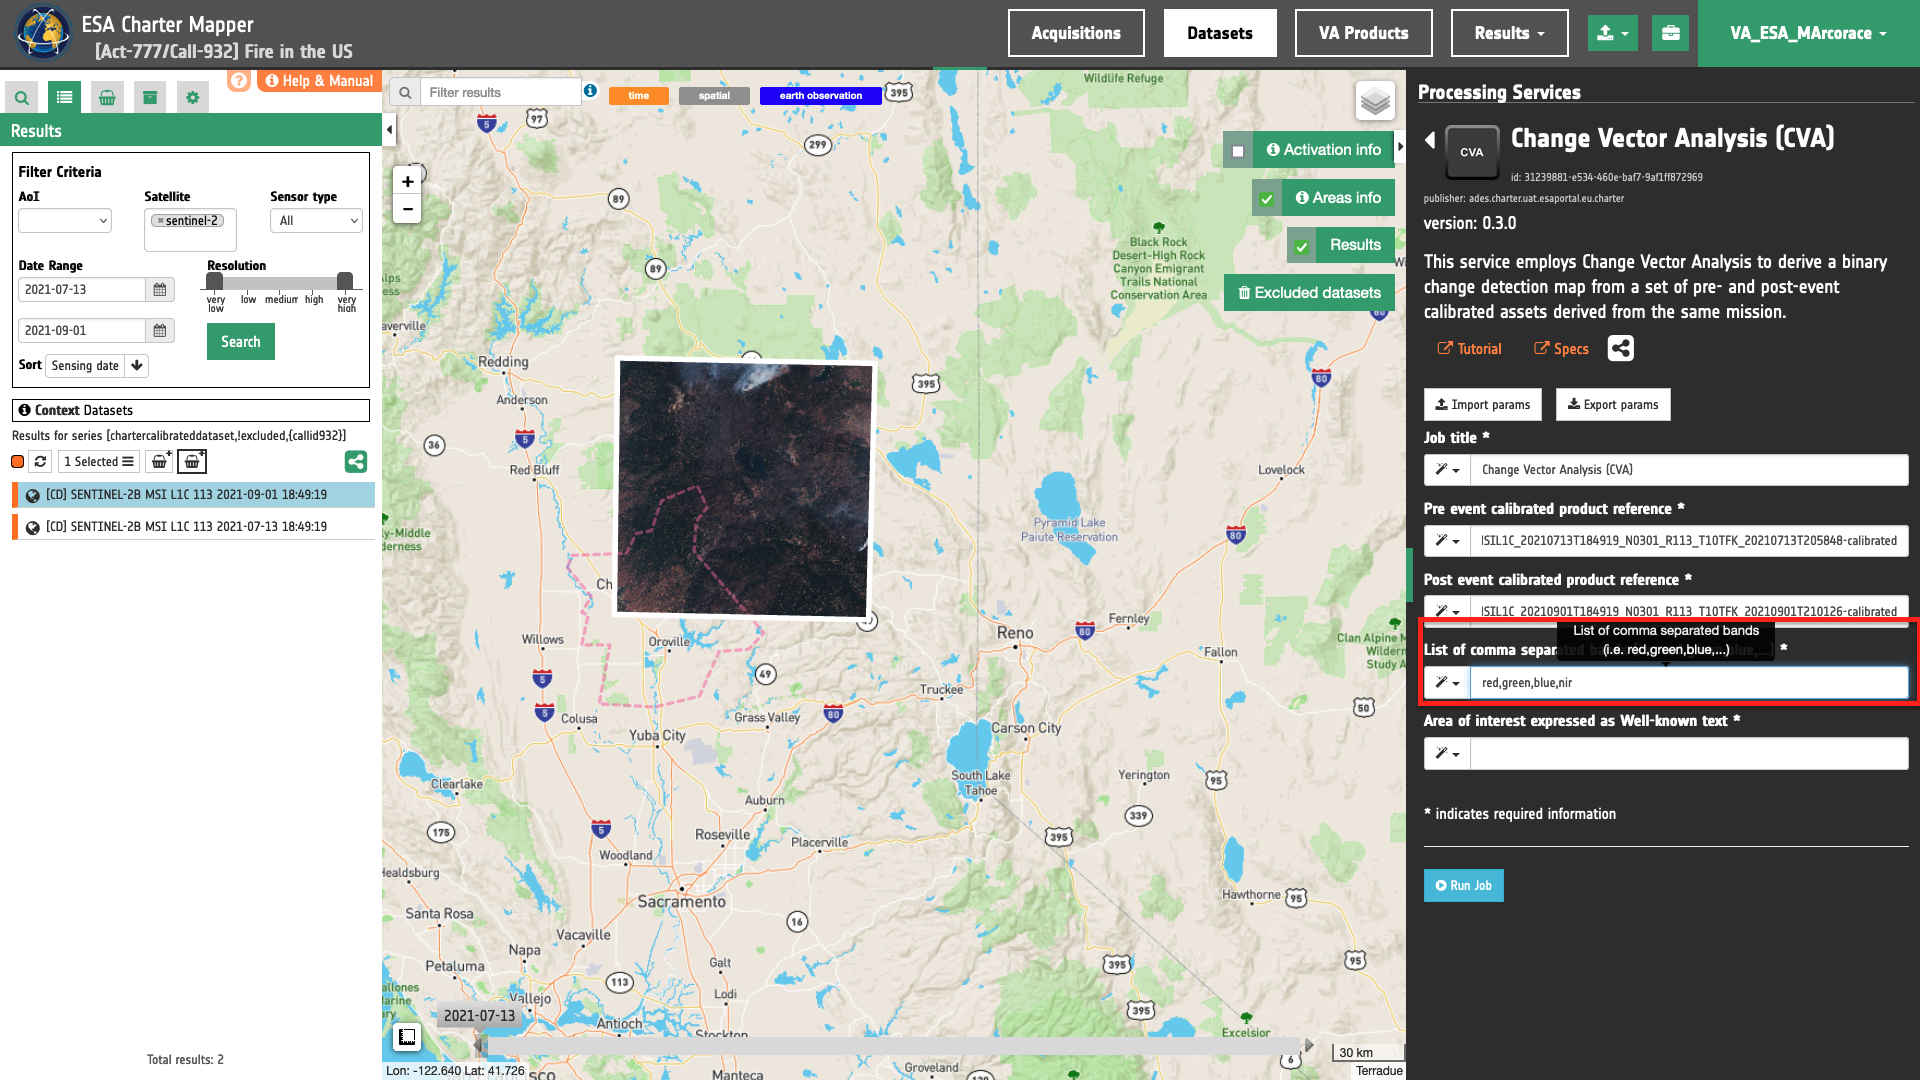
Insert the list of single-band assets to be extracted from the given pair of calibrated datasets in the "List(s) of comma-separated band(s)” field. In this parmaeter the user must manually insert a list assets given as of comma-separated list og common band names.
To employ CVA using red, green, blue and nir single-band assets from two calibrated datasets the following list must be inserted:
red,green,blue,nir
and the service automatically extract from both pre- and post-event input calibrated datasets the pair of single-band assets for each specified CBN.
Warning
This list must include more than one CBN. Therefore, CVA requires at least 2 assets from pre- and post-event datasets.
Warning
Use comma-separated CBN and avoid spaces between assets.
Note
All CBNs available in the ESA Charter Mapper can be found here.
Warning
Both the input calibrated product references must include the single-band assets specified in the list.
Area of interest expressed as Well-known text
In the last parameter the user must define the “Area of interest as Well Known Text”. The AOI can be defined by using the drawn polygon defined with the area filter.
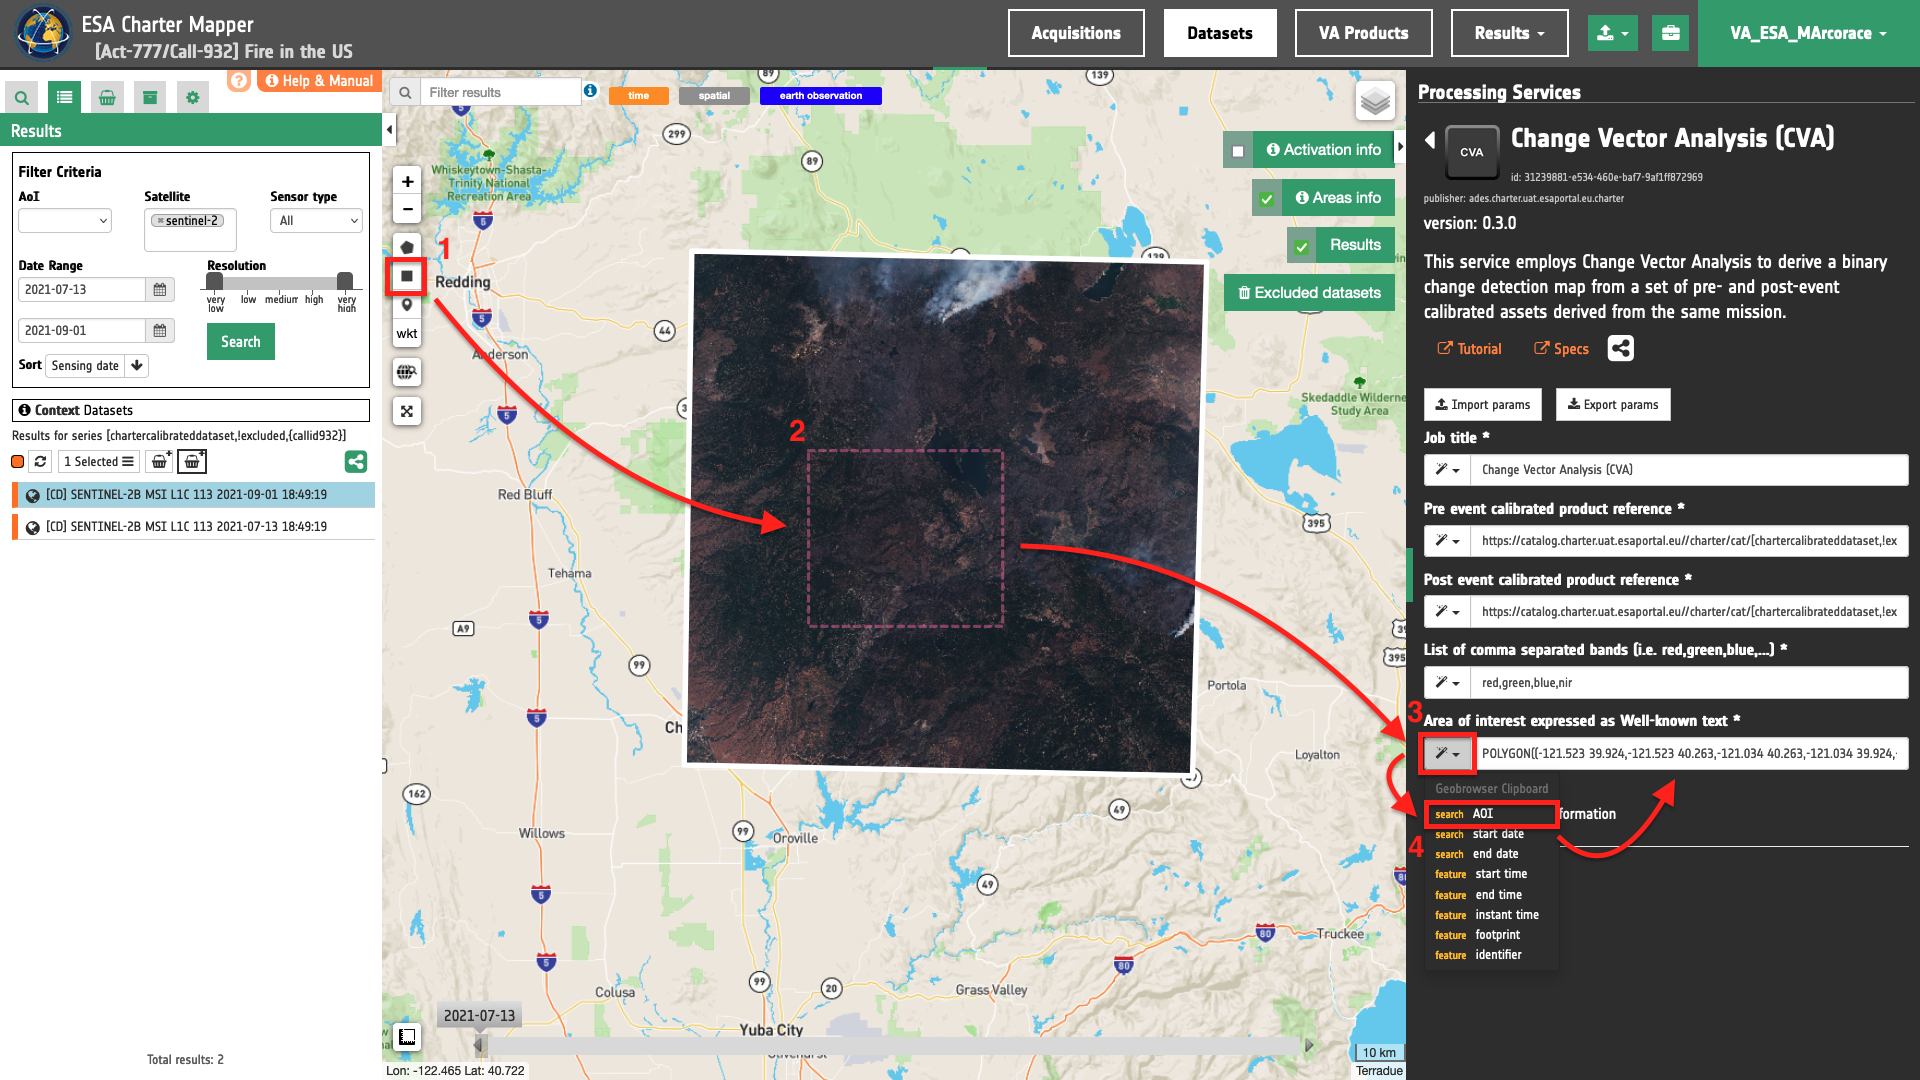
Tip
In the definition of “Area of interest as Well Known Text” it is possible to apply as AOI the drawn polygon defined with the area filter. To do so, click on the button in the left side of the "Area of interest expressed as Well-known text" box and select the option AOI from the list. The platform will automatically fill the parameter value with the rectangular bounding box taken the from current search area in WKT format.
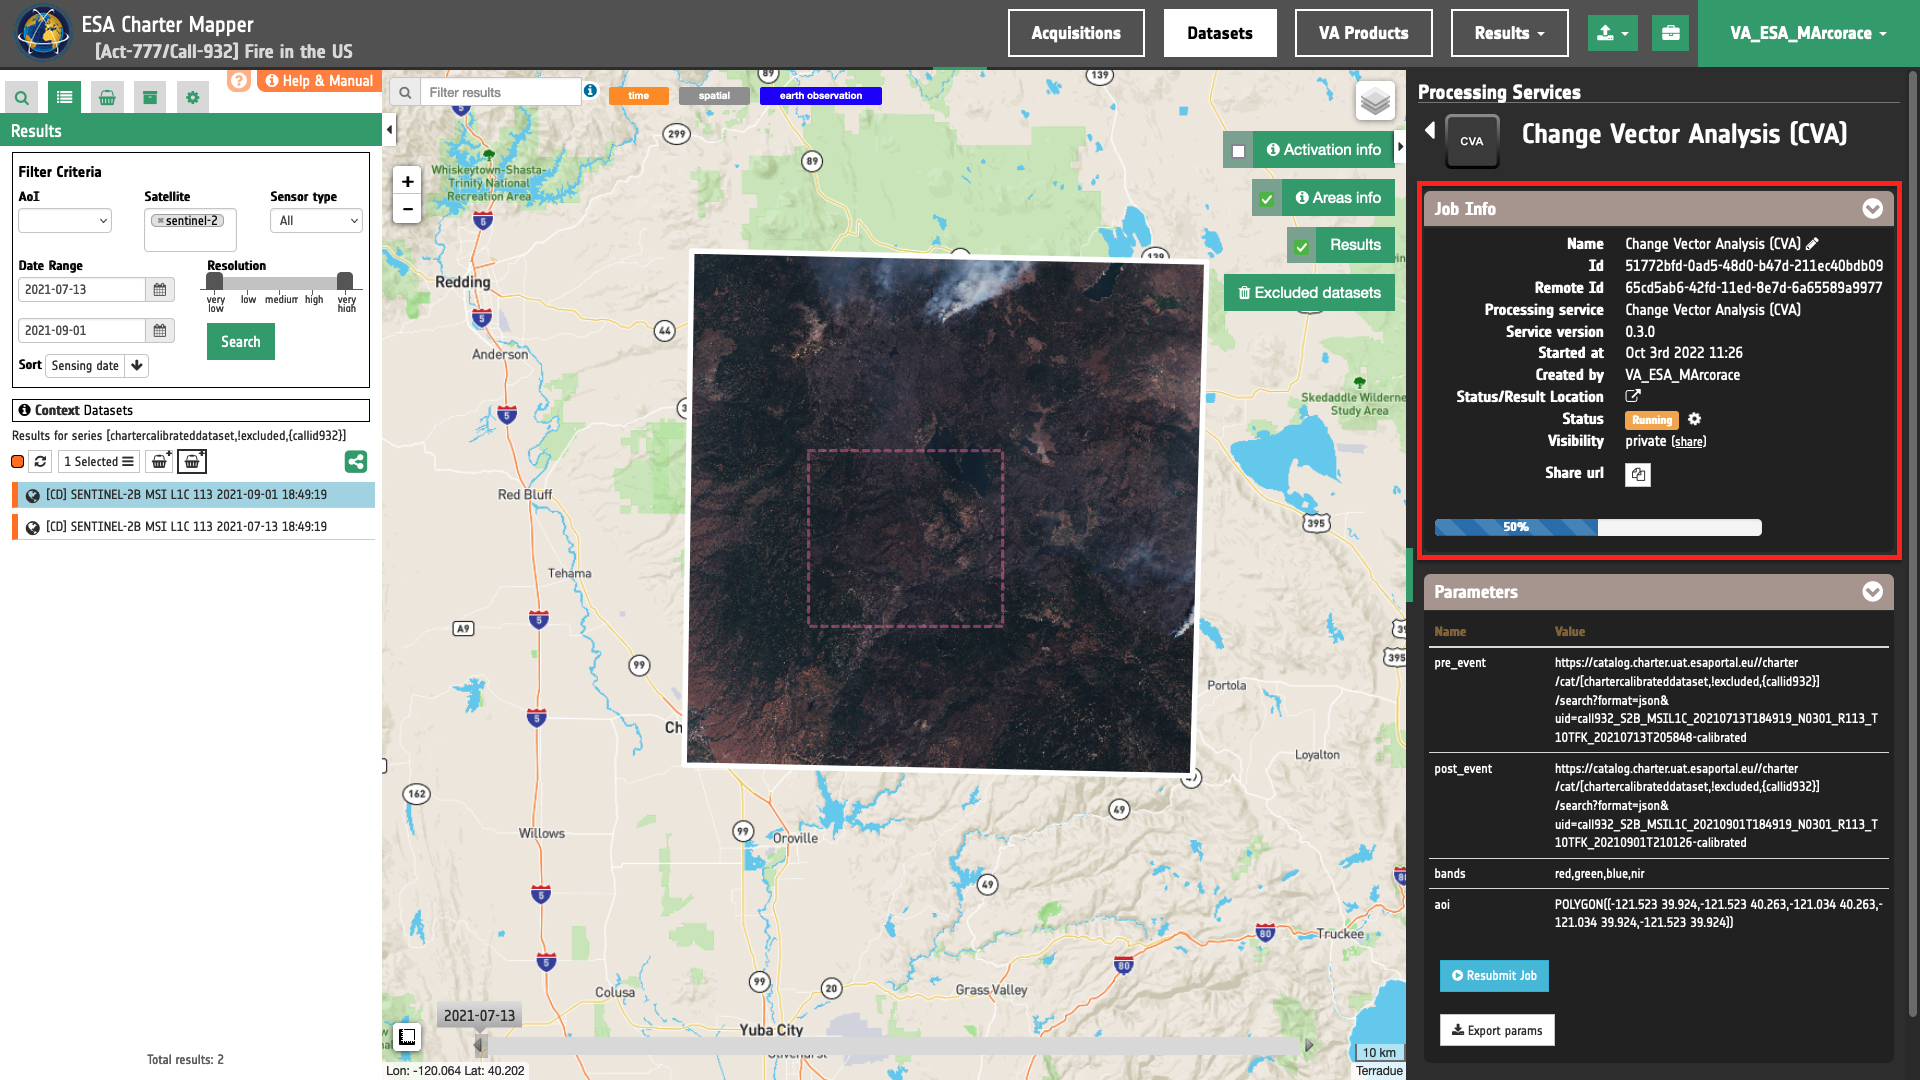
Run the job
Click on the button Run Job and see the Running Job. You can monitor job progress through the progress bar.
Results: download and visualization
Once the job is completed, click on the button Show results at the bottom of the processing service panel.
Tip
You can also save the parameters employed in this job by clicking on the Export params button in the right panel. This allows you to copy all your entries to the clipboard. This is meant to be used for a quick re-submission of a similar job after a fine tuning of the parameters (e.g. to add a color formula later).
Below is reported the syntax which includes all the parameters employed in this example.
{
   "pre_event": "https://catalog.disasterscharter.org//charter/cat/[chartercalibrateddataset,!excluded,{callid932}]/search?format=json&uid=call932_S2B_MSIL1C_20210713T184919_N0301_R113_T10TFK_20210713T205848-calibrated",
   "post_event": "https://catalog.disasterscharter.org//charter/cat/[chartercalibrateddataset,!excluded,{callid932}]/search?format=json&uid=call932_S2B_MSIL1C_20210901T184919_N0301_R113_T10TFK_20210901T210126-calibrated",
   "bands": "red,green,blue,nir",
   "aoi": "POLYGON((-121.523 39.924,-121.523 40.263,-121.034 40.263,-121.034 39.924,-121.523 39.924))"
}
Visualization
See the result on the map. The preview appears within the area defined in the spatial filter.
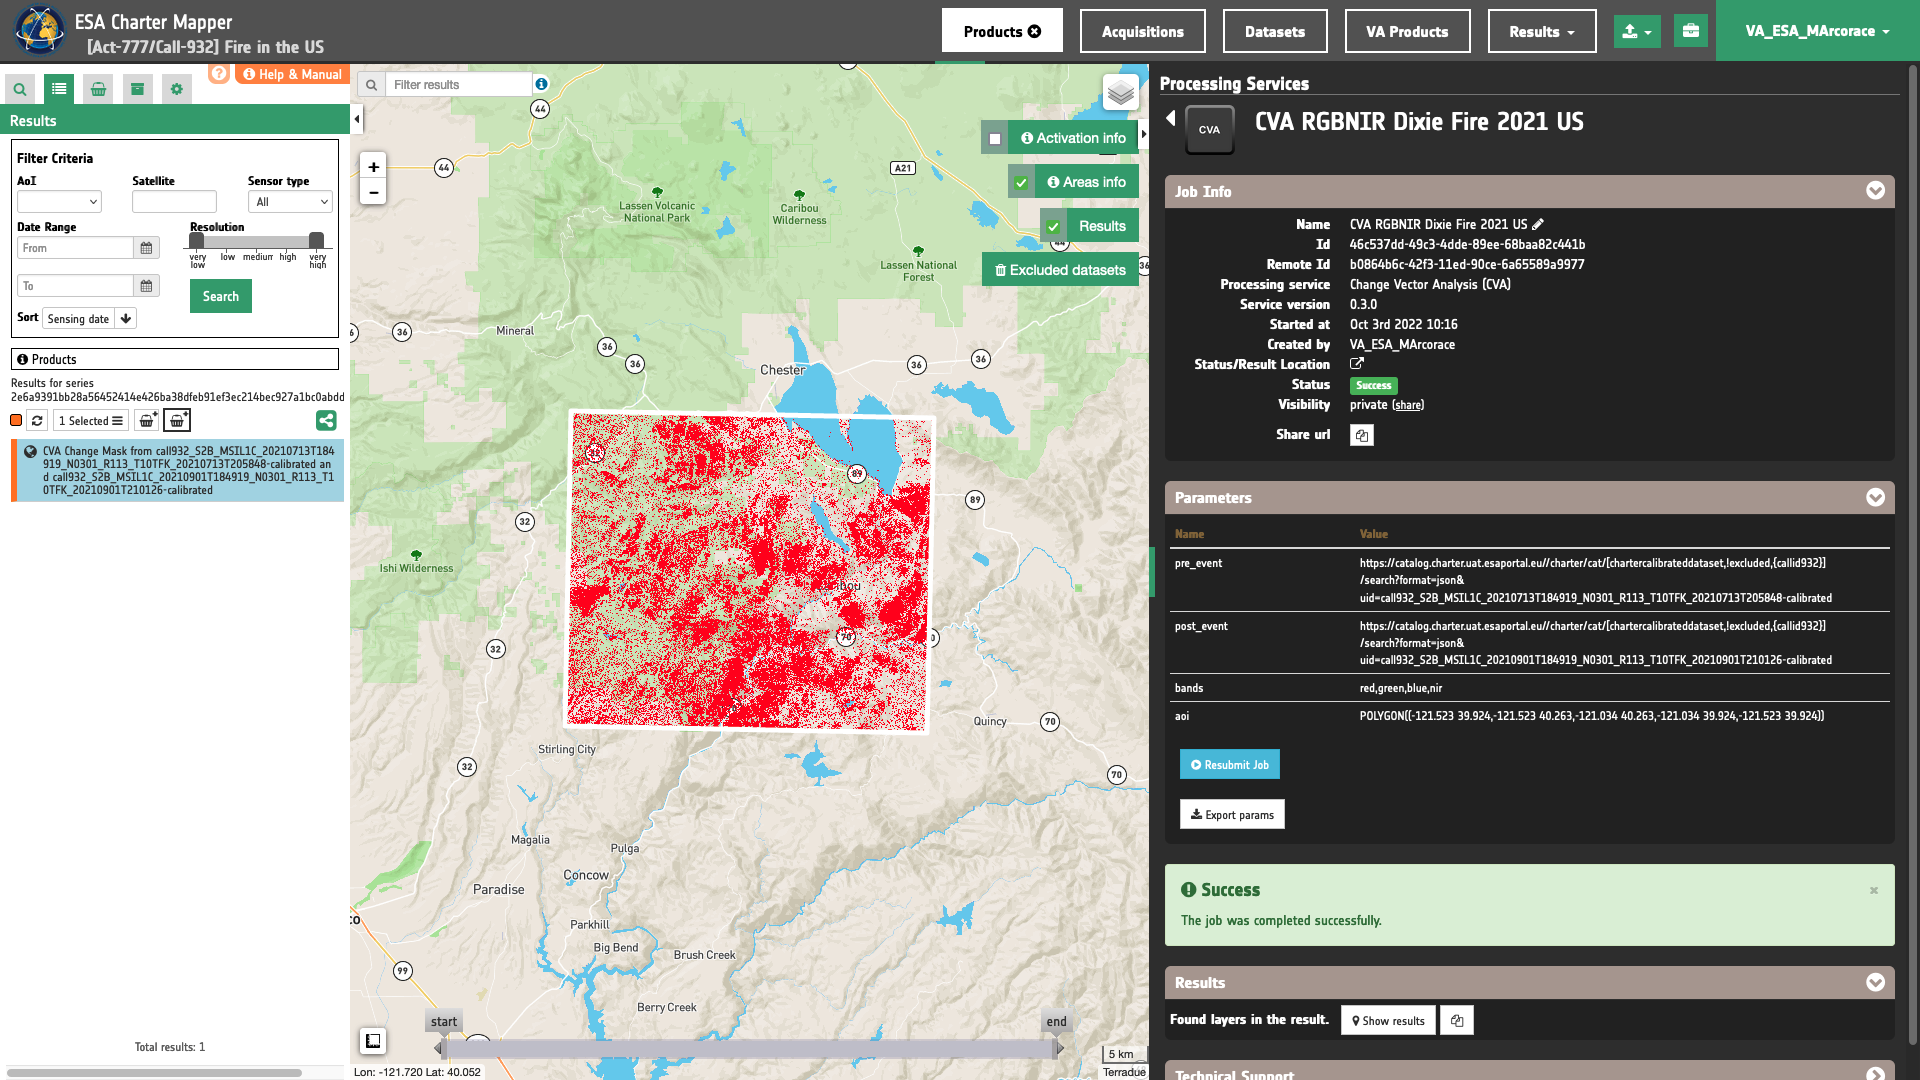
To get more information about the product just click on the preview in the map, a bubble showing the name of the layer “CVA Change Mask from S2B_MSIL1C_20210713T184919_N0301_R113_T10TFK_20210713T205848-calibrated and S2B_MSIL1C_20210901T184919_N0301_R113_T10TFK_20210901T210126-calibrated” will appear and then click on the Show details button.
Tip
To quickly access Product Details double click on the layer from the Results list.
In the left panel of the interface, the details of Job Result will appear with Product metadata. Furthermore by clicking on Layer styling you can also access to the View options. Under Select Asset it is possible to select each asset and visualize it on the map.
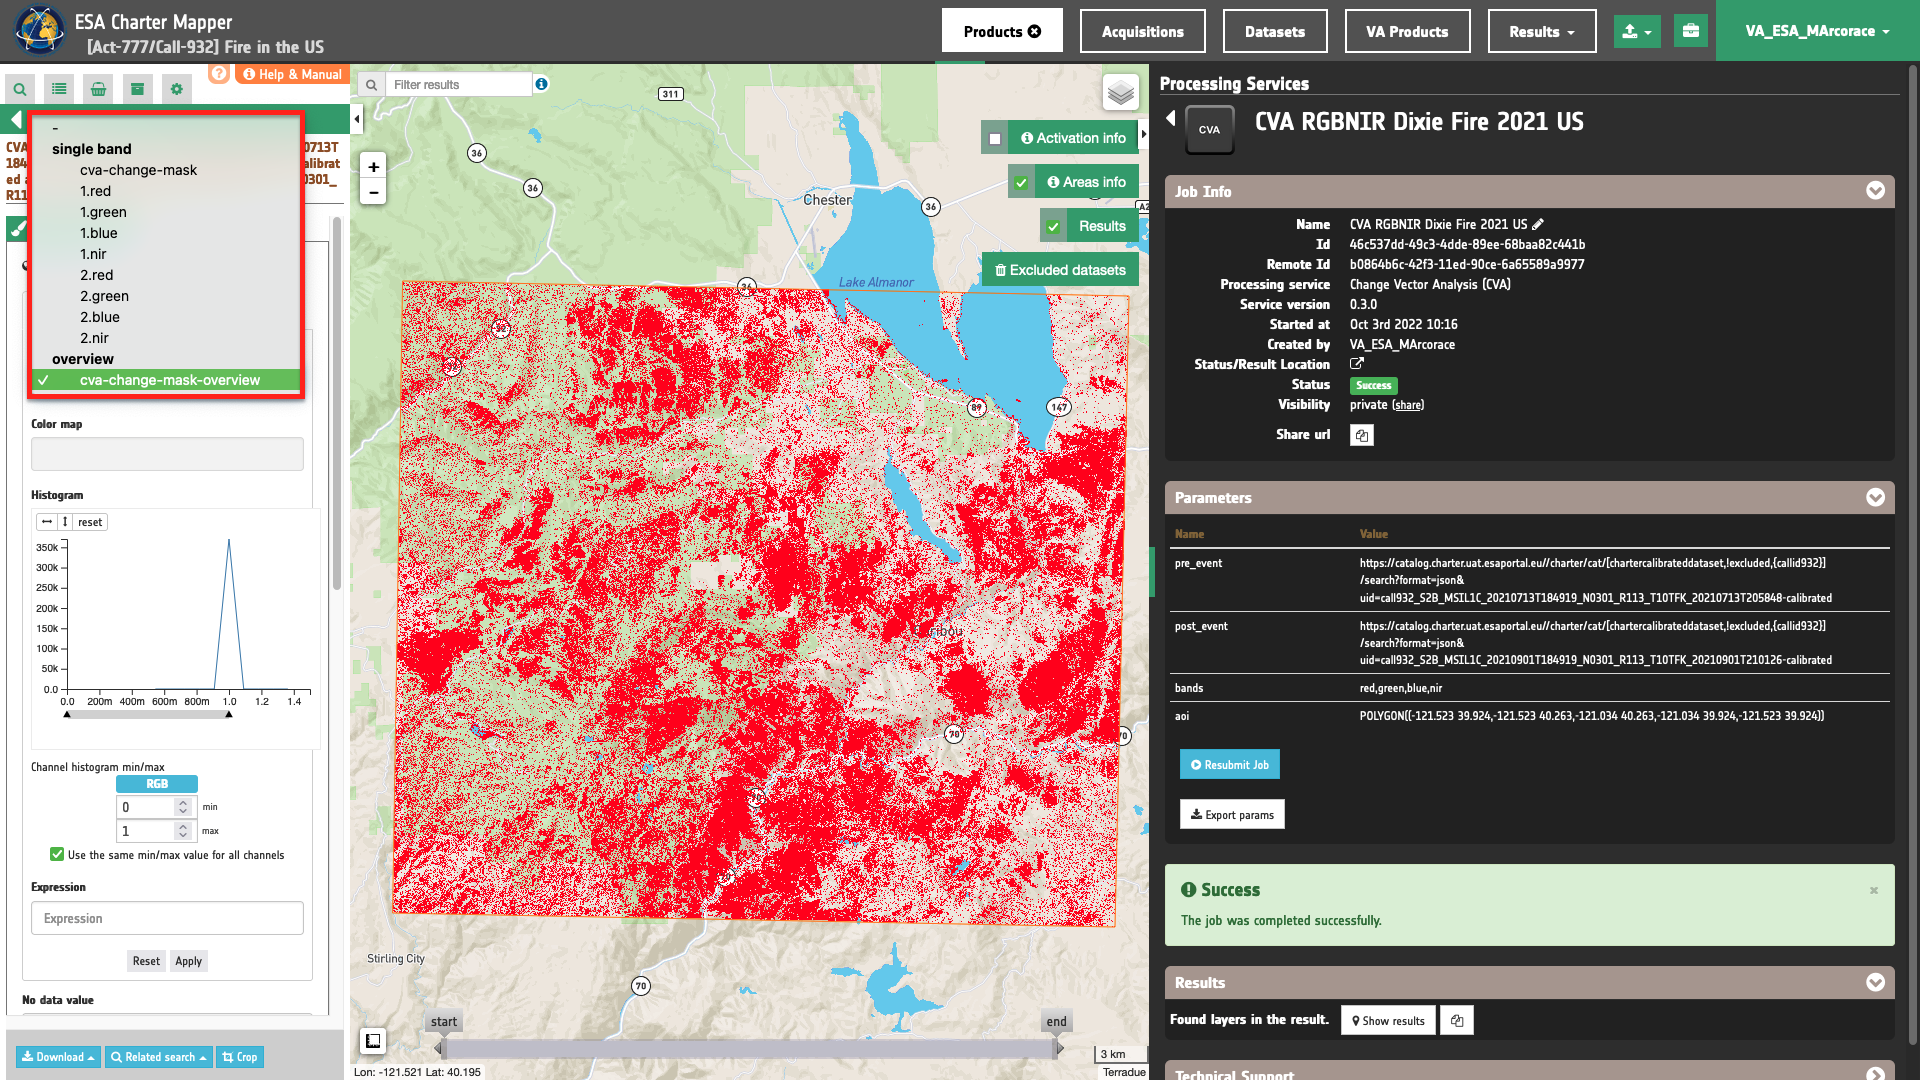
Furthermore by clicking on Layer styling you can also access to the View options. In here it is possible to see histogram/s of the Product which is visible in the map, set color formula, change Filters (e.g. Brightness, Opacity).
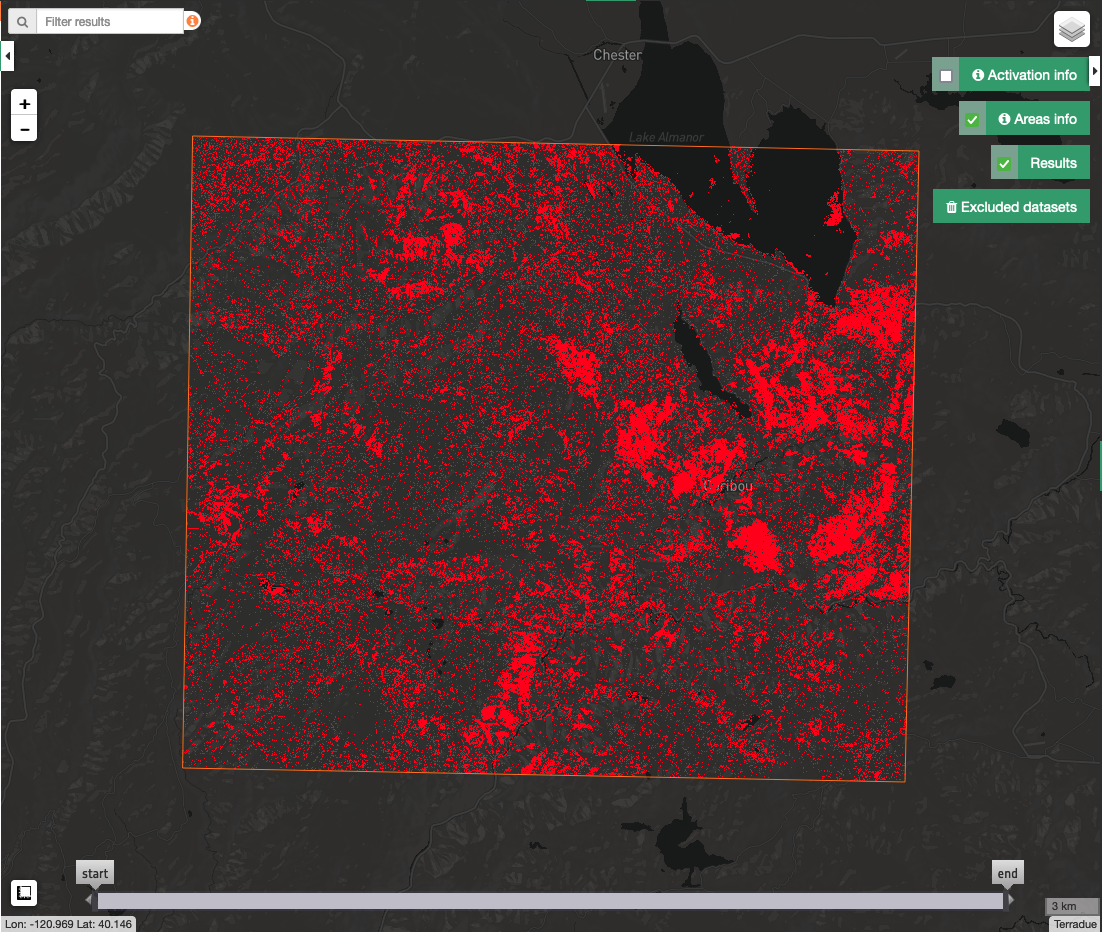
Tip
To visually compare the product overview with the underlying base layer (e.g. Natural Earth or Dark map) you can set the Opacity filter under View options as 40%.
Download
In this use case the Change Vector Analysis (CVA) service produces the following files:
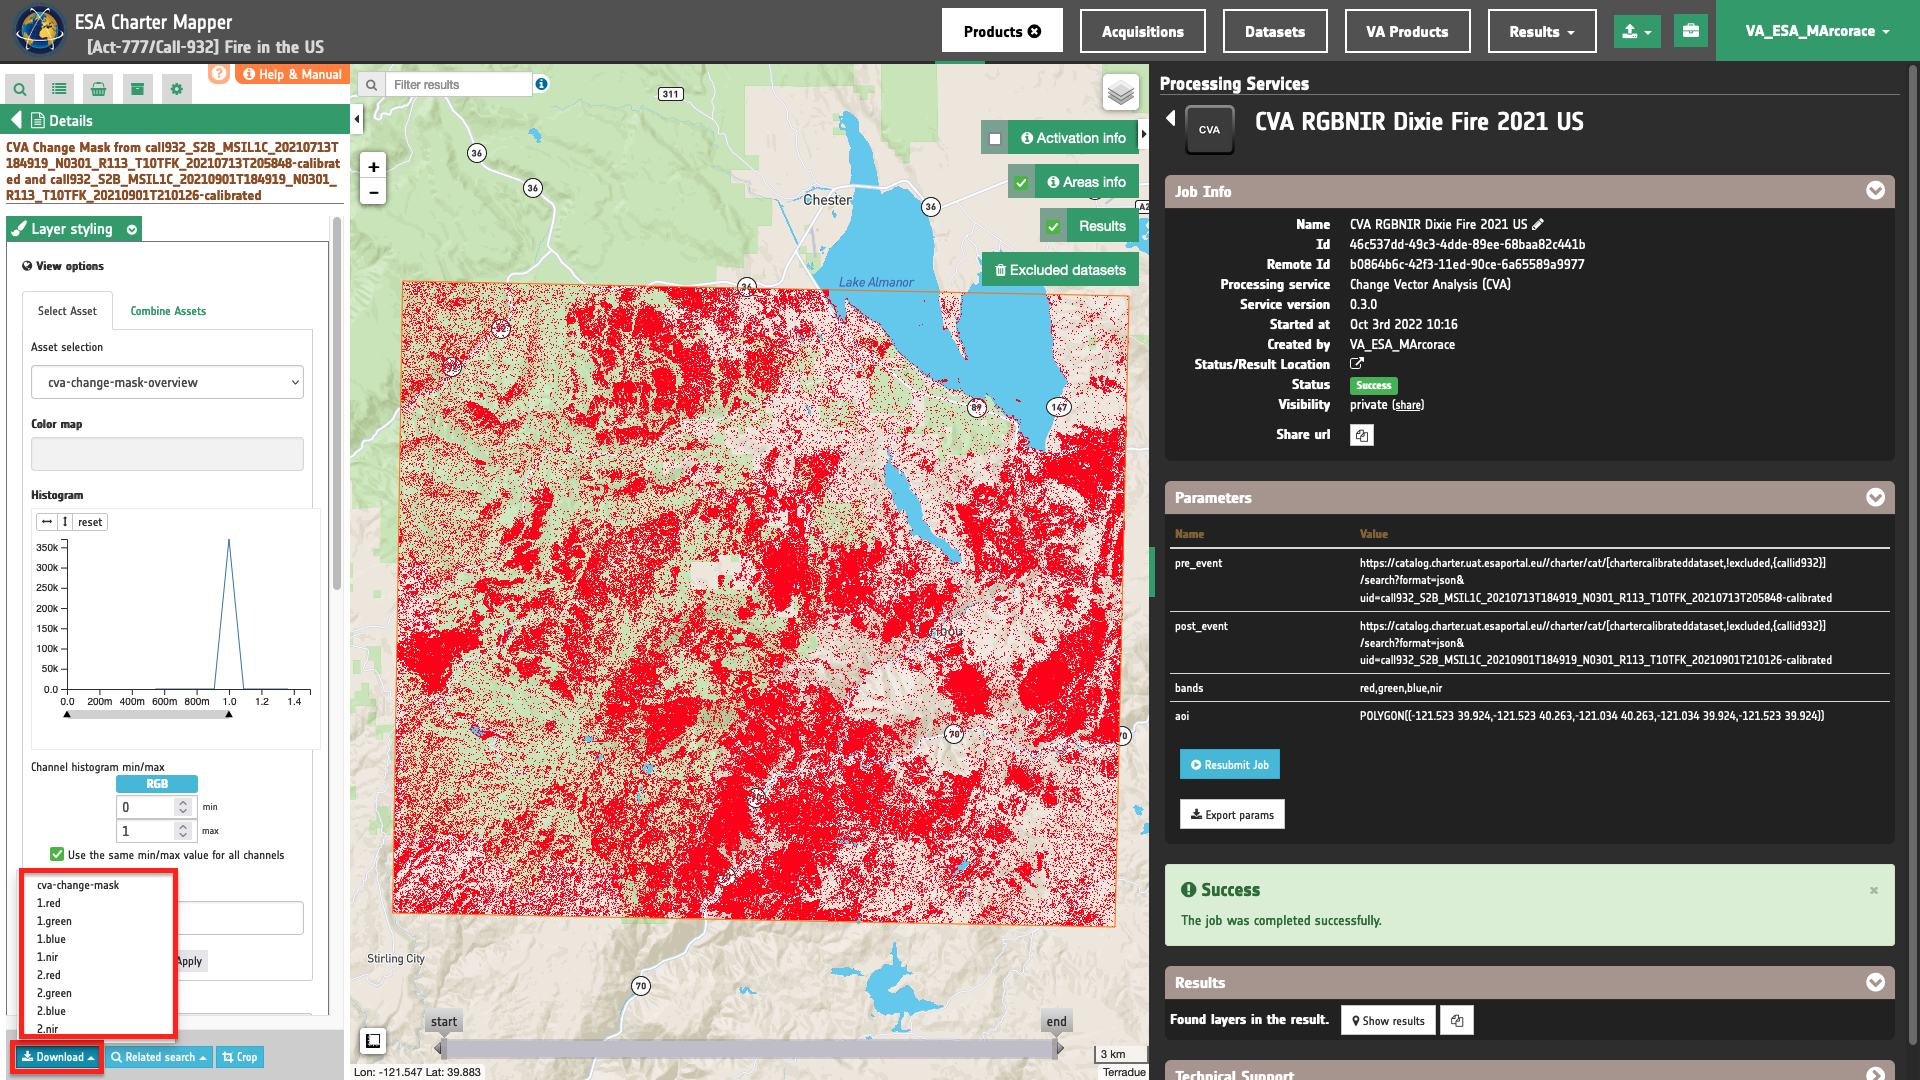
- 1.red: single-band geophysical asset
redproduct from pre-event calibrated dataset as single band GeoTIFF in COG format, - 1.green: single-band geophysical asset
greenproduct from pre-event calibrated dataset as single band GeoTIFF in COG format, - 1.blue: single-band geophysical asset
blueproduct from pre-event calibrated dataset as single band GeoTIFF in COG format, - 1.nir: single-band geophysical asset
nirproduct from pre-event calibrated dataset as single band GeoTIFF in COG format, - 2.red: single-band geophysical asset
redproduct from post-event calibrated dataset as single band GeoTIFF in COG format, - 2.green: single-band geophysical asset
greenproduct from post-event calibrated dataset as single band GeoTIFF in COG format, - 2.blue: single-band geophysical asset
blueproduct from post-event calibrated dataset as single band GeoTIFF in COG format, - 2.nir: single-band geophysical asset
nirproduct from post-event calibrated dataset as single band GeoTIFF in COG format, - cva_change_detection: single-band change detection binary mask product from CVA as single band GeoTIFF in COG format.
These products can be downloaded by clicking on the Download button located at the bottom of the Product Details tab in the left panel.
Note
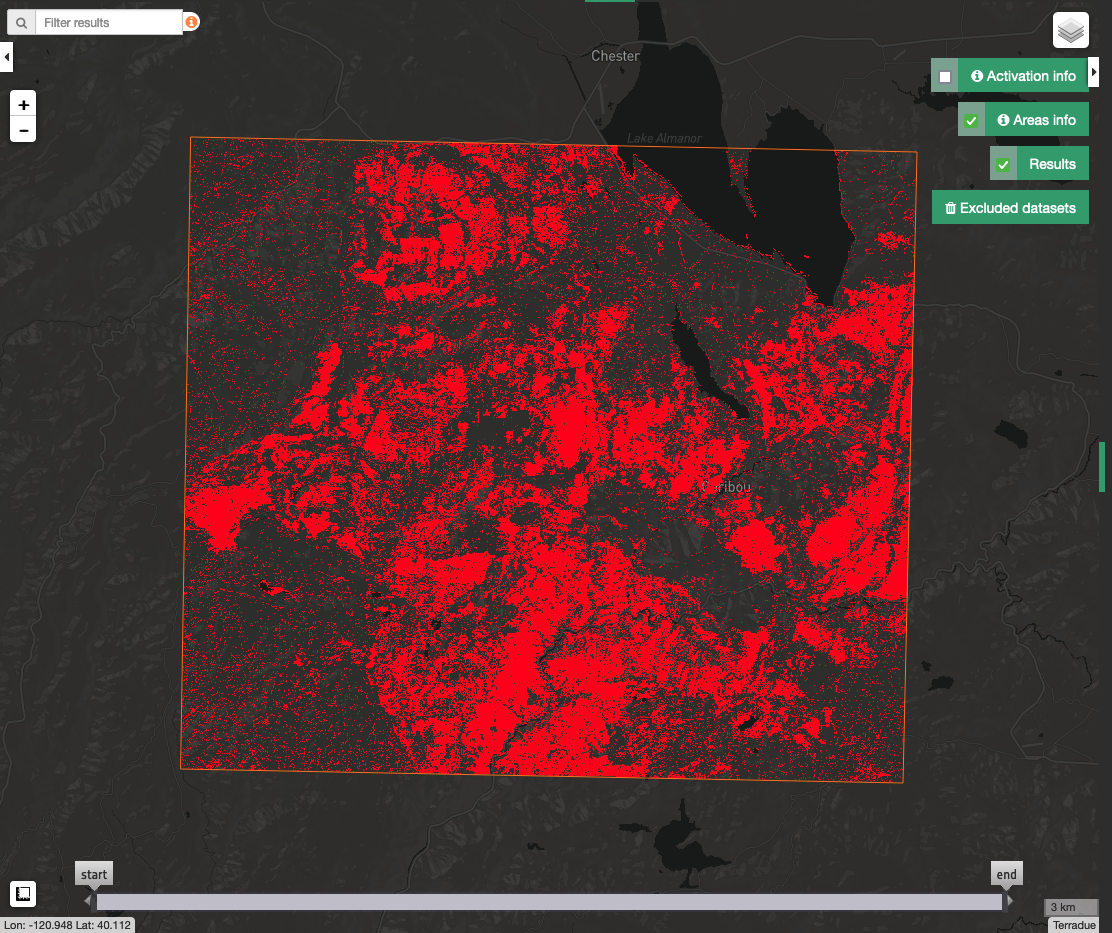
The change detection mask derived from CVA depends on the type and number of CBNs employed. Below are shown example obtained with the same EO data by using different combination of CBNs.
CVA change detection mask with red, green, and blue TOA reflectance assets
CVA change detection mask with red, green, blue, and nir TOA reflectance assets
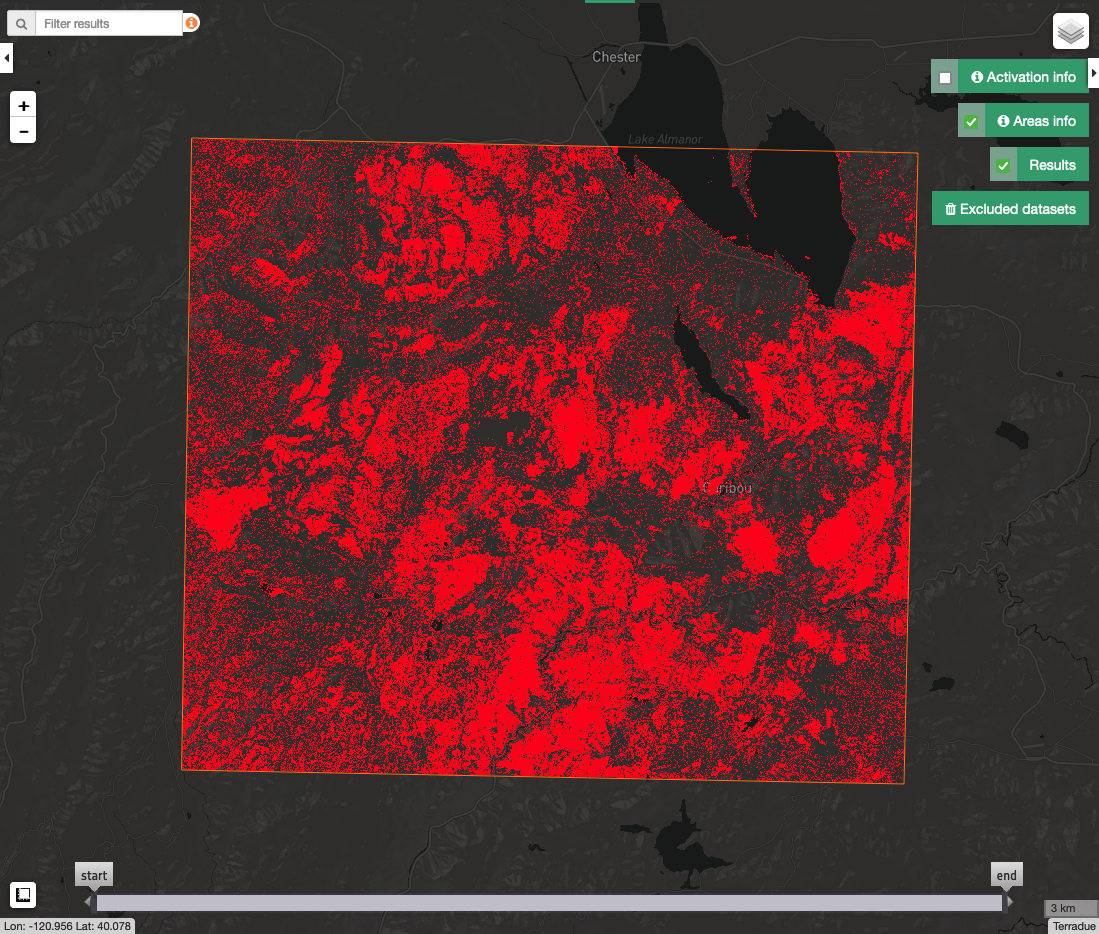
CVA change detection mask with nir, and swir16 TOA reflectance assets
Use case 2: evaluate changes in backscatter assets due to flood from pre- and post-event radar calibrated datasets
Abstract
This first use case explains how to derive a CVA change mask over a flooded area from a stack of co-located pre- and post-event dual-pol sigma nought assets.
Find the data using multiple filter criterias
Select the area for which you want to do an analysis, e.g over state, Nigeria.
From the Navigation and Search toolbar, click on Spatial Filter and draw a square AOI over the Benue river in Nigeria. This spatial filter allows you to select only the EO data acquired over this area.
From the top of the left panel, use Filter Criterias to search for “Radar” and "Sentinel-1" data collections from the list. Now it is possible to choose a pair of pre- and post-event reflectance images from Radar Calibrated Datasets to be used for the change vector analysis. As an example you can choose the following pair:
-
Pre-event [CD]: SENTINEL-1A GRD IW VV/VH 132 2022-08-21 17:37:53
-
Post-event [CD]: SENTINEL-1A GRD IW VV/VH 132 2022-09-26 17:37:54
Fill the paramters
After the definition of spatial and time filters, you can employ CVA, by using a suitable pair of Calibrated Datasets from Sentinel-1 data.
To do so you can fill the parameters as described in the following sections.
Job name
- Insert as job name:
CVA S1 VV-VH 2022 Benue river Sep 2022 Flood in Nigeria
Input pair of calibrated datasets
Drag and Drop the selected items:
-
Pre-event Calibrated Dataset
-
Post-event Calibrated Dataset
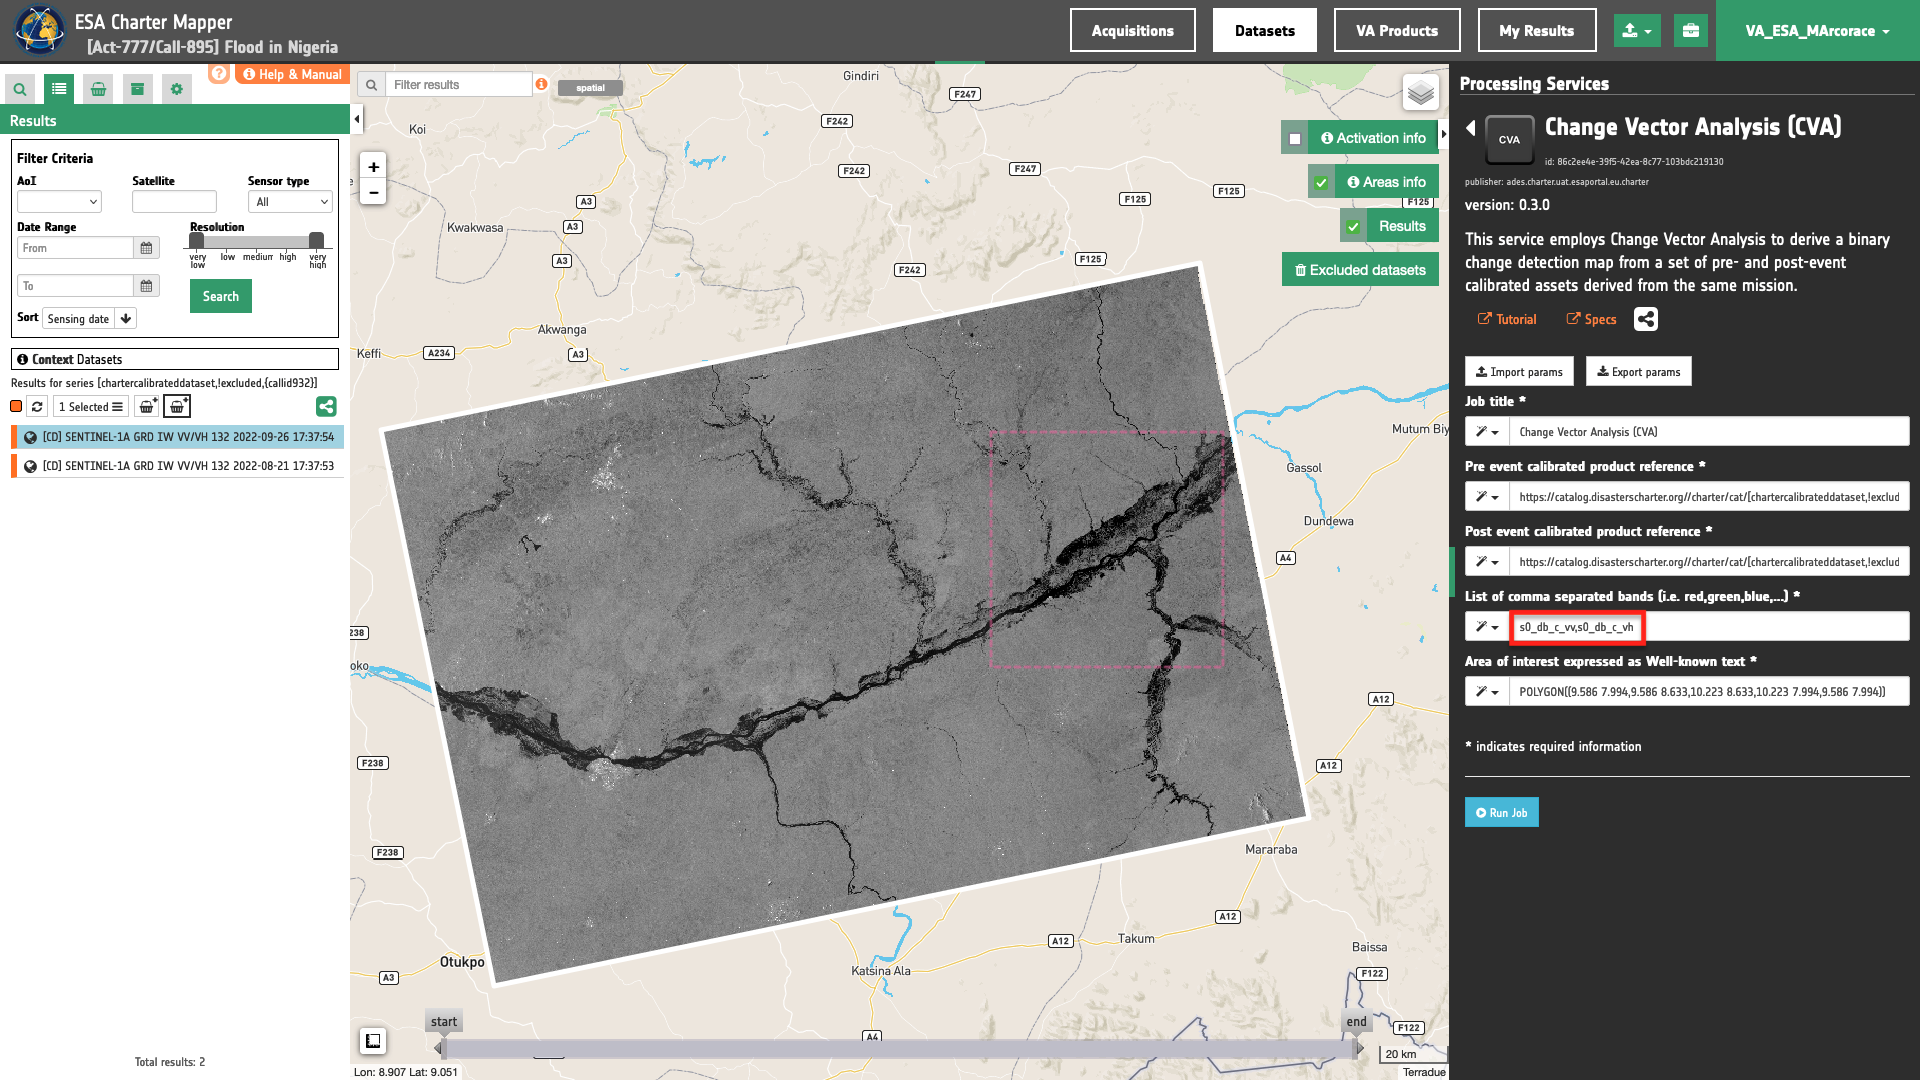
in the Pre-event calibrated product reference and the Post-event calibrated product reference fields respectively.
List of comma-separated assets
Insert the list of single-band assets to be extracted from the given pair of calibrated datasets in the "List(s) of comma-separated band(s)” field. In this parmaeter the user must manually insert a list assets given as of comma-separated list og common band names.
To employ CVA using s0_db_c_vv, and s0_db_c_vh single-band assets from two calibrated datasets the following list must be inserted:
s0_db_c_vv,s0_db_c_vh
and the service automatically extract from both pre- and post-event input calibrated datasets the pair of single-band assets for each specified CBN.
Warning
This list must include more than one CBN. Therefore, CVA requires at least 2 assets from pre- and post-event datasets.
Warning
Use comma-separated CBN and avoid spaces between assets.
Note
All CBNs available in the ESA Charter Mapper can be found here.
Warning
Both the input calibrated product references must include the single-band assets specified in the list.
Area of interest expressed as Well-known text
In the last parameter the user must define the “Area of interest as Well Known Text”. The AOI can be defined by using the drawn polygon defined with the area filter.
Tip
In the definition of “Area of interest as Well Known Text” it is possible to apply as AOI the drawn polygon defined with the area filter. To do so, click on the button in the left side of the "Area of interest expressed as Well-known text" box and select the option AOI from the list. The platform will automatically fill the parameter value with the rectangular bounding box taken the from current search area in WKT format.
Run the job
Click on the button Run Job and see the Running Job. You can monitor job progress through the progress bar.
Results: download and visualization
Once the job is completed, click on the button Show results at the bottom of the processing service panel.
Tip
You can also save the parameters employed in this job by clicking on the Export params button in the right panel. This allows you to copy all your entries to the clipboard. This is meant to be used for a quick re-submission of a similar job after a fine tuning of the parameters (e.g. to add a color formula later).
Below is reported the syntax which includes all the parameters employed in this example.
{
   "pre_event": "https://catalog.disasterscharter.org//charter/cat/[chartercalibrateddataset,{callid895}]/search?format=json&uid=call895_S1A_IW_GRDH_1SDV_20220821T173753_20220821T173818_044654_0554AF_7A67-calibrated",
   "post_event": "https://catalog.disasterscharter.org//charter/cat/[chartercalibrateddataset,{callid895}]/search?format=json&uid=call895_S1A_IW_GRDH_1SDV_20220926T173754_20220926T173819_045179_05665D_A9D3-calibrated",
   "bands": "s0_db_c_vv,s0_db_c_vh",
   "aoi": "POLYGON((9.621 8.103,9.621 8.624,10.223 8.624,10.223 8.103,9.621 8.103))"
}
Visualization
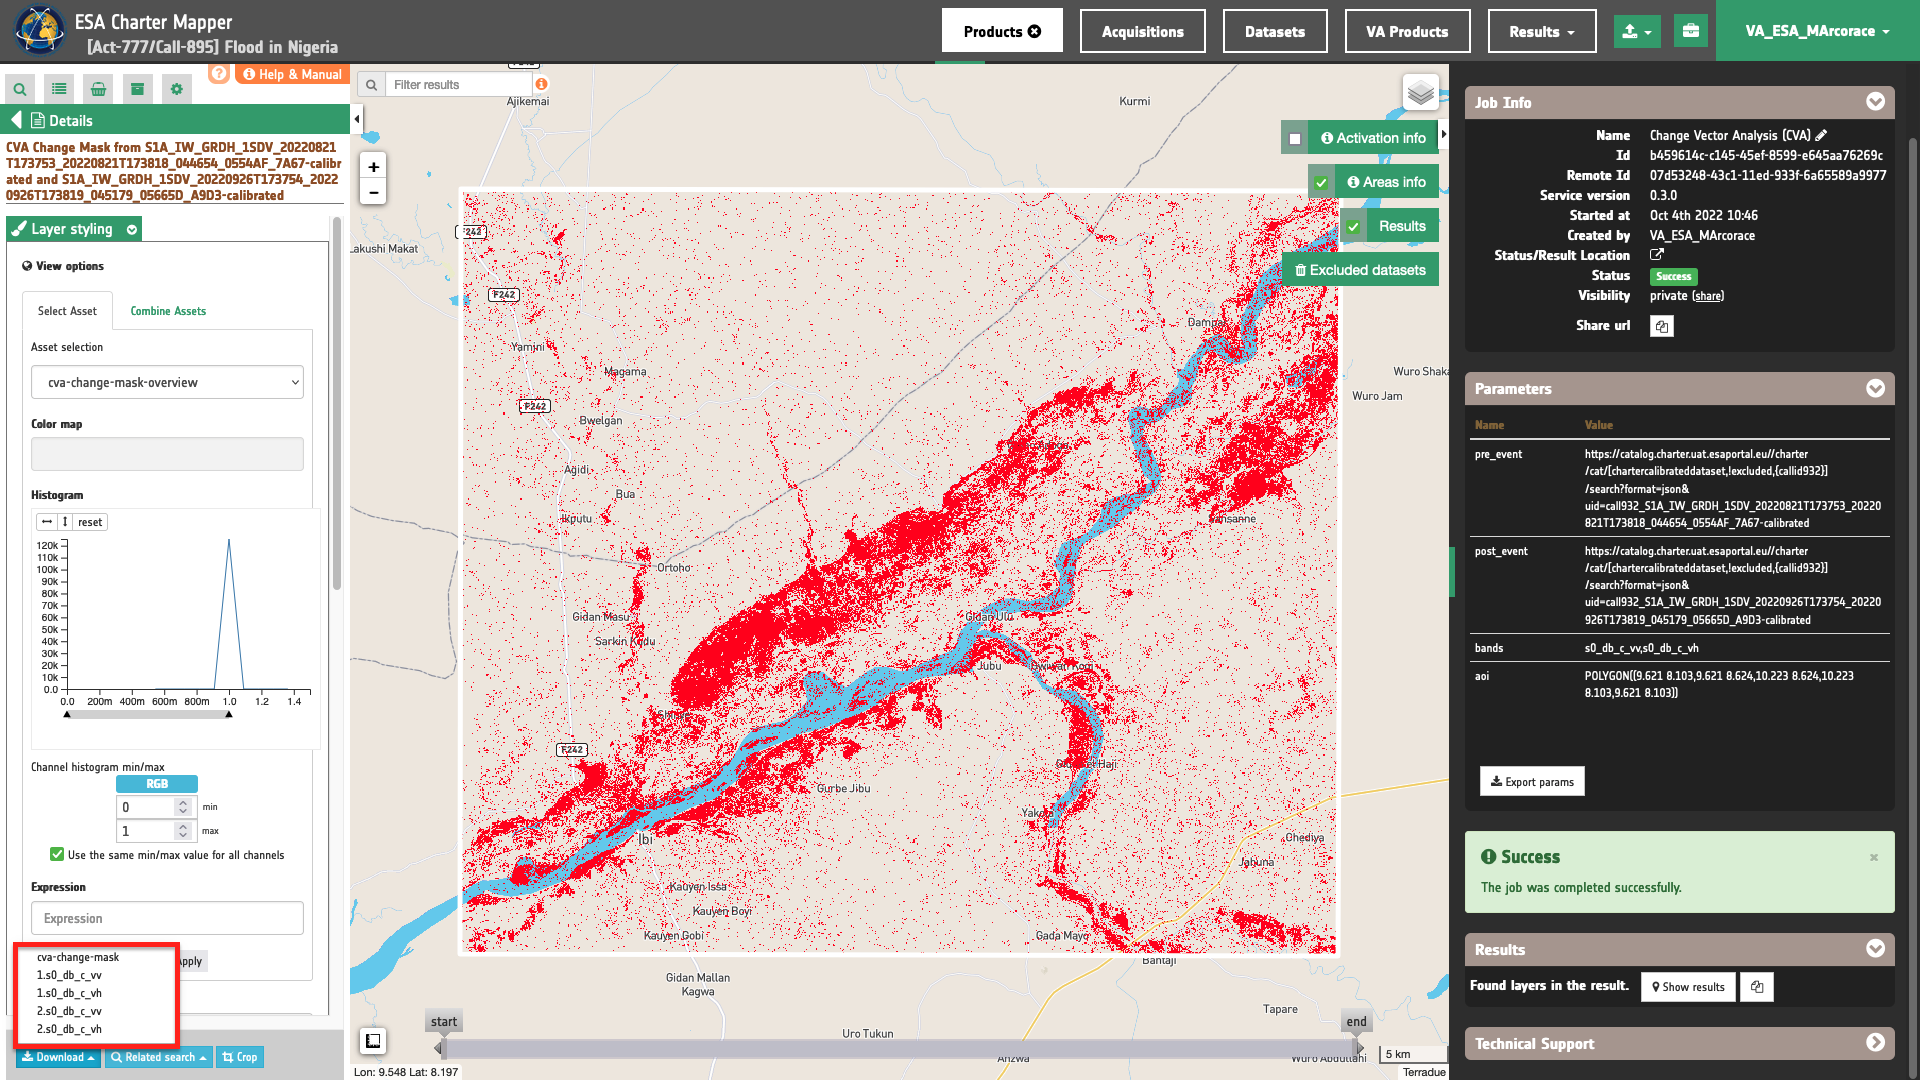
See the result on the map. The preview appears within the area defined in the spatial filter.
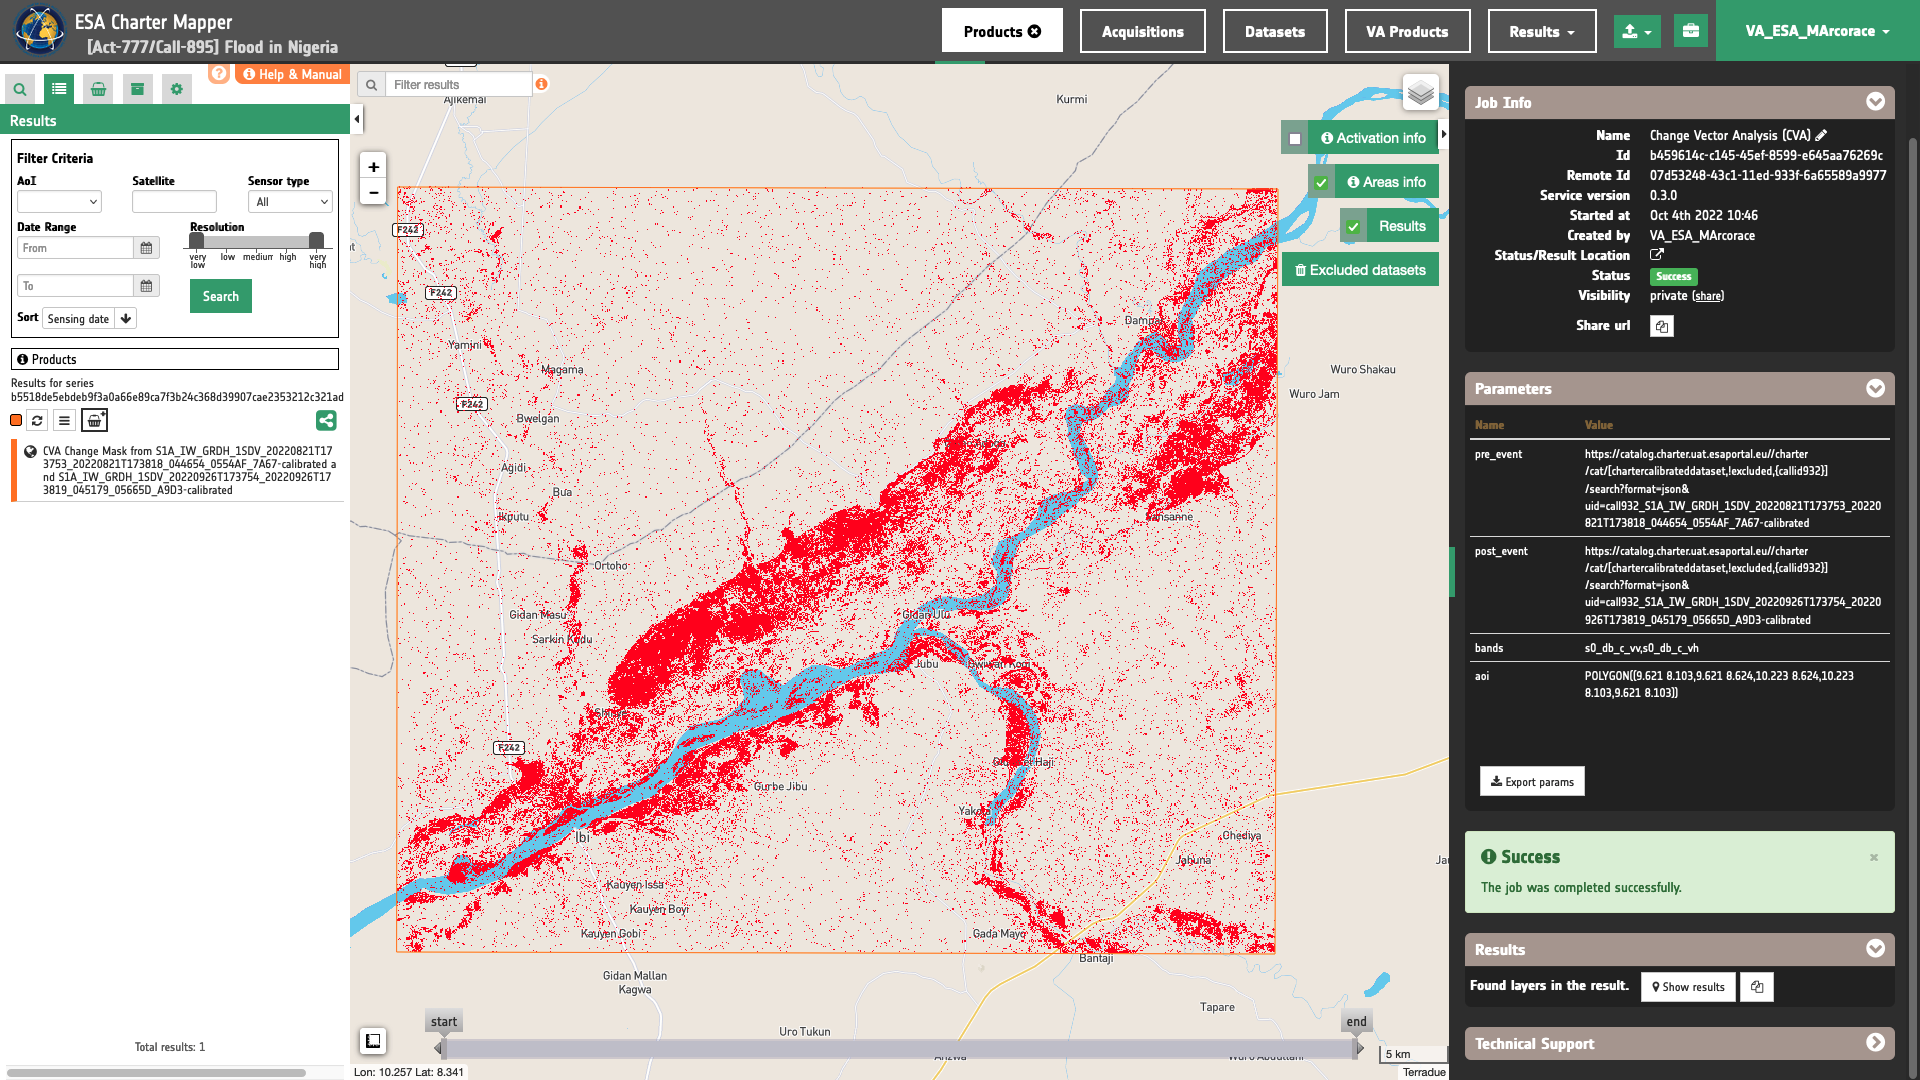
To get more information about the product just click on the preview in the map, a bubble showing the name of the layer “CVA Change Mask from S1A_IW_GRDH_1SDV_20220821T173753_20220821T173818_044654_0554AF_7A67-calibrated and S1A_IW_GRDH_1SDV_20220926T173754_20220926T173819_045179_05665D_A9D3-calibrated” will appear and then click on the Show details button.
In the left panel of the interface, the details of Job Result will appear with Product metadata. Furthermore by clicking on Layer styling you can also access to the View options. Under Select Asset it is possible to select each asset and visualize it on the map.
Furthermore by clicking on Layer styling you can also access to the View options. In here it is possible to see histogram/s of the Product which is visible in the map, set color formula, change Filters (e.g. Brightness, Opacity).
In the left panel under the result Details is possible to make RGB composites on the fly using the physical single band assets generated by the service. To do so click on Combine Assets and specify the assets in the RGB channels (e.g. R=1.s0_db_c_vv, G=B=2.s0_db_c_vv).
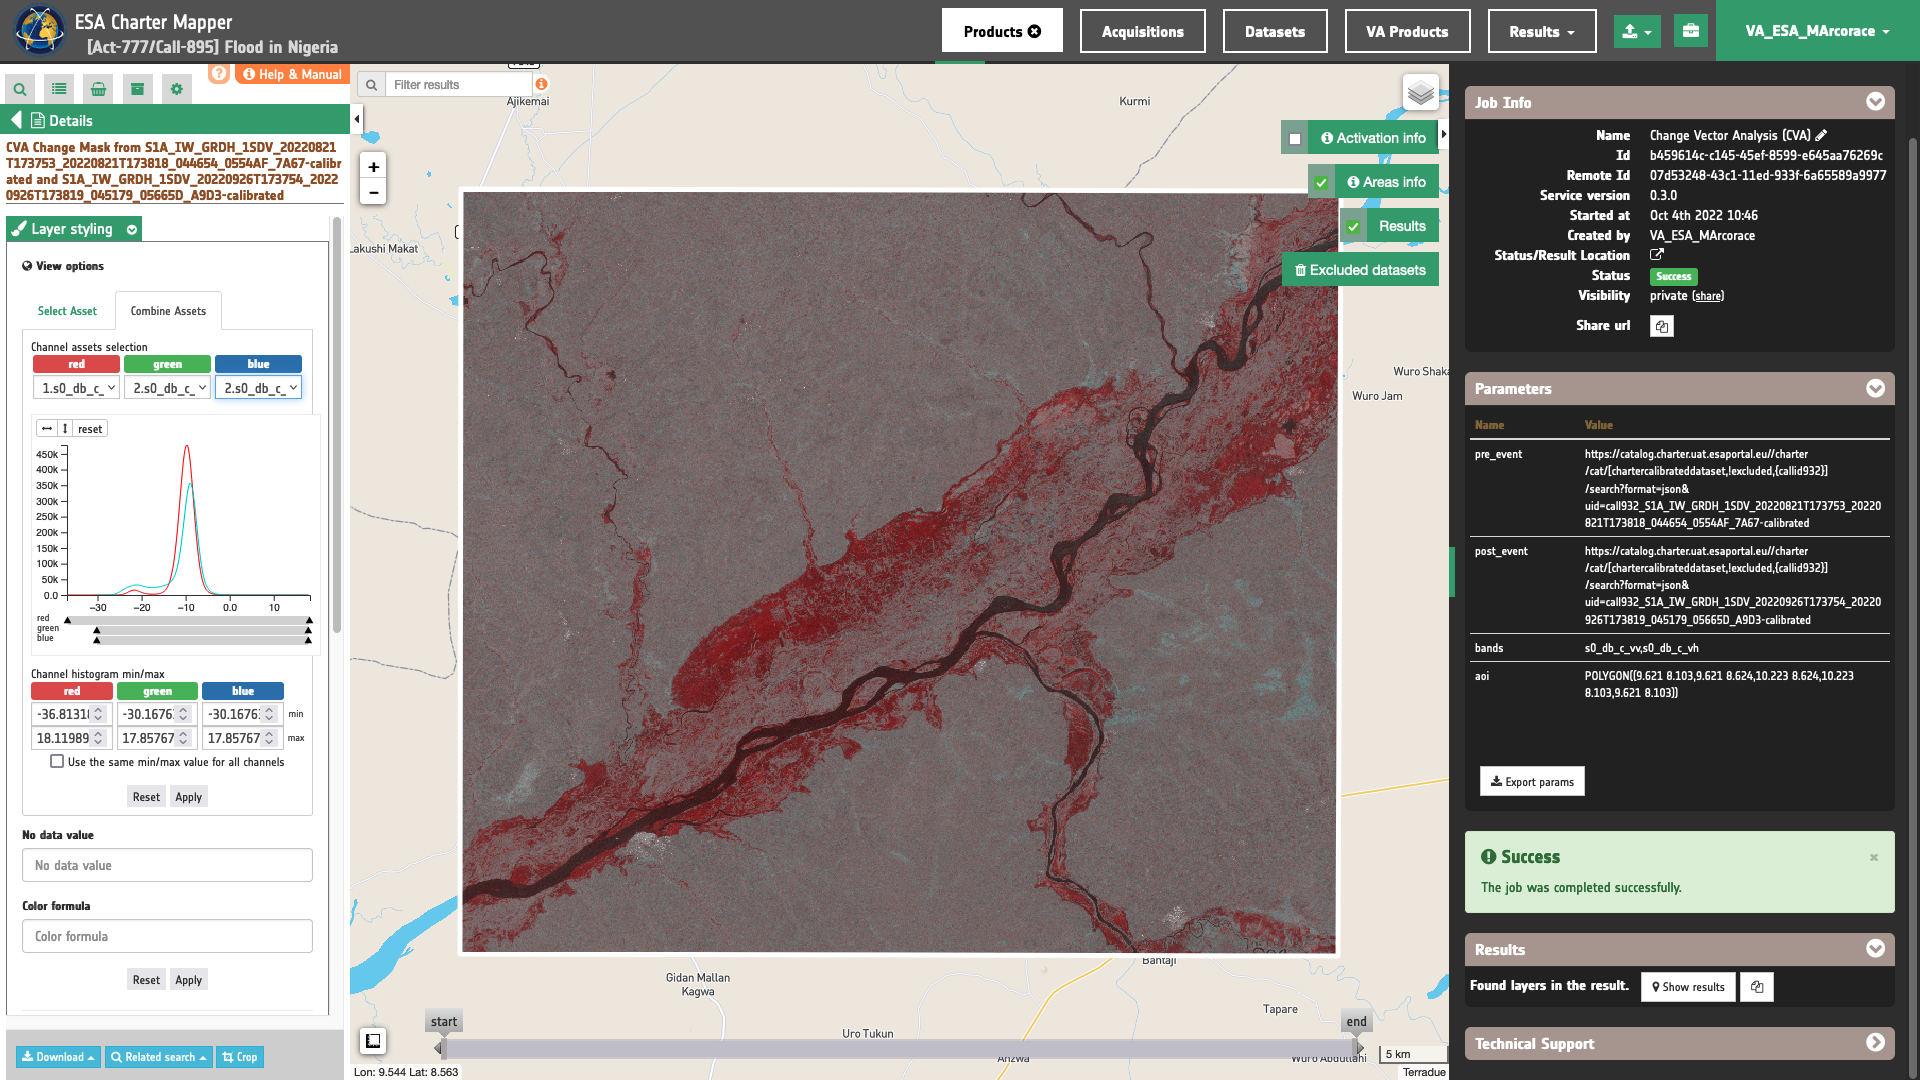
Warning
When combining geophysical single-band assets under Combine assets please consider the valid range associated with the specific asset. As an example consider [0,1] for coherence and [-20,0] for Sigma Nought in dB for co-pol assets in C band. Valid ranges for all geophysical single-band products can be found here. Min and Max values shall be inserted manually in the Channel histogram min/max boxes.
Tip
To visually compare the product overview with the underlying base layer (e.g. Natural Earth or Dark map) you can set the Opacity filter under View options as 40%.
Download
In this use case the Change Vector Analysis (CVA) service produces the following files:
- 1.s0_db_c_vv: single-band geophysical asset
s0_db_c_vvproduct from pre-event calibrated dataset as single band GeoTIFF in COG format, - 1.s0_db_c_vh: single-band geophysical asset
s0_db_c_vhproduct from pre-event calibrated dataset as single band GeoTIFF in COG format, - 2.s0_db_c_vv: single-band geophysical asset
s0_db_c_vvproduct from post-event calibrated dataset as single band GeoTIFF in COG format, - 2.s0_db_c_vh: single-band geophysical asset
s0_db_c_vhproduct from post-event calibrated dataset as single band GeoTIFF in COG format, - cva_change_detection: single-band change detection binary mask product from CVA as single band GeoTIFF in COG format.
These products can be downloaded by clicking on the Download button located at the bottom of the Product Details tab in the left panel.