COMBI-Plus service specifications
![]()
This service provides an advanced environment to create a full resolution RGB composite from a fully customizable combination of multiple single band assets from Optical or Radar Calibrated Datasets. The output has the finest resolution as of the input data (only if all selected bands are coming from the same sensor). It also provides co-located single band assets (reflectance or Sigma0 in dB) after reprojection and resampling on the same grid.
 The tutorial of the COMBI-Plus service is available in this section.
Service Description
The Advanced Multi-Sensor Band Composite (COMBI-Plus) service provides an advanced processor to create RGB composites at full resolution from a fully customizable combination of multiple assets from single or multiple EO data products (optical or radar).
The processor requires in input one or more Calibrated Datasets, including single band assets (such as reflectance or backscatter). In the RGBA band combination single band assets are resampled at the highest resolution and reprojected to the most frequent projection system.
COMBI-Plus employs a set of four s-expressions, one for each RGBA channel, to generate the band combination. In computer programming, S-expressions or symbolic expressions abbreviated as sexprs, are a notation for nested list (tree-structured) data, invented for and popularized by the programming language Lisp1. COMBI-Plus makes use of s-expressions defined by the user to manipulate the input and map them to a common [0,1] data range. Normalized input EO data are then used in this service to generate the output RGBA composition.
The COMBI-Plus service supports Optical and SAR Calibrated Datasets. Outputs of COMBI-Plus are: resampled and reprojected single band assets from a co-location and a full resolution RGB composite in COG format.
Workflow
The processing service applies the workflow below:
Input
As in its basic version (COMBI), the COMBI-Plus processor requires as input the calibrated datasets produced by the optical and SAR calibration processors or the output products with physical meaning from all the other processing services provided those are single band raster in GeoTIFF format. Therefore, input of this multi-mission, multi-sensor EO data processing service can represent different physical measurements, such as: reflectances, backscatter in db, spectral indexes, interferometric coherence, etc (see list of physical meaning products here.
Thus, the input may have different valid ranges:
-
from 0 to 1 for e.g. reflectances and coherence,
-
from -1 to 1 for the NDVI spectral index,
-
from -15 to 5 db for sigma0 in band C and VV polarization,
-
etc.
Each of them is given by following a dedicated data structure (e.g. unit, data type, scale factor, valid range) with respect to the nature of the product. A complete overview of these values is available in Table 2 of this section.
Parameters
The COMBI-Plus service requires a specified number of mandatory and optional parameters. All service parameters are listed in the below Table 1.
| Parameter | Description | Required | Default value |
|---|---|---|---|
| Input product(s) reference(s) | Input dataset(s) or product(s) to be used in the RGB composite | YES | |
| Red channel expression | S-expression for red channel | YES | |
| Green channel expression | S-expression for green channel | YES | |
| Blue channel expression | S-expression for blue channel | YES | |
| Alpha channel expression | S-expression for alpha channel to set transparency | NO | |
| Color operations | Color formula based on Rio-color expressions | NO | |
| Area of Interest | Area of interest expressed in WKT | NO |
Table 1 - Service parameters for the COMBI-Plus processor.
Input product reference/s
The first parameter represents the list of input products that are used to create the RGB band combination. The input products can be: optical calibrated products, SAR calibrated products, physical meaning products provided those are single band raster in GeoTIFF format
RGBA s-expressions
The following four required parameters are the s-expressions for red, green, blue and alpha channels which are necessary to normalize different types of input single band assets that need to be combined into a RGB band composite ans set transparency.
S-expressions in the ESA Charter Mapper supports arithmetic (* + / -) and logical (< <= == != >= > & |) operators plus some pre-defined functions.
More information about supported functions can be found in Table 2.
| Function | Description | Syntax |
|---|---|---|
| asarray | convert the input (list, tuples, etc.) to an array | (asarray x) |
| interp | returns the one-dimensional piecewise linear interpolant to a function with given discrete data points (xp, fp), evaluated at x | (interp x xp fp) |
| mean | returns the mean value (scalar) from the given input array x | (mean x) |
| norm_diff | returns the mormalized difference between A and B as per ((x - y) / (x + y)) | (norm_diff x y) |
| where | return elements chosen from x or y depending on condition | (where (condition) x y) |
Table 2 - Supported functions that can be used in s-expressions.
Interpolate or rescale
The typical s-expression for each channel of an RGBA is the following:
(interp dataset.asset (asarray MIN MAX) (asarray 0 1))
where dataset is the source input calibrated dataset, asset represents the asset to be manipulated in the specific RGBA channel (e.g. a red CBN for TOA reflectance from a calibrated Dataset), MIN and MAX the values that define the valid range to consider.
As an example the following s-expression:
(interp 1.red (asarray 0 10000) (asarray 0 1))
can be used to interpolate the resclaed TOA reflectance into its original [0,1] range. Here (asarray 0 10000) returns [0, 10000] and is used to specify input range to be used for the interpolation.
Warning
The s-expressions inserted by the user must be given within brackets as shown here:
(interp dataset.asset (asarray MIN MAX) (asarray 0 1))
Other examples of s-expresions which can be used in COMBI-Plus are listed in the below sections.
Sum
The following s-expression:
(+ dataset.asset dataset.asset)
can be used to compute the sum of two assets.
Difference
The following s-expression:
(- dataset.asset dataset.asset)
can be used to compute the difference of two assets.
Average
The following s-expression:
(/ (+ dataset.asset dataset.asset) 2)
can be used to compute the average between two asset.
Difference from average
The following s-expression:
(- dataset.asset (mean dataset.asset))
can be used to compute difference from the average value of a asset.
Normalized difference
The following s-expression:
(norm_diff dataset.asset dataset.asset)
can be used to compute a normalized difference from two assets (e.g. NDVI, NDWI, NDBI, etc.).
Binarization
The following s-expression:
(where (>= dataset.asset value) 1 0)
where dataset is the source input calibrated dataset, asset represents the asset to be used an value is the scalar to be used in the condition.
As an example the s-expression:
(where (>= (norm_diff 1.green 1.nir) 0.3) 1 0)
can be used for binarization. Here (norm_diff 1.green 1.nir) is used to derive the NDWI index. The value 0.3 represents the threshold as TOA reflectance. Similar s-expressions can be made also for SAR such as:
(where (<= 1.s0_db_c_hh -23) 1 0)
in which 1.s0_db_c_hh is the asset and the value -23 represents the threshold as Sigma Nought in dB.
Applying s-expression for different input data
The s-expression requires to be tailored to the nature of the input data. Below are listed some examples of typical s-expressions.
As an example, TOA Reflectances are encoded as uint16 with a scaling factor of 0.0001, the s-expression is:
(interp 1.red (asarray 0 10000) (asarray 0 1))
where 1.red is the the single band asset for TOA reflectance with optical CBN=red from the dataset 1.
Concerning s-expressions for Radar images, SAR calibrated datasets in the ESA Charter Mapper are given as Sigma Nought which are expressed in decibels. In handling Sigma Nought values in logarithmic scale, it is often useful to consider only Sigma Nought values within a predefined interval (e.g. minimum and maximum for backscatter values above a certain pixel count threshold). For instance for SAR data in C-band and VV polarization, a valid range in dB of [-20, 0] can be assumed. Therefore, the expression becomes:
(interp 1.s0_db_c_vv (asarray -20 0) (asarray 0 1))
where 1.s0_db_c_vv is the single band asset for Sigma Nought in dB in VV polarization.
Example
This sample s-expresion can be extended for other combinations of SAR-band and polarization. To do so a configuration of multiple valid ranges expressed in dB, already designed for the ESA Charter Mapper, can be found in this table.
Instead, the spectral indexes available in the ESA Charter Mapper are encoded in the ESA Charter Mapper as floats with values between -1 and 1 being normalized differences. As such the expression becomes:
(interp ndvi (asarray -1 1) (asarray 0 1))
where ndvi is the single band asset for the NDVI spectral index.
Color operations (optional)
The three mandatory s-expressions for RGB channels can also be complemented with a color formula. The color formula expression is composed by three parameters: Gamma, Sigmoidal, and Saturation which need to be manually inserted by the user. The color formula syntax is described in this section of the user manual about the TiTiler tool of the Geobrowser.
Tip
For intrasensor RGB composites from optical EO data (e.g. TRC or CIV) the following color formula can be inserted:
Gamma RGB 1.5 Sigmoidal RGB 10 0.3 Saturation 1
Further information can be also found by looking at the application of color formulas in the ESA Charter Mapper which is described here
AOI (optional)
This last parameter (optional) may define the area of interest expressed as a Well-Known Text value.
Tip
In the definition of “Area of interest as Well Known Text” it is possible to apply as AOI the drawn polygon defined with the area filter. To do so, click on the button in the left side of the "Area of interest expressed as Well-known text" box and select the option AOI from the list. The platform will automatically fill the parameter value with the rectangular bounding box taken the from current search area in WKT format.
Outputs
The primary output product of this service is a full resolution RGBA composite. The service also provides as output the single asset used as input, as well as the red-, green-, and blue channels as single band GeoTIFF in COG format. Thus, the COMBI processor provides as output the following products as GeoTIFF in Cloud Optimized Geotiff (COG) format:
- Multi-sensor-composite as 4 bands RGBA, plus the three single-bands for Red-, Green-, and blue channels, in Cloud Optimized Geotiff (COG) format,
- N=D*A assets from the number of input datasets (D) and their source assets (A) employed as input in this service (e.g. for color infrared vegetation band combination of a pair of calibrated dataset the service produces a total of six products: 1.nir, 2.nir, 1.green, 2.green, 1.red and 2.red). These N products are given as a single band GeoTIFF in COG format. Such assets represent a physical meaning product (TOA reflectance for optical or sigma0 in dB for SAR data) only in case input references are taken from Calibrated Datasets.
COMBI-Plus Product Specifications can be found below.
| Attribute | Value / description |
|---|---|
| Long Name | Advanced Multi-Sensor Band Composite Product |
| Short Name | overview |
| Description | RGBA color composite with a combination of 3 selected single-band assets plus an alpha band that acts as a transparency mask |
| Processing level | L1 / L2 (according to input) |
| Data Type | UnSigned 8-bit Integer |
| Band | 4 |
| Format | COG |
| Projection | EPSG:4326 - WGS84 |
| Valid Range | [1 - 255] |
| Fill Value | 0 |
Typical COMBI-Plus applications
Expressions for RGB Composites
Intra-sensor RGB composites can be derived as following:
- Red channel expression
(interp 1.red (asarray 0 10000) (asarray 0 1))
- Green channel expression
(interp 1.green (asarray 0 10000) (asarray 0 1))
- Blue channel expression
(interp 1.blue (asarray 0 10000) (asarray 0 1))
Params
{
    "input_reference": [
        ""
    ],
    "aoi": "",
    "red_expression": "(interp 1.red (asarray 0 10000) (asarray 0 1))",
    "green_expression": "(interp 1.green (asarray 0 10000) (asarray 0 1))",
    "blue_expression": "(interp 1.blue (asarray 0 10000) (asarray 0 1))",
    "alpha_expression": "",
    "color_ops": ""
}
- Red channel expression
(interp 1.nir (asarray 0 10000) (asarray 0 1))
- Green channel expression
(interp 1.red (asarray 0 10000) (asarray 0 1))
- Blue channel expression
(interp 1.green (asarray 0 10000) (asarray 0 1))
Params
{
    "input_reference": [
        ""
    ],
    "aoi": "",
    "red_expression": "(interp 1.nir (asarray 0 10000) (asarray 0 1))",
    "green_expression": "(interp 1.red (asarray 0 10000) (asarray 0 1))",
    "blue_expression": "(interp 1.green (asarray 0 10000) (asarray 0 1))",
    "alpha_expression": "",
    "color_ops": ""
}
- Red channel expression
(interp 1.swir22 (asarray 0 10000) (asarray 0 1))
- Green channel expression
(interp 1.swir16 (asarray 0 10000) (asarray 0 1))
- Blue channel expression
(interp 1.nir (asarray 0 10000) (asarray 0 1))
Params
{
    "input_reference": [
        ""
    ],
    "aoi": "",
    "red_expression": "(interp 1.swir22 (asarray 0 10000) (asarray 0 1))",
    "green_expression": "(interp 1.swir16 (asarray 0 10000) (asarray 0 1))",
    "blue_expression": "(interp 1.nir (asarray 0 10000) (asarray 0 1))",
    "alpha_expression": "",
    "color_ops": ""
}
The same can be applied by looking at the other RGB combinations in here.
SAR amplitude change
The SAR-change RGB composite for a C-band SAR in VV polarization is defined as:
- Red channel expression
(interp 1.s0_db_c_vv (asarray -15 5) (asarray 0 1))
- Green channel expression
(interp 2.s0_db_c_vv (asarray -15 5) (asarray 0 1))
- Blue channel expression
(interp 2.s0_db_c_vv (asarray -15 5) (asarray 0 1))
Where:
1.s0_db_c_vv is the sigma nought in db for a C-band SAR in VV polarization before the change
2.s0_db_c_vv is the sigma nought in db for a C-band SAR in VV polarization after the change
Params
{
   "input_reference": [
       ""
          ],
   "red_expression": "(interp 1.s0_db_c_vv (asarray -15 5) (asarray 0 1))",
   "green_expression": "(interp 2.s0_db_c_vv (asarray -15 5) (asarray 0 1))",
   "blue_expression": "(interp 2.s0_db_c_vv (asarray -15 5) (asarray 0 1))",
   "alpha_expression": ""
}
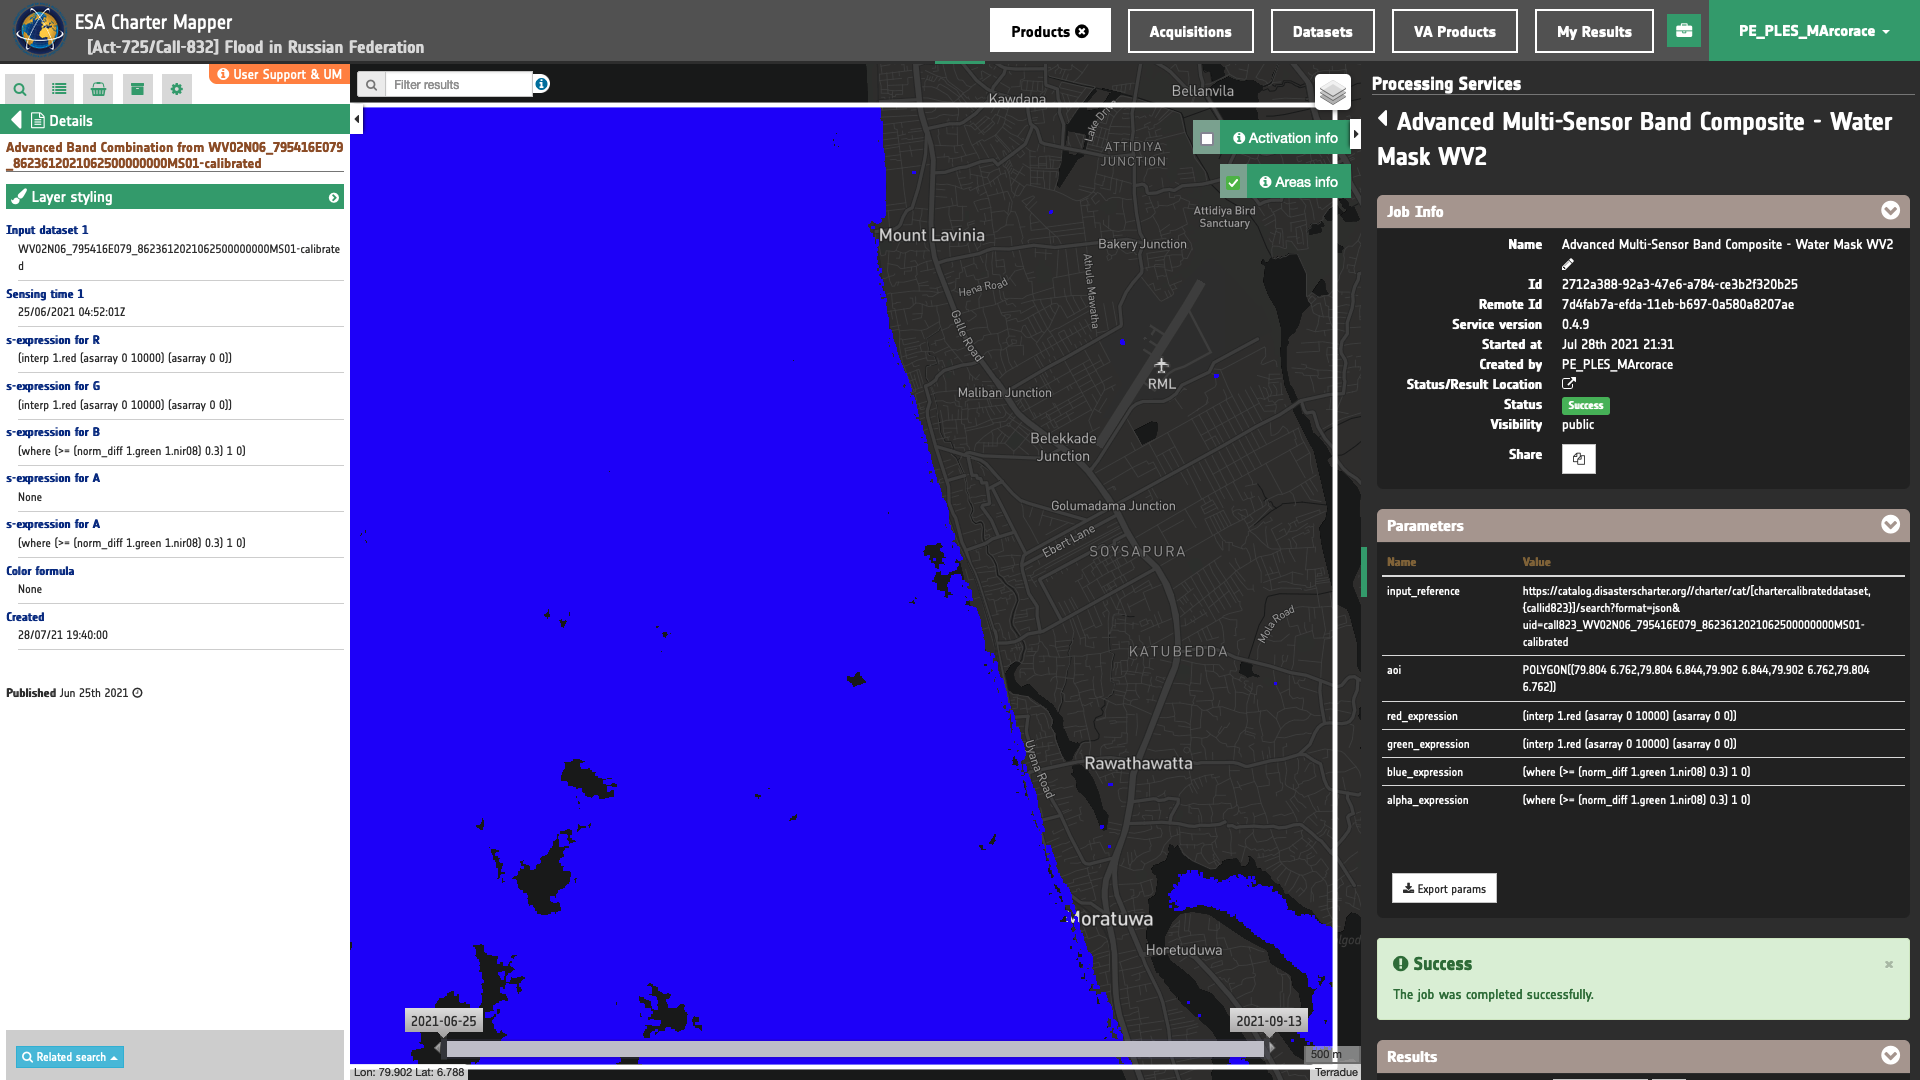
Water mask from Optical Data
A water mask can be derived from calibrated optical data using the following s-expressions:
- Red channel expression
(interp 1.red (asarray 0 10000) (asarray 0 0))
- Green channel expression
(interp 1.red (asarray 0 10000) (asarray 0 0))
- Blue channel expression
(where (>= (norm_diff 1.green 1.nir) 0.3) 1 0)
- Alpha channel expression
(where (>= (norm_diff 1.green 1.nir) 0.3) 1 0)
Params
{
   "input_reference": [
       ""
          ],
   "red_expression": "(interp 1.red (asarray 0 10000) (asarray 0 0))",
   "green_expression": "(interp 1.red (asarray 0 10000) (asarray 0 0))",
   "blue_expression": "(where (>= (norm_diff 1.green 1.nir) 0.3) 1 0)",
   "alpha_expression": "(where (>= (norm_diff 1.green 1.nir) 0.3) 1 0)"
}
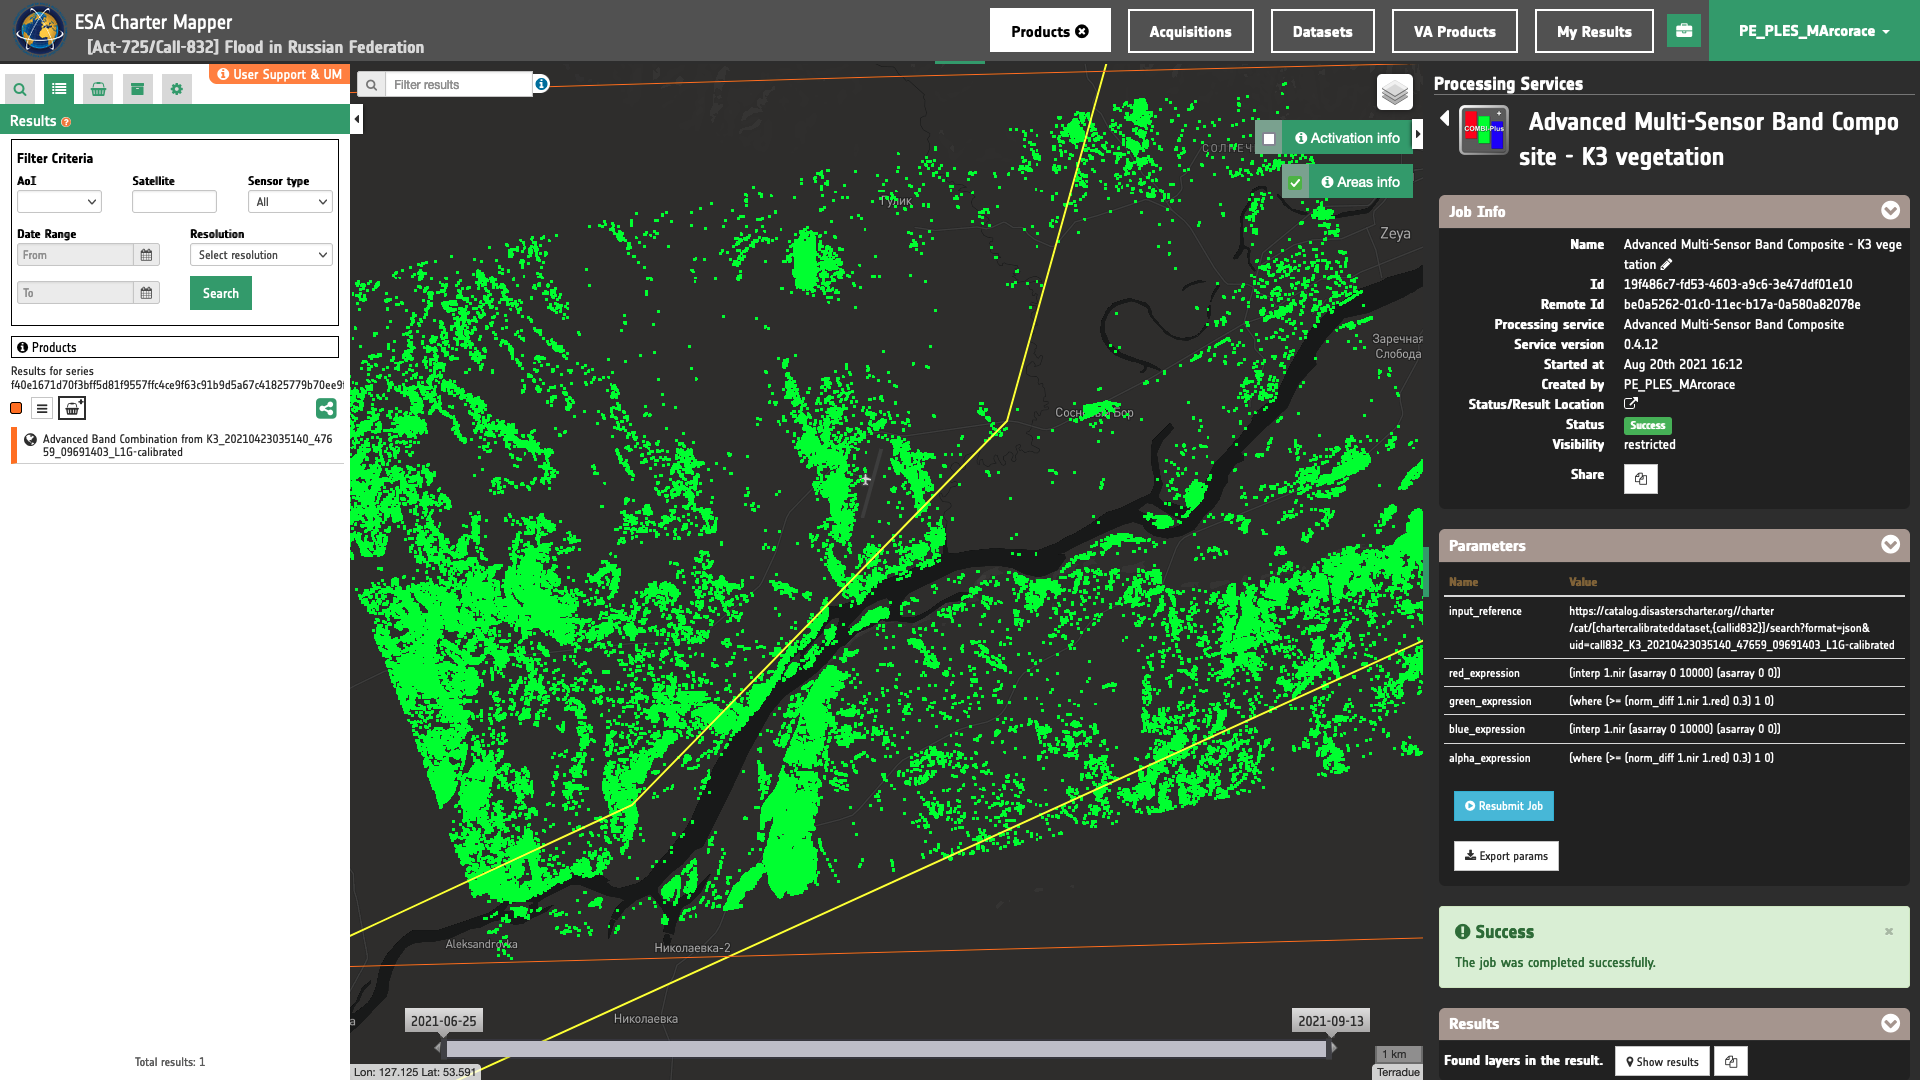
Vegetation mask from Optical Data
A vegetation mask can be derived from calibrated optical data using the following s-expressions:
- Red channel expression
(interp 1.nir (asarray 0 10000) (asarray 0 0))
- Green channel expression
(where (>= (norm_diff 1.nir 1.red) 0.3) 1 0)
- Blue channel expression
(interp 1.nir (asarray 0 10000) (asarray 0 0))
- Alpha channel expression
(where (>= (norm_diff 1.nir 1.red) 0.3) 1 0)
Params
{
   "input_reference": [
       ""
          ],
   "red_expression": "(interp 1.nir (asarray 0 10000) (asarray 0 0))",
   "green_expression": "(where (>= (norm_diff 1.nir 1.red) 0.3) 1 0)",
   "blue_expression": "(interp 1.nir (asarray 0 10000) (asarray 0 0))",
   "alpha_expression": "(where (>= (norm_diff 1.nir 1.red) 0.3) 1 0)"
}
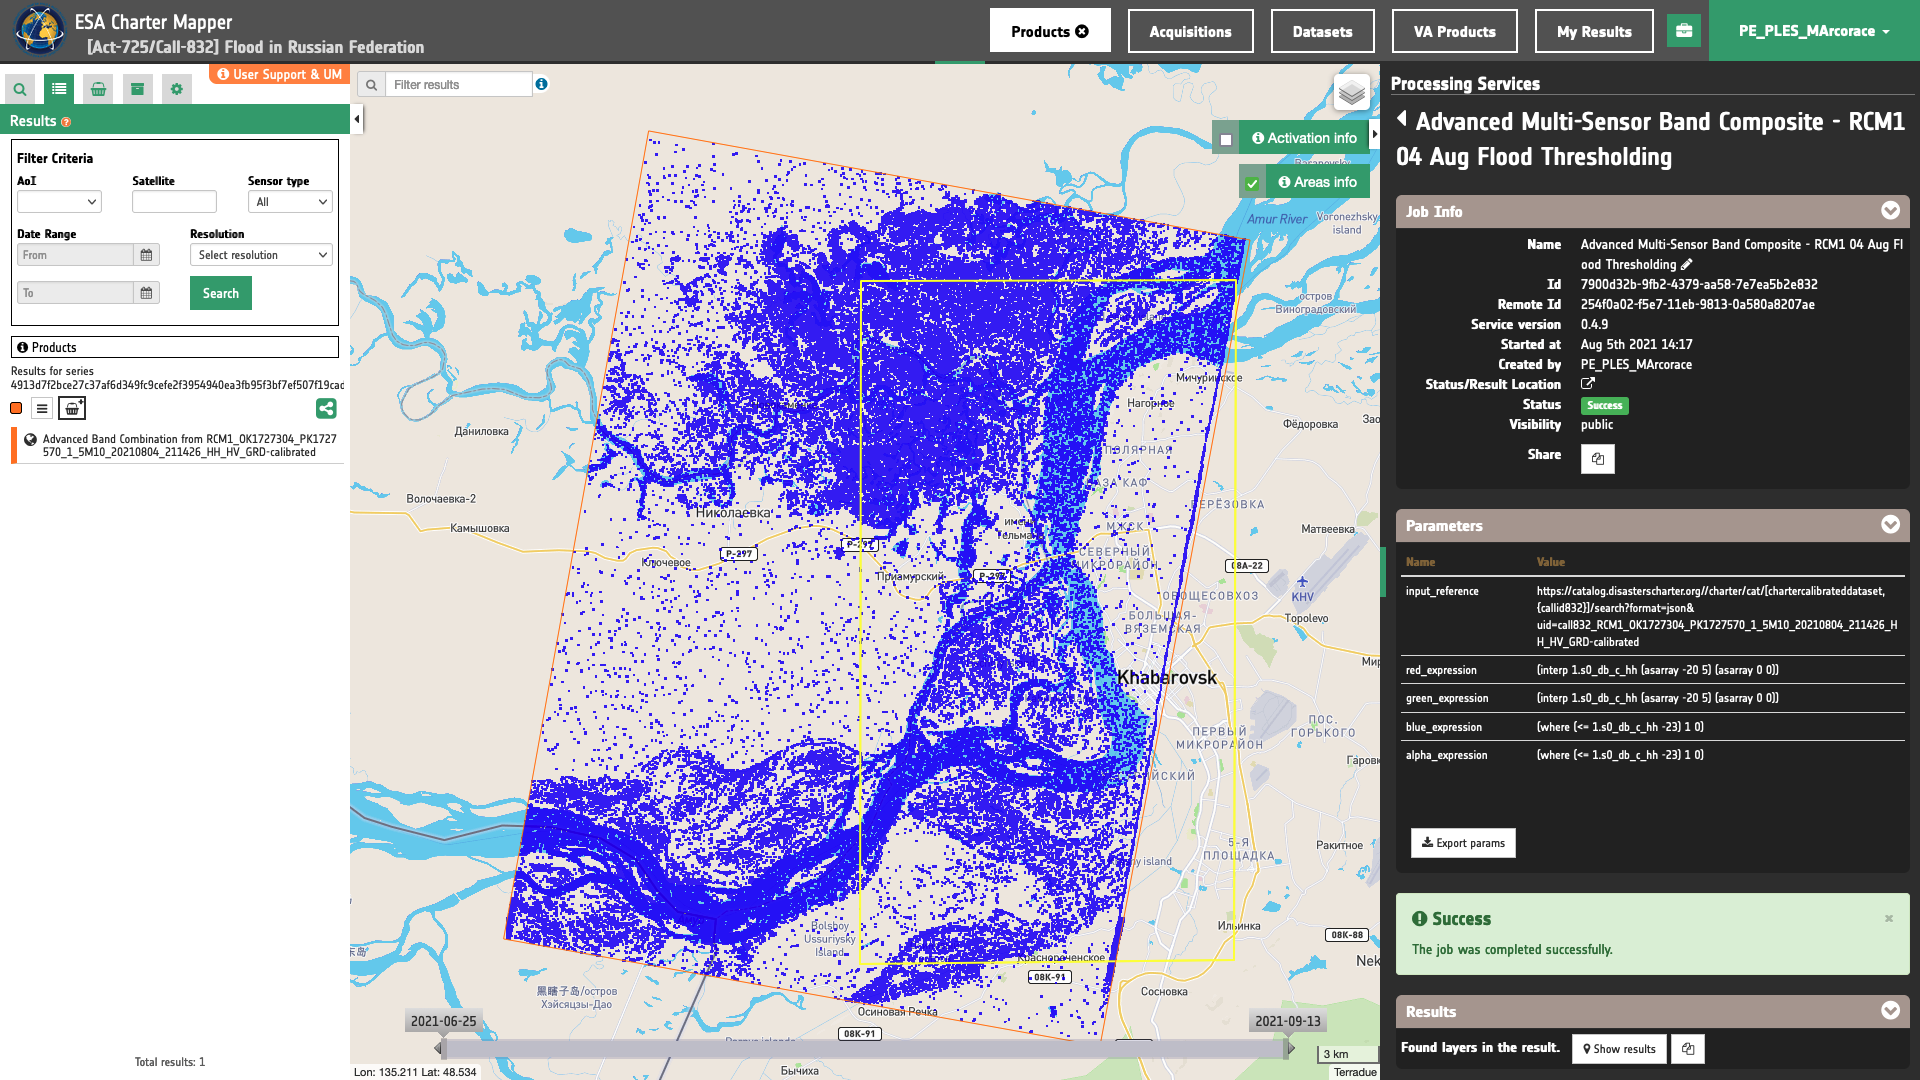
Binarization from SAR Data
A water mask can be derived from calibrated SAR data (C-band, HH polarization) via binarization using the following s-expressions:
- Red channel expression
(interp 1.s0_db_c_hh (asarray -23 5) (asarray 0 0))
- Green channel expression
(interp 1.s0_db_c_hh (asarray -23 5) (asarray 0 0))
- Blue channel expression
(where (<= 1.s0_db_c_hh -23) 1 0)
- Alpha channel expression
(where (<= 1.s0_db_c_hh -23) 1 0)
Params
{
   "input_reference": [
       ""
          ],
   "red_expression": "(interp 1.s0_db_c_hh (asarray -23 5) (asarray 0 0))",
   "green_expression": "(interp 1.s0_db_c_hh (asarray -23 5) (asarray 0 0))",
   "blue_expression": "(where (<= 1.s0_db_c_hh -23) 1 0)",
   "alpha_expression": "(where (<= 1.s0_db_c_hh -23) 1 0)"
}
-
John McCarthy (MIT), Recursive Functions of Symbolic Expressions and Their Computation by Machine. ↩